Fluctuations, dissipation, and nonuniversal superfluid jumps in two-dimensional superconductors
Abstract
We report a comprehensive study of the complex AC conductivity of thin effectively 2D amorphous superconducting InOx films at zero applied field. Below a temperature scale where the superconducting order parameter amplitude becomes well defined, there is a temperature where both the generalized superfluid stiffness acquires a frequency dependence and the DC mangetoresistance becomes linear in field. We associate this with a transition of the Kosterlitz-Thouless-Berezinskii (KTB) type. At our measurement frequencies the superfluid stiffness at is found to be larger than the universal value. Although this may be understood with a vortex dielectric constant of within the usual KTB theory, this is a relatively large value and indicates that such a system may be out of the domain of applicability of the low-fugacity (low vortex density) KTB treatment. This opens up the possibility that at least some of the discrepancy from a non-universal magnitude is intrinsic. Our finite frequency measurements allow us access to a number of other phenomena concerning the charge dynamics in superconducting thin films, including an enhanced conductivity near the amplitude fluctuation temperature and a finite dissipation at low temperature which appears to be a universal aspect of highly disordered superconducting films.
pacs:
74.40.+k,74.25.Fy,78.67.-n,78.70.GqI Introduction
Superconducting fluctuations have been an area of investigation for many years Larkinreview ; SkojTink , yet very many completely central issues even in conventional superconductors are not understood Benfatto ; SachdevKTB . Recently, interest in superconducting fluctuation phenomena has been renewed and indeed been thrust under the lights due to focus on the high-temperature superconductors, where many believe them to play a central role in the phenomenology of underdoped compounds EmeryKivelson ; Ong ; Corson .
In the usual view, as one approaches the nominal superconducting transition temperature Tc from above, thermal fluctuations in the amplitude amplitudedisc of the complex superconducting order parameter (OP) occur. If the fluctuations are small, they can be expressed in terms of a Gaussian approximation within the Ginzburg-Landau (GL) theory. In such a treatment it is envisioned that the free energy fluctuations of the OP’s amplitude inside a coherence volume are of order . In the context of the microscopic theory, this physics can be found as the Aslamazov-Larkin (AL) contribution to the conductivity AslaLarkin ; Tinkham .
In a typical good 3D BCS superconductor such fluctuations occur only vanishingly close to . However the fluctuation regime can be significantly enhanced for a thin dirty short coherence length () superconductor (thickness ) where the coherence volume becomes . In actuality true long range order of a continuous OP cannot exist for in a 2D system, but the expectation is that there is still a crossover temperature Tc0 where the superconducting amplitude becomes relatively well defined, although the phase still fluctuates. It is believed an actual phase transition does not occur until a possibly much lower temperature where a transition to a topologically phase ordered state can take place. Such a so-called Kosterlitz-Thouless-Berezinskii (KTB) Berez ; KToriginal transition can be written formally in a system with 2D or U(1) symmetry as a vortex-antivortex unbinding transition from a state of matter with a generalized rigidity (the superfluid stiffness) and power-law correlations to one with no rigidity and only exponential correlations. Above the transition, the superconducting phase fluctuates via unbound vortex excitations. It is the finite superfluid stiffness at low temperature that allows the phase to assume a well-defined value. The superfluid stiffness is proportional to the superfluid density and the expectation is that the KTB transition is typified by a discontinuous jump in this parameter, which in certain limits takes on a universal value given by the transition temperature itself . It is relatively well established that a KTB transition with a universal jump occurs in thin superfluid He4 layers KTBhelium , although the situation in thin homogeneously disordered superconductor films is far from clear.
For the case of superconductors, KTB physics has been mainly investigated via linear and non-linear DC transport Beasley ; Fiory1983 ; Hebard1983 ; Hebard1985 ; Hsu1992 ; Kadin where various predictions exist for the temperature activated resistance and power law of the IV characteristics. It has been found that the experimental situation is roughly consistent with theoretical predictions, with, for instance, the exponent of a decreasing function of temperature until dropping quickly to become at a temperature not so far from the expected . Measurements of the frequency dependent conductivity should, in principle, allow more specific tests of theories for various fluctuation regimes and crossovers between them due to the sensitivity of the probe to the time scale of the fluctuations themselves. Moreover, finite frequency measurements lend themselves to the study of both real and imaginary components of the charge response which gives more information and allows a more precise comparison to theory. In relatively thick films, a few groups have shown via infrared and microwave transmission in granular or low disorder lead and aluminumLeadAC ; AlAC1 ; AlAC2 ; AlAC3 that there was a region around the bulk that had superconducting fluctuations consistent with the dynamic AL amplitude fluctuation form. In high disorder thin films, using much lower frequencies, a number of groups have shown a dependence roughly consistent with the predictions of the dynamic extension of the KTB formalism Fiory1983 ; Hebard1980 ; Turneaure ; Fiory ; Yazdani , although certain discrepancies exist.
So although various aspects of the commonly accepted picture have been reported, in-depth characterization of the finite frequency dynamics of both the Gaussian and vortex regimes have not been made, nor has a clear picture emerged as to how the system evolves from one regime of dominant fluctuations to the other, before ultimately entering the low temperature phase. Moreover, it has never been shown whether or not these signatures of KTB physics actually occur at a superfluid stiffness given by the universal jump condition and by extension exactly what the nature of the low temperature state is. In this paper we present a comprehensive study of the AC conductivity of highly disordered InOx films at GHz frequencies. We find that below a temperature where the superconducting amplitude becomes well defined, the films exhibit a temperature region where the generalized frequency dependent superfluid stiffness acquires a frequency dependence. We observe that at essentially the same temperature the DC magnetoresistance becomes linear in applied field. This is the generic behavior expected near a KTB transition, however in the present case it is exhibited at a stiffness well above the predicted universal value for the inferred . Although it is possible to understand this within the usual KTB theory with a vortex dielectric constant of , this relatively large may indicate that the vortex fugacity is too large in such a system for the conventional low vortex density KTB treatment. This opens up the possibility that at least some of the non-universal value of the superfluid stiffness at TKTB is intrinsic. At the lowest temperatures, we continue to observe a finite dissipation, which we correlate to an inhomogeneous superfluid density distribution. These results are put in the context of the considerable existing literature.
II Experimental Details
For these measurements, high purity (99.999 %) In2O3 was e-gun evaporated under high vacuum onto clean 1mm thick 19mm wide sapphire discs. Our synthesis methods are patterned off of the work of Ref. Ovadyahu where it was shown that amorphous InOx can be reproducibly made by a combination of e-beam evaporation of In2O3 and possibly annealing at low temperatures. This is unlike films prepared via other methods HebardNakahara ; Zhu . Essentially identical films have been used in a large number of recent studies of the 2D superconductor-insulator quantum phase transition Steiner1 ; Steiner2 ; Murthy04 ; Murthy05 ; Murthy06 ; CranePRL ; Gantmakher . Thin machined aluminum masks were used to pattern the films creating a 200 -thick 3mm-wide circular amorphous film centered on the disc. Sample deposition was well controlled and for a certain conditions samples can be made reproducibly Murthy04 ; Steiner2 . For structural characterization, we co-deposit two more films along with the sample: (1) onto a TEM grid for electron diffraction. (2) for AFM scans. We believe that the films are morphologically homogeneous with no crystalline inclusions or large scale morphological disorder for the following reasons:
1. The TEM-diffraction patterns are diffuse rings with no diffraction spots, suggesting amorphous films with no crystalline inclusions.
2. The AFM images show continuous films with no voids or cracks and in fact are completely featureless down to a scale of a few nm (the resolution of the AFM).
3. The R vs T curves when investigating the 2D superconductor-insulator transition Murthy04 ; CranePRL in these films are smooth with no re-entrant behavior that is the hallmark of gross inhomogeneity.
AC conductivity was measured in a novel cryomagnetic resonant microwave cavity system. The cavity diameter was optimized for performance in the 22 GHz ( K) TE011 mode. A number of other discrete frequencies from 9 to 106 GHz were accessible by insertion of an additional sapphire puck (for the low frequencies) or use of a very short ”pan”-shaped cavity (for greater than 100 GHz). Our highest operating frequency of 106 GHz corresponds in temperature units (using ) to 5.09 K, but as we will point out below, using the BCS relation and the temperature scale where the amplitude becomes well defined (2.28 K) the threshold for above gap excitation is 158 GHz. The lack of sample heating was ensured by operating in regime where the response was independent of input power. Relations between the resonances’ frequency shift and change in quality factor upon sample introduction to the complex conductivity are obtained by a cavity perturbation technique KotzlerBrandt1 ; KotzlerBrandt3 ; Redbook ; Peligrad (see Waldron for a very thorough treatment). This standard experimental technique is based on the adiabatic modification of the electromagnetic fields in a cavity that arises from the introduction of a small sample to the interior of the cavity. Our data are analyzed in the depolarization regime in which the fields in the cavity penetrate the entire volume of the sample. It has been shown that for extremely thin films, only in-plane AC electric fields or out-of-plane AC magnetic fields at the sample position can affect an appreciable change in a cavity’s resonance characteristics Peligrad2 . Samples were placed along the cavity’s central axis, where due to symmetry consideration and depending on the particular TE mode being used, if the electric field is in-plane then there is a zero out-of-plane magnetic field and vice versa.
Modes with both these field configurations were exploited in our setup and their analysis differed. The formulas used for analysis will be stated here for completeness in terms of the complex frequency . For the case of an in-plane electric field, the complex frequency shift is
| (1) |
where is the complex conjugate of the conductivity, is the depolarization factor, is a ”filling factor”, and is a constant that depends on the particular mode used. In the present case the sample is so thin that is very small () and so there is only very weak mixing between components of the complex frequency shift into the complex conductivity, so that the real part of the conductivity is largely proportional to the change in and the imaginary part of the conductivity is largely proportional to the shift in .
For the case of the sample being in a perpendicular AC magnetic field the results are obtained following KotzlerBrandt3
| (2) |
where is again the “filling factor” and is the susceptibility which includes not only the response from localized electric and magnetic dipoles, but also the response from induced AC currents. This is relevant for our analysis in a magnetic field anti-node since the response from the local electric dipole moments will be zero (electric field node), the local magnetic moments are zero (non-magnetic material), and so the cavity perturbation is due to the induced currents in the superconductor which has been fully penetrated by the external rf-field. Brandt KotzlerBrandt1 ; BrandtTheoryPRB has worked out the susceptibility for a thin superconducting disk in a perpendicular DC field due to in-plane AC currents from a superimposed AC field and found
| (3) |
where the quantity we wish to extract, namely the dynamic conductivity is contained in the normalized frequency where is the radius and the thickness of the sample. The coefficients and are given in Ref. KotzlerBrandt3 , where it is found that to well within experimental accuracy, the series can be represented by a small number of terms. We use 30 elements - as in previous studies - but in reality many less are actually needed. With these relations in hand, the complex conductivity can be extracted from the complex frequency shift. Here also, due to the thinness of the samples, there is only weak mixing between real and imaginary frequencies into the components of the complex conductivity.
Although theoretical values exist for , in practice the conversions to complex conductivity were made by adjusting the free parameters for the two schemes ( and for the E-field case and for the B-field case) so that the AC resistance matched DC data at temperatures well above the occurrence of superconductivity and using the expectation that the superfluid stiffness (defined below), was frequency independent at H=0 and low temperature. With a unique sample dependent depolarization factor and ’s that depend on the particular mode being used a unique set of normalization factors could be found.
DC resistance was measured on co-deposited samples in a two-probe configuration by low frequency AC lock-in techniques using excitation currents of approximately . The probe’s lead resistances, which have a negligible temperature dependence in the displayed temperature range, were well characterized and have been subtracted from the displayed data.
III Results
We are interested in understanding the fluctuation behavior of the complex order parameter as the temperature is lowered towards the superconducting state. A finite frequency probe has access to this information because the complex electrodynamic response of a superconductor at experimental frequencies below the gap can be approximated as and , where () is the density of superconducting (normal) electrons, is the relaxation time for normal electrons, and and are the electron charge and mass respectively. We note that, in fact, in a highly disordered superconductor the contribution from normal electrons is very small as the carrier lifetime is very short. In particular, the normal electron contribution to is negligible when as certainly the case here in our highly disordered material. As will be shown below, also importantly for our study, the extremely short normal state lifetime causes even the above gap contribution to for to be below detectable levels for our experimental frequencies. This is important and means that our is still almost purely due to the superfluid response even at elevated temperatures when the superconducting gap begins to close.
For a fluctuating superconductor one can define where the fluctuation effects are captured by a frequency-dependent superfluid density CranePRL ; KTdynamics . A definition as such - or in terms of an equivalent frequency dependent superfluid stiffness (defined below) - has been the usual treatment within the finite frequency KTB theory KTdynamics , where AC measurements allow one to probe the system on shorter length scales and reveal superconducting fluctuations even above .
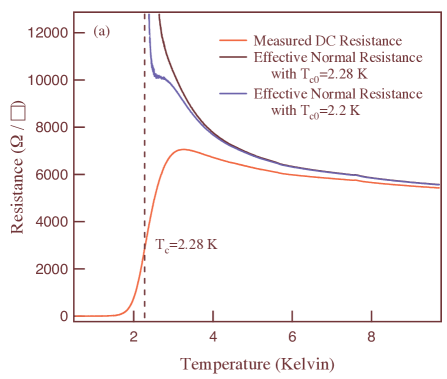
We begin by examining the DC data, as shown in Fig. 1. We observe a broad region over which the superconducting transition occurs. The contribution of Gaussian amplitude fluctuations can be obtained by fitting to the Aslamazov-Larkin DC form. Using the procedure of Gantmakher Gantmakher , a lower bound on can be estimated as the lowest temperature that does not cause an inflection point in the extracted effective normal state resistance as defined by the full expression for the Aslamazov-Larkin fluctuation resistivity.
| (4) |
Within this analysis is the best lower bound on and represents the temperature scale below which the superconducting amplitude is relatively well defined. Lower values of produce a kink in the extracted resistivity, where for instance a of is clearly too low as seen in Fig. 1a.
As mentioned above, the imaginary conductivity is proportional to the superfluid density, which then sets the scale for the superfluid stiffness - the energy scale to introduce phase slips in the superconducting order parameter. We extract this generalized superfluid stiffness (in degrees Kelvin) from the conductivity via the relation (as done similarly recently Corson ), where is the quantum of conductance for Cooper pairs divided by the sample thickness. We emphasize that in our notation is not a temperature per se, but is an energy scale expressed in temperature units. Our superfluid stiffness is essentially kinetic inductance expressed in temperature units. We could express this quantity in any one of a number of equivalents units Lobb including superfluid density. We prefer this parametrization as it is unnecessary to make an estimate for quantities such as the Cooper pair mass. Moreover with these units the universal jump condition for the KTB transition is of the particularly simple form . The fluctuations of the superconducting state can be captured by the frequency dependence of the stiffness, which would otherwise be frequency independent.
In the absence of fluctuations, we expect an accurate description of the superfluid stiffness would be given by the dirty limit mean-field BCS theory, which predicts the onset of superconductivity at a temperature , with a temperature dependence of given by Tinkham ; Sheahen
| (5) |
where is the temperature dependent gap function and Sheahen1966 .
In Fig. 2 we show the temperature dependence of the superfluid stiffness measured at various frequencies alongside the prediction of equation 5. The mean field curve has been generated by specifying the conductivity in the normal state and then varying to obtain the best fit to the data at the lowest temperature. We extract a transition temperature scale of 3.47 which we associate with a microscopic scale where the superconducting transition occur in the absence of fluctuations. This very large temperature scale is over 1.6 times the temperature where the amplitude becomes well defined and over 3 times the scale of the onset of phase coherence (defined below) and shows the paramount role that superconducting fluctuations play in such a material. We also see that the superfluid stiffness curves progressively approach the mean field curve at higher frequencies. However, because of the enhanced role of fluctuations all of the curves approach zero at a temperature below .
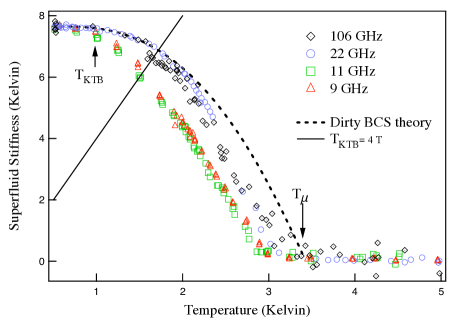
The experimental curves in Fig. 2 show a broad temperature region characterized by a gentle roll off of the superfluid stiffness with increasing temperature. We observe a distinct temperature where the superfluid stiffness acquires a frequency dependence. Within the standard theory, such an occurrence is indicative of the approach to a KTB transition. In this model, the zero-frequency superfluid stiffness is renormalized discontinuously to zero at a temperature set by the superfluid stiffness itself at this temperature. Above the system still appears superconducting on short length scales set by the separation between thermally generated free vortices and therefore at finite frequencies we expect the superfluid stiffness to approach zero continuously. As is the temperature where vortices proliferate, in at least moderate fugacity (a quantity related to the vortex core potential and defined below) superconductors, the temperature where the superfluid stiffness curves measured at different frequencies deviate from each other can be identified with the approach to . As mentioned above, with our units of superfluid stiffness the predicted transition temperature is , which is shown as a solid line in the figure. We point out here that although a frequency dependence as such is seen in Fig. 2, the stiffness where acquires its frequency dependence is well above the stiffness predicted to be critical value. This is presumably due to the finite measurement frequency. We will expand on this point below.
Using the BCS relation and the measured K, all operating frequencies are below the BCS expectation of 158 GHz for above threshold gap excitation. Although at the lowest temperatures our highest frequency is well below the superconducting gap, in principle, there can be a normal electron contribution to from both thermally excited quasiparticles at as well as from above gap excitations when on the approach to Tc. In practice, however these give a neglible contribution to the response in a highly disordered superconductor. We can give a rough estimate of this contribution by a very approximate calculation. Mangetoresistance measurements on similar samples have shown that the coherence length is approximately 6 nm Steiner2 . As such highly disordered superconductors have their coherence length set by the carrier mean free path, we can take this value to be of the order of the normal electron scattering length. With a reasonable estimate for the Fermi velocity (c/200), this gives the very large effective scattering rate () of approximately 200 - 300 THz. This is reasonable based on the high disorder and large normal state resistivity of our sample. An estimate based on the normal state Drude conductivity and using a free electron mass and carrier density estimated from Hall measurements on similar samples (cm3) ShaharOvadyahu gives a magnitude of the same order.
Using this scattering rate, the Drude relations, our definition of , and its measured low temperature value (7.66 K) we can estimate the maximum possible contribution to the measured stiffness from ”normal” electrons if all the spectral weight in the superconducting delta function became subject to normal state scattering as
| (6) |
At even our highest frequency, this represent a total contribution of less than K, which is far smaller than our sensitivity. We note that even if we overestimated that effective scattering rate by even a factor of 100 the contamination contribution would only be 0.02 K which is still well below our sensitivity. Hence, the contribution from “normal” electrons give a completely insignificant contribution to and hence .
As an aside we will note that an order of magnitude estimate of the effective superconducting electron density can be found via the definitions given above using the free electron mass and the limit of K gives an approximate value of which can be compared to the Hall effect derived number of cm3 ShaharOvadyahu . The effects of disorder are significant in reducing the number of charges that participate in pairing.
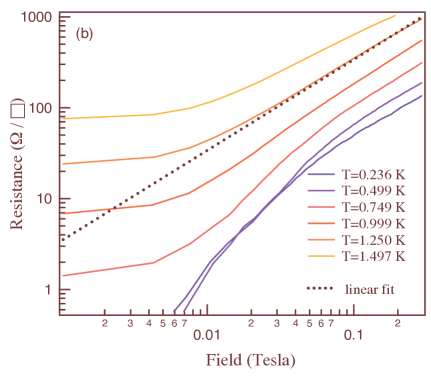
Fig. 3 shows the low field magnetoresistance data. We notice in the isotherms of magnetoresistance there is a range of intermediate temperatures above the low field saturation regime where the resistance changes from concave down to concave up with magnetic field. The condition for low fields has previously been associated with the Kosterlitz-Thouless-Berezinskii temperature linearB based on the Minnhagen criterion Minnhagen1981 and was applied Hebard1990 to similar samples of InOx.
Power law fits to the low field data (well above the saturation regime) of the magnetoresistance () curves gives a temperature dependent exponent in this range. An interpolation of the data gives a temperature of where . Interestingly, this temperature is to within the experimental uncertainty of where the superfluid stiffness acquires a frequency dependence in Fig. 2. On the basis of the above, we associate a temperature in the range of with a transition of the KTB type involving vortex unbinding and proliferation at a non-universal value of the superfluid stiffness.
We also note that the zero-field resistance is finite just below our inferred . Such an observation is not surprising within the usual KTB theory with our non-neglible excitation current () and the possibility of small residual magnetic fields, as the critical current and field of a 2D superconductor are zero. Finite resistance below the inferred has been observed before Hsu1992 ; Kadin , but is not a universal observation Hebard1980 .
Within the simplest conception of the KTB theory the transition occurs at a value of the superfluid stiffness given by the above universal jump condition, where the superfluid density is driven to zero at TKTB by a cascade of vortex proliferation. As noted above, our frequency dependence is acquired in Tθ at a stiffness that is in excess of the universal prediction. It is important to realize that this prediction is for the zero frequency stiffness (longest length scales) and higher frequency probes can reveal larger values that don’t take into account long wavelength renormalizations. Hence, transitions at non-universal values of the bare (shortest length scales) superfluid stiffness can occur where a large superfluid stiffness is renormalized downward even below TKTB by thermally excited vortices if the vortex potential for their activation is low enough. Our finite frequency measurements allows us to probe the system on intermediate length scales that are between these two limits. Within the usual KTB theory, the transition will occur at a universal value of the superfluid stiffness where the renormalization factor is given by a vortex dielectric constant which incorporates the screening effects of intervening thermally excited vortex-antivortex pairs where is the so-called vortex fugacity (related to the thermal excitation probability) and is the vortex core potential. In order that the frequency dependence is observed at a Tθ of the universal value at TKTB, one must be specifically in the low vortex density (low fugacity) limit. It is not clear that thin film superconductors are generically in this limit.
We can estimate if we associate our extracted mean field superfluid stiffness as the unrenormalized bare superfluid value and take as the fully renormalized number the KTB prediction at the temperature at which the frequency dependence in the superfluid stiffness is acquired. With this procedure we find a of 1.9. This can be compared to a value of 1.3 for both simulations of the 2D model MinnhagenNylen as well as experiments on thin He4 films KTBhelium ; Agnolet . According to the above fugacity relations this gives a core potential of . This core potential is a sum of core energy and entropy terms ln where is the core energy and represents the number of statistically independent sites that two vortices can occupy within a coherence area and is of the order of . Using this estimate we get a core energy of , which is of the expected magnitudedisclaimer . An understanding of our results is not impossible within the usual KTB theory, however this large is indicative of a relatively large fugacity. As the usual KTB relations are derived in the limit of low fugacity and hence low vortex density our results may mean superconducting films as such are out of the domain of applicability of the low fugacity theory.
A number of workers have raised the possibility that if the fundamental assumption of low fugacity is violated, intrinsically different physics may result, which may also be consistent with our observations. For instance, Minnhagen and coworkers have postulated an expanded set of KTB renormalization equations valid at larger fugacities and shown that out of the low fugacity limit and above a critical value of the transition may exhibit different behavior, including a non-universal jump of the renormalized superfluid stiffness and perhaps even a first order transition Minnhagen ; Jonsson . Such considerations may be relevant in our case with our . Additionally it has been proposed GabayKapitulnik ; Zhang that at large fugacities vortices may not form bound vortex-antivortex pairs below TKTB and instead, their density is high enough that they crystalize into a vortex ionic crystal. Superconducting phase coherence is disrupted by the melting of this crystal, as opposed to the unbinding of vortex-antivortex pairs. Some evidence for such lattice formation and subsequent melting exists in numerical simulations Teitel .
Irrespective of its origin, we associate this temperature determined by both magnetoresistance and AC conductivity to be the temperature scale where superconducting phase coherence is destroyed. Our analysis above has been made possible by the fact that our highest measurement frequencies are large enough to be close to the high frequency limit (as shown by the negligible frequency dependence between 22 GHz and 106 GHz curves and their relative closeness to the mean field curve) and thereby we can measure the unrenormalized superfluid stiffness.
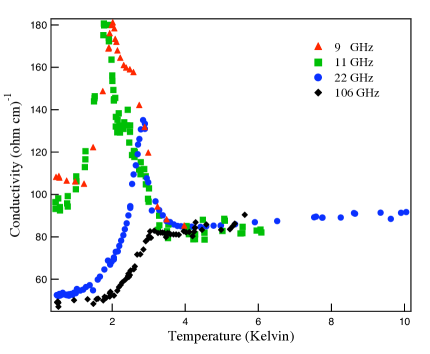
Having established the temperature scales of the various fluctuation phenomena in the problem we now discuss the dissipative response of the real part of the conductivity (Fig. 4), focusing our attention on the peak as well as the low temperature absorption. We interpret this dissipation peak in as arising from a partially coherent superfluid, as was conjectured previously in Ref. Corson . We observe that this peak, found in the temperature region of amplitude fluctuations, shifts to higher temperatures and its amplitude decreases as the frequency increases. Such an effect is not predicted within the finite frequency Gaussian AL theory where the peak in is always at Tc SkojTink ; Tinkham .
This behavior may be understood by comparing the length scale set by the fluctuations and those set by the frequency of the measurement probe. At very high temperatures, well above the fluctuation regime, there are no superconducting fluctuations. As the temperature is lowered the characteristic length scale for these fluctuations increases. Higher frequencies probe the system on shorter length scales, and therefore are able to measure the onset of fluctuations at higher temperatures. We would also like to understand why there is a difference in the height of the different dissipation peaks at different frequencies in Fig. 4. This may be understood heuristically by returning to the “dirty BCS theory” mean field curve in Fig. 2, and noticing that as the temperature decreases the superfluid stiffness is a rapidly increasing function of temperature in this range. For a given measurement frequency, the dissipation peak occurs when the timescale of the measurement probe matches the timescale of the superconducting fluctuations, and the peak height is proportional to the superfluid at that temperature. Since this occurs at higher temperature for the higher frequency probes, and the superfluid stiffness is a strong function of temperature in this range, the peak height is expected to decrease with increasing frequency.
We can examine this further using a simple relaxation model Waldram which attempts to incorporate the observed frequency dependence of in a simple way
| (7) |
where is the measured finite frequency conductivity, is the normal DC conductivity (fit using a temperature dependent extrapolation Waldram ; WaldramCites ) combined with the DC Aslamazov-Larkin fluctuation conductivity from equation 4 which appears to be the substantial contribution to the resistivity in this temperature region. We can use this to parameterize the data in terms of , which can then be compared with the Ginzburg-Landau result . This is shown in figure 5.
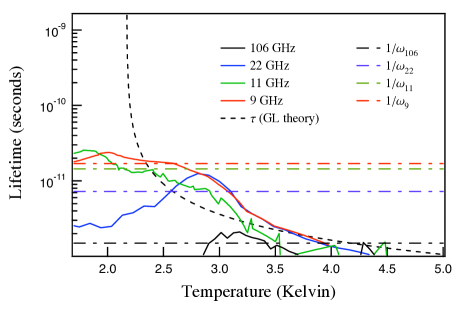
The basic assumption of this approach is that there is a contribution to in this temperature region which - at zero frequency and temperatures above - is described by the Gaussian approximation given by the DC Aslamazov-Larkin formula in equation 4. We then expect that the extracted from the DC data should appropriately capture the underlying physics. To account for the frequency dependence, we assume a relaxation model in which the evanescent pairs contribute to the conductivity for a time before decaying back into normal electrons. As shown in Fig. 5, such a modelling qualitatively accounts for the frequency dependence as evinced by the relative collapse of the ’s extracted at different frequencies in Fig. 4. Importantly, we also see that this treatment gives a plateau near indicating a slowing down of the fluctuation dynamics that we are sensitive to. If, as we believe, the dissipation in this temperature range is largely sensitive to the fluctuations of the superconducting amplitude then the plateau is consistent with our interpretation that there is a temperature Tc0 where the amplitude fluctuations become frozen out. Finally, it is important to note the temperature where the measured equals the inverse of the measurement frequency occurs at approximately the same temperature where we find a peak in the dissipative () response in Fig. 4. This supports the notion that the peak in arises when the bandwidth of the probing frequency matches the lifetime of the fluctuations.
Finally, we would like to point out the finite dissipation () in Fig. 4 in the limit , which is not accounted for by the BCS derived theories of Mattis-Bardeen Tinkham ; MattisBardeen nor Leplae Leplae , which predict that dissipation disappears for as . Anomalous absorption as such has been seen previously in other highly disordered superconducting films Karecki as well as in Bi-based high-temperature superconductors Corson2 which may show nanoscale inhomogeneity PanDavis . The dissipation in the case of the Bi-based high-temperature superconductors was interpreted as a consequence of an inhomogeneous superfluid density distribution. Such a situation is certainly a possibility here in our highly disordered films. We reiterate, however, that our amorphous films are themselves morphologically homogeneous down to the lowest measured length scales (nanometers) as detailed above. It would be interesting to perform an scanning tunnelling microscopy study to make a detailed comparison with the cuprate superconductors. That any inhomogeneity could arise out of films which are essentially homogeneous on all measurable length scales is the interesting and remarkable aspect. It is perhaps indicative of an exponential sensitivity to the disorder which inevitably exists at the shortest length scales (the materials are amorphous). This extreme sensitivity to disorder and dynamically created inhomogeneity is then interesting in its own right as it is an intrinsic part of the problem Ghosal1 ; Ghosal2 . Similar conclusion about dynamically created inhomogeneity have been arrived at previously via DC transport based probes in similar films Ovadyahu .
We note that such an interpretation need not change our assumption of a frequency independent superfluid stiffness at and . These other measurements that have seen low T dissipation (for instance Ref. Corson2 ) measure the superfluid stiffness’s absolute value directly and find that it is frequency independent at low T. Additionally, we will point out that explicit theoretical models that treat such a scenario (within an effective medium granular scenario; for instance Ref. Stroud ) with intermixed superconducting and metallic grains finds that the still has its characteristic dependence (and hence the superfluid stiffness in frequency independent) for globally superconducting systems. This derives from the delta function in at which Kramers-Kronig constrains the frequency dependence of .
Finally, we point out that as an alternative path to describing this dissipation, it has been proposed that dissipative phenomena may be generic in the vicinity of quantum critical points Mason . In this regard, our system is not very far in parameter space to the 2D disorder-tuned superconductor-insulator quantum phase transition Murthy04 and may be effected by this physics.
IV Conclusion
In this work we have established various temperature scales associated with the crossover between Gaussian and KTB-vortex fluctuations. We have been able to independently establish the temperature of a KTB-like vortex unbinding transition by AC techniques which allowed us to determine where the superfluid stiffness acquired a frequency dependence, as well as by DC measurements using the Minnhagen criterion. The magnitude of the superfluid stiffness disagrees with the prediction for the universal superfluid jump criterion at . Although this can be understood by invoking a relatively large vortex dielectric constant , which can renormalize the stiffness from a bare value to the universal value, it is also indicative of a high fugacity, which may invalidate the low-fugacity assumptions under which the KTB theory is derived.
We have also shown how the peak in the dissipative piece of the complex response arises from superconducting fluctuations near . In this model, the peak arises when the timescale of the measurement matches the lifetime of the fluctuations and we have given a simple model that causes a collapse in the relaxation time measured at different frequencies. We give a simple picture that describes this behavior and which shows how the dynamics slow upon passing below the amplitude temperature scale. Finally, we have discussed how the dissipative piece of the complex conductivity can be understood as arising from an inhomogeneous superfluid.
V Acknowledgements
The authors would like to thank L. Benfatto, E.H. Brandt, and D. Peligrad for useful correspondences, V. Zaretskey for help with the instrumentation development and K. Holczer for experimental support at a crucial time in this project. Research at UCLA was supported by the NSF (DMR-0454540). Research at the Weizmann Institute was supported by the ISF, the Koshland Fund and the Minerva Foundation.
References
- (1)
- (2) A. I. Larkin and A. A. Varlamov, in Handbook on Superconductivity: Conventional and Unconventional Superconductors, K.-H. Bennemann and J. B. Ketterson eds., Springer, Berlin (2002) and references therein.
- (3) W. J. Skocpol and M. Tinkham, Rep. Prog. Phys. 38, 1049 (1975).
- (4) L. Benfatto, A. Perali, C. Castellani, M. Grilli, Euro. Phys. Jour. B 13, 609 (2000).
- (5) Subir Sachdev, Physica C 408, 218 (2004).
- (6) V. J. Emery and S. A. Kivelson, Nature 374, 434 (1995).
- (7) Z. A. Xu, N. P. Ong, Y. Wang, T. Kakeshita, and S. Uchida, Nature 406, 486 (2000).
- (8) J. Corson, R. Mallozzi, J. Orenstein, J. N. Eckstein and I. Bozovic, Nature 398, 221 (1999).
- (9) As is common in the literature, in this paper we make a distinction between regimes of amplitude fluctuations and regimes of phase fluctuations. It is important to keep in mind that, in fact, because the phase becomes ill-defined as the amplitude vanishes, amplitude fluctuations manifestly include a fluctuating phase.
- (10) L. G. Aslamazov and A. I. Larkin, Fiz. Tverd. Tela 10, 1104 (1968) [Sov. Phys. Solid State 10, 875 (1968)].
- (11) M. Tinkham, Introduction to Superconductivity (McGraw-Hill, New York, 1975).
- (12) T. P. Sheahen, Physical Review 149, 368 (1966).
- (13) V.L. Berezinskii, Sov. Phys. JETP 32, 493 (1971), V.L. Berezinskii, Sov. Phys. JETP 34, 610 (1972)
- (14) M. Kosterlitz and D. Thouless, J. Phys. C 6, 1181 (1973).
- (15) D. J. Bishop and J. D. Reppy, Phys. Rev. Lett. 40, 1727 1730 (1978).
- (16) A. F. Hebard and M. A. Paalanen, Phys. Rev. Lett. 54, 2155 (1985).
- (17) A. M. Kadin, K. Epstein, and A. M. Goldman, Phys. Rev. B 27, 6691 (1983).
- (18) M. R. Beasley, J. E. Mooij, T. P. Orlando, Phys. Rev. Lett. 42, 1165 (1979).
- (19) A.T. Fiory, A.F. Hebard, and W.I. Glaberson, Phys. Rev. B 28, 5075 (1983).
- (20) A.F. Hebard and A.T. Fiory, Phys. Rev. Lett. 50, 1603 (1983).
- (21) J.W.P. Hsu and A. Kapitulnik, Phys. Rev. B 45, 4819 (1992).
- (22) D. B. Tanner, Phys. Rev. B 8, 005045 (1973).
- (23) R. V. D’Aiello and S. J. Freedman, Phys. Rev. Lett. 22, 515 517 (1969).
- (24) S. L. Lehoczky and C. V. Briscoe, Phys. Rev. Lett. 23, 695 697 (1969).
- (25) S. L. Lehoczky and C. V. Briscoe, Phys. Rev. B 4, 3938 3951 (1971).
- (26) A. F. Hebard and A. T. Fiory, Phys. Rev. Lett. 44, 291 (1980).
- (27) S.J. Turneaure and T. R. Lemberger, and J. M. Graybeal, Phys. Rev. Lett. 84, 987 (2000).
- (28) A. T. Fiory, A. F. Hebard, P. M. Mankiewich, and R. E. Howard, Phys. Rev. Lett. 61, 1419 (1988).
- (29) Ali Yazdani PhD. Thesis. Stanford University (1995).
- (30) D. Kowal and Z. Ovadyahu, Sol. St. Comm. 90, 783 (1994).
- (31) A. F. Hebard and S. Nakahara, Appl. Phys. Lett. 41, 1132 (1982).
- (32) F. Zhu, C. H. A. Huan , K. Zhang and A. T. S. Wee, Thin Solid Films 359, 244 (2000).
- (33) M.A. Steiner, G. Boebinger, and A. Kapitulnik, Phys. Rev. Lett. 94, 107008 (2005).
- (34) M.A. Steiner, A. Kapitulnik, Physica C 422, 16 (2005).
- (35) G. Sambandamurthy, L.W. Engel, A. Johansson, D. Shahar, Phys. Rev. Lett. 92, 107005 (2004).
- (36) G. Sambandamurthy, L. W. Engel, A. Johansson, E. Peled, and D. Shahar1, Phys. Rev. Lett. 94, 017003 (2005).
- (37) G. Sambandamurthy, A. Johansson, E. Peled, D. Shahar, P.G. Bjornsson, K.A. Moler, Europhysics Lett. 75, 611 (2006).
- (38) R.W. Crane, N.P. Armitage, A. Johansson, G. Sambandamurthy, D. Shahar, G. Gruner, submitted Phys. Rev. B.
- (39) V. F. Gantmakher and M.V. Golubkov, JETP Letters 73, 131 (2001).
- (40) E. H. Brandt, Phys. Rev. Lett. 71, 2821 (1993).
- (41) J. Kötzler, G. Nakielski, M. Baumann, R. Behr, and F. Goerke, E. H. Brandt,Phys. Rev. B 50, 3384 (1994).
- (42) O. Klein, S. Donovan, M. Dressel, G. Grüner, Int. J. Infrared Millim. Waves 14, 2423 (1993).
- (43) D.-N. Peligrad, B. Nebendahl, M. Mehring, A. Dulcic, M. Pozek, and D. Paar, Phys. Rev. B 64, 224504 (2001).
- (44) R. A. Waldron The Theory of Waveguides and Cavities, (Maclaren & Sons Ltd., London, 1967).
- (45) D.-N. Peligrad, B. Nebendahl, C. Kessler, M. Mehring, A. Dulcic, M. Pozek, D. Paar, Phys. Rev. B 58, 11652 - 11671 (1998).
- (46) E. H. Brandt, Phys. Rev. B 50, 4034 (1994).
- (47) Vinay Ambegaokar, B. I. Halperin, David R. Nelson, Eric D. Siggia, Phys. Rev. B 21, 1806 1826 (1980).
- (48) C. J. Lobb, David W. Abraham, and M. Tinkham, Phys. Rev. B 27, 150 (1983).
- (49) T. P. Sheahen, Physical Review 149, 368 (1966).
- (50) D. Shahar and Z. Ovadyahu, Phys. Rev. B 46, 10917 (1992).
- (51) S. Martin, A. T. Fiory, R. M. Fleming, G. P. Espinosa, and A. S. Cooper, Phys. Rev. Lett. 62, 677 (1988).
- (52) P. M. Minnhagen, Phys. Rev. B 23, 5745 (1981).
- (53) A. F. Hebard and M. A. Paalanen, Phys. Rev. Lett. 65, 927 (1990).
- (54) P. Minnhagen and M. Nylén, Phys Rev. B 31, 5768 (1985).
- (55) G. Agnolet, D.C. McQueeney, and J.D. Reppy, Phys. Rev. Lett. 52, 1325 (1984).
- (56) Note using a small of 0.05 as was done in Ref. Kadin gives unphysical results for .
- (57) P. Minnhagen, Phys. Rev. Lett. 54, 2351 2354 (1985)
- (58) A. Jonsson, P. Minnhagen, and M. Nylén, Phys. Rev. Lett. 70, 1327 1330 (1993).
- (59) M. Gabay and A. Kapitulnik, Phys. Rev. Lett. 71, 2138 (1993).
- (60) Shou-Cheng Zhang, Phys. Rev. Lett. 71, 2142 2145 (1993).
- (61) Jong-Rim Lee and S. Teitel, Phys. Rev. Lett. 66, 2100 2103 (1991).
- (62) J. R. Waldram, D. M. Broun, D. C. Morgan, R. Ormeno and A. Porch, Phys. Rev. B 59, 1528 (1999).
- (63) J. W. Loram, J. R. Cooper, J. M. Wheatley, K. A. Mirza, and R. S. Liu, Philos. Mag. B 65, 1405 (1992).
- (64) D.C. Mattis and J. Bardeen, Phys. Rev. 111, 412 (1958).
- (65) L. Leplae, Phys. Rev. B 27, 1911 (1983).
- (66) D. R. Karecki, G. L. Carr, S. Perkowitz, D. U. Gubser and S. A. Wolf, Phys. Rev. B 27, 5460 (1983).
- (67) J. Corson, J. Orenstein, Seongshik Oh, J. O’Donnell, and J. N. Eckstein, Phys. Rev. Lett. 85, 2569 (2000).
- (68) S. H. Pan, Nature 413, 282 (2001).
- (69) Amit Ghosal, Mohit Randeria, and Nandini Trivedi, Phys. Rev. Lett. 81, 3940 (1998).
- (70) Amit Ghosal, Mohit Randeria, and Nandini Trivedi, Phys. Rev. B 63, 020505 (2000).
- (71) J. Garner and D. Stroud, Phys. Rev. B 28, 2447(1983).
- (72) Aharon Kapitulnik, Nadya Mason, Steven A. Kivelson, and Sudip Chakravarty, Phys. Rev. B 63, 125322 (2001).