Evolution of the Electronic Structure of 1T-CuxTiSe2
Abstract
The electronic structure of a new charge-density-wave/ superconductor system, 1T-CuxTiSe2, has been studied by photoemission spectroscopy. A correlated semiconductor band structure is revealed for the undoped case. With Cu doping, the charge density wave is suppressed by the raising of the chemical potential, while the superconductivity is enhanced by the enhancement of the density of states. Moreover, the strong scattering at high doping might be responsible for the suppression of superconductivity in that regime.
Transition metal dichalcogenides (TMD’s) provide an important playground of interesting physics. Different chemical and structural configurations cause dramatic changes of their properties. For example, charge density wave (CDW) in two dimensional (2D) systems was first discovered in TMD’sWilsonAP . In the CDW state, an energy gap opens at the Fermi surface of 1T-structured TaS2ThPillo , but only partially opens for the 2H-structured TaS2ShenNaTaS , whereas there is no gap for 1T-TiSe2Aebi2 . Moreover, superconductivity usually coexists and competes with CDW in 2H-structured TMD’sValla2004 ; Castro ; shinScience , whereas it rarely exists in 1T structured compounds.
Recently, the discovery of superconductivity in 1T-CuxTiSe2 has further enriched the physics of TMD’s cavaNP . The undoped 1T-TiSe2 is a CDW material, whose mechanism remains controversial after decades of research. For example, some considered the CDW a band-type Jahn-Teller effect, where the electronic energy is lowered through structural distortionJT1 ; JT2 . Some considered it a realization of the excitonic CDW mechanism proposed by Kohn in the 1960’sKohn67 ; Wilson ; but different models were proposed to interpret the electronic structure, depending on whether system was argued to be a semi-metal, or a semiconductorKidd02 ; Aebi01 . With Cu doping, it was found that the CDW transition temperature quickly drops, similar to other MxTiSe2’s (M=Fe,Mn,Ta,V and Nb)Cui2006 ; Salvo78 ; Levy1980 ; Baranov2007 . Meanwhile, the superconducting phase emerges from and reaches the maximal transition temperature of 4.3K at , then decreases to 2.8K at . Quite remarkably, this phase diagram resembles those of the cuprate and heavy fermion superconductorsSciencereview , except here the competing order of superconductivity is the charge order, instead of the antiferromagnetic spin order. The presence of this ubiquitous phase diagram in 1T-CuxTiSe2 calls for a detailed study of its electronic structure. In particular, the information retrieved might help resolve the controversy on the CDW mechanism for 1T-TiSe2.
We studied 1T-CuxTiSe2 with high resolution angle resolved photoemission spectroscopy (ARPES). A correlated semiconductor band structure of the undoped system is evidently illustrated, resolving a long-standing controversy. Cu doping is found to effectively enhance the density of states around the Fermi energy (), which explains the enhancement of superconductivity. On the other hand, severe inelastic scattering was observed near the solubility limit, corresponding to the drop of superconducting transition temperature in that regime. With increased doping, chemical potential is raised, and signs of the weakening electron-hole coupling is discovered, which is responsible for the suppression of the CDW. Our results indicate that the seeming ”competition” between CDW and superconductivity in the phase diagram is a coincidence caused by different effects of doping in this 1T compound, in contrast to the 2H-TMD caseShenNaTaS .
1T-CuxTiSe2 single crystals were prepared by the vapor-transport technique, with doping and (accurate within )WuGang . The copper concentrations were determined by inductively coupled plasma spectrometer chemical analysis and confirmed by -lattice parameter calibrationcavaNP . The superconducting phase transition temperatures, ’s, for and 0.065 are 2.5 and 3.4 K respectively, similar to what was reported beforecavaNP . Superconductivity is not observed down to 2K for . Judging from the reported phase diagram, the CDW phase transition temperature ’s are about 220K, 190K, 170K and 70K for and respectively, and doping is just merely outside the CDW regime. ARPES experiments were performed with Scienta R4000 electron analyzers and photons from a Helium gas discharge lamp and synchrotron radiation at beam line 9 of HiSOR. The angular resolution is and the energy resolution is 10 meV. The samples were cleaved/measured in ultra-high vacuum ().
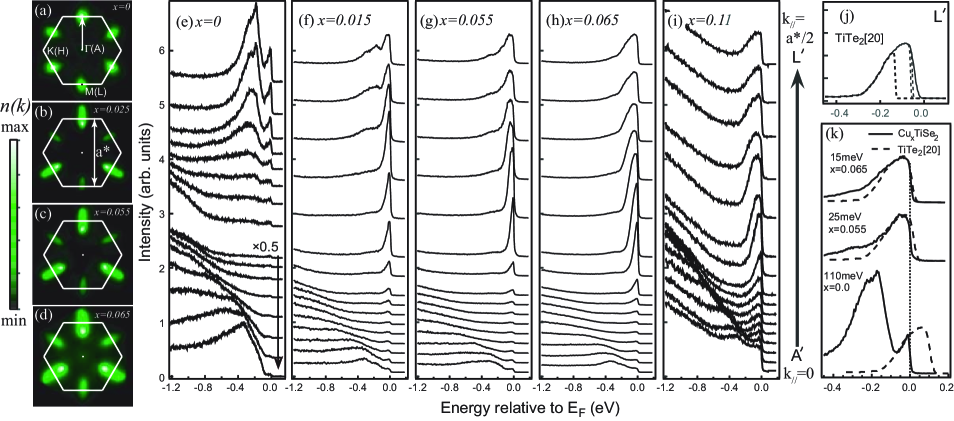
Survey of the electronic structure was conducted with 21.2eV photons from a Helium lamp. The photoemission intensity distributions near are projected onto the -K-M or A-H-L plane for and in Fig. 1(a-d) respectively. The perpendicular momentum of electrons is close to that of L (thus denoted by L′), where being the reciprocal lattice vector shown in Fig.1bAebi01 ; kzeffects . Strong spectral weight is located around L′, forming the so called Fermi patches as observed in cuprate superconductors and some 2H-TMD compoundsShenNaTaS . The Fermi patches expand with increased Cu doping, consistent with the rising carrier density, and the susceptibility datacavaNP . Symmetry of the triagonal lattice is manifested in the alternating strong and weak L′ regions. As they show similar behaviors, we will focus on the data around the strong region hereafter.
Photoemission spectra taken at low temperatures along the cut sketched in Fig.1a are shown in Fig. 1e-i for systems ranging from the undoped to the Cu solubility limit. The spectra exhibit remarkable doping dependence. The flat-band feature at around L′ corresponds to the narrow Ti band, which dominates the density of states near . The highly dispersive features near are spin-orbit-split Se bandsKidd02 ; Aebi01 , which are folded to the L region (Fig. 1e-g) as will be discussed below. The Ti band clearly extends from around the L′ region towards with increased doping, causing significant increase of the density of states around . Recent thermal conductivity data from 1T-Cu0.06TiSe2 indicate that it is a single band -wave superconductorLee . Therefore, if the superconductivity here is of BCS kind as in the 2H-TMD compoundsshinScience ; Valla2004 , increased Cu doping would certainly enhance it. However, when the Ti band eventually reaches at (Fig. 1i), the spectral background at high binding energies is also severely enhanced, which has been confirmed in different batches of samples. We note that the residual resistivity ratio of sample is similar to the othersWuGang . Therefore, it suggests that high Cu concentrations would induce disorder effects such as enhanced inelastic scattering, which might be responsible for the suppression of superconductivity in this regime cavaNP . On the other hand, backward scattering that would enhance the residual resistivity seems not to be affected to the same extent. To fully understand these effects, local measurements, such as scanning tunnelling microscopy, may be necessary to provide a more direct picture.
The spectral linewidth of the Ti band shows an intriguing increase with doping at the same momentum, while the mid-point of the spectral leading edge is about 34 meV above . In a conventional band structure sense, this would indicate the “quasiparticle” band has not crossed up to the highest Cu doping. The observed sharp feature at low doping is just a Fermi-Dirac cut-off of a broad feature above . Therefore, it grows broader with increasing doping, and eventually the peaks become rounded or even flat(Fig. 1h-i). This remarkably resembles the lineshape of TiTe2 spectrum taken under the same conditionTiTe2 , as reproduced in Fig. 1j. TiTe2 is a metal, whose Ti--band feature at L′ is just below . In fact, if one would shift the chemical potential down by 15 meV, 25 meV, and 110 meV (with an uncertainty of about meV) (Fig. 1j), or equivalently shift the TiTe2 spectra up (Fig. 1k), the 1T-CuxTiSe2 ( and respectively) spectra would be fitted surprisingly well. The differences at higher energies between the shifted spectra and the data are attributed to the folded Se bands due to the CDW, as will be discussed below. TiTe2 was considered to be a prototypical Fermi liquid system before. With much improved resolution nowadays, the many-body nature of TiTe2 and 1T-CuxTiSe2 is exposed by the broad and non-Lorentzian lineshape, and its unconventional doping dependence. In particular, our fitting shows that the sharp Ti feature at L′ for is just a partially occupied spectral function, whose center-of-mass is actually above the Fermi energy, whereas most of the spectrum is recovered for , since it differs very little from the 1T-Cu0.11TiSe2 or TiTe2 spectrum.
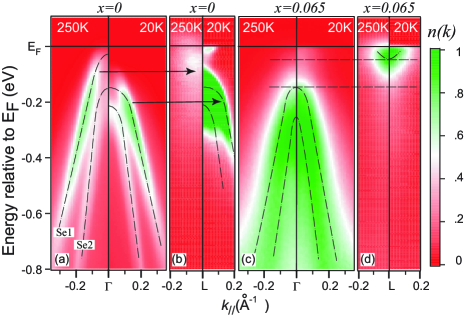
The anomalous evolution of the Ti state lineshape requires reexamination of the band structure. Photoemission intensity along the -M, and L-A directions were measured with 12.85 eV and 18.5 eV photons respectivelyKidd02 (Fig.2). Data at both low and high temperatures were compared. For 1T-TiSe2, at 250K (above the CDW transition), the top of the valence band is located slightly below the Fermi energy (Fig.2a), while the Ti band feature is quite weak and broad around (Fig.2b). At 20K, a large gap opens near region, and the Se bands are strongly folded to L region due to the formation of CDW.Kidd02 . The CDW fluctuations are strong even in the normal state, which induces band folding and possible small gap at . Since thermal broadening above the CDW transition temperature further adds to the complication, whether the Se1 band and the Ti band overlap or not could not be definitely resolved, resulting in a controversial situationAebi01 ; Kidd02 . Fortunately, 1T-Cu0.065TiSe2 provides an excellent opportunity to resolve this controversy. As shown in Fig.2c-d, the band position hardly moves at all with temperature in this compound as it is already out of the CDW phase. CDW fluctuations still exist, but only causes quite weak band folding. Therefore, the original band structure without much complication from the CDW and thermal broadening effects is revealed. Furthermore, as chemical potential shifts up with electron doping, the Ti feature at L is almost fully recovered (Fig.2d). There is a clear gap as large as 110 meV between the Se1 and Ti bands, whose position is defined by the centroid of the spectra. The undoped system is thus undoubtedly a semiconductor under this conventional definition. On the other hand, we emphasize that it is a correlated semiconductor, and the broad “tails” of those two bands could overlap in-between the two dashed lines in Fig.2c-d. In the undoped case, these tails induces holes near , and electrons near L, giving the system a weak semi-metallic nature in the many-body sense.
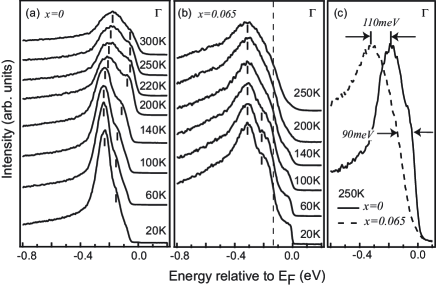
Finer temperature evolution of the spectrum at is shown in Fig.3. For 1T-TiSe2, a large gap opens at the Se 4p bands when the system enters deeply into the CDW states (Figs.3a), which causes a shift of about 110 meV and 50 meV for the Se1 and Se2 band respectively. This helps lowering the energy of the CDW state. For , such a shift is absent(Fig.3b), and there is only temperature broadening of the step-like feature at EF, which comes from the extension of the Ti 3d bands as illustrated in Fig.1h, plus possibly some weak folding (Fig.2c). Because the 1T-TiSe2 spectrum varies very little at high temperatures, one can estimate a chemical potential shift of about 100 meV with 6.5% Cu doping both from the leading edge and the peak position (Fig.3c). This is consistent with the simulation in Fig.1k.
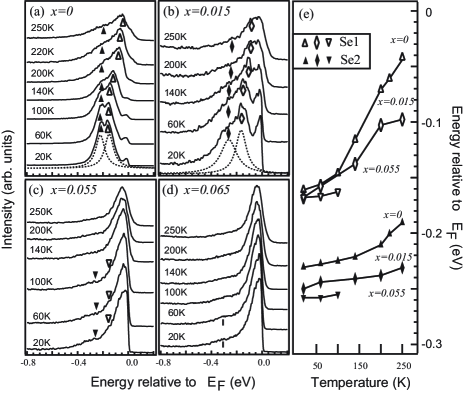
The folded Se bands at L weaken significantly with increased doping or temperature, in correlation with the CDW strength (Fig.4). CDW fluctuations are quite robust in the normal state. For , the spectrum at 250K still contains significant contribution from the folding (Fig. 4a). Similarly in Fig. 4b-d, there also exists a small amount of residual folded weight well above . Moreover, with increased temperature, the folded features shift toward . For example, a shift of more than 110 meV for the folded Se1 ban is observed in Fig. 4a for TiSe2. The positions of the folded Se1 and Se2 bands are summarized in Fig.4e. One finds that the shift of the Se1 band is much larger than that of Se2 band in the studied temperature range. With increased doping, the maximal shift of the Se1 band drops faster than that of the Se2, and eventually they both diminish with the CDW. The correlation between the shift and CDW cannot be understood within the band Jahn-Teller picture, since the Jahn-Teller distortion would have gained more electronic energy through the filled Ti 3d band. On the other hand, if the shift of the Se bands are caused by the coupling between the electrons in the Se bands and holes in the Ti band (i.e. the excitonic effects), the decreasing shift of the Se bands with doping can be naturally explained by the weakening electron-hole interaction due to the raise of chemical potential. As the energy of the CDW state lowers through these shifts, the CDW strength would decrease with the weakening electron-hole interaction. Consistently, the indirect Jahn-Teller scenario proposed for the undoped system beforeKidd02 , which includes electron-hole interactions, conduction band degeneracy, and the spin-orbit splitting of the valence bands, is also able to explain the above doping behavior. In this scenario, the degenerate conduction bands split and push down the valence band in the CDW state and thus gain energyKidd02 . Since Se1 band is closer to the conduction band, the hybridization will push it harder than the Se2 band(Fig.4e).
Alternatively, the drop of CDW can be understood in the general excitonic picture proposed by KohnKohn67 , where an indirect-gap semiconductor is unstable against the formation of excitons between valence electrons and holes in the conduction band, if the exciton binding energy is higher than the energy difference between the electron and hole (i.e. band gap for a semiconductor). For 1T-CuxTiSe2, the measured chemical potential shift of 100 meV for makes the centroid of the valence band sufficiently below and the exciton/CDW formation costly enough. Therefore, the disappearance of CDW at high doping is expected. Compared with the exciton energy of 17 meV estimated earlierAebi2 , this large shift is necessary because there is strong interactions in the system (most likely strong electron phonon interactionschiangphonon ), and the large linewidth would reduce the distance between the highest valence state and significantly.
Compared with other 1T-TMD compounds, the CDW in 1T-CuxTiSe2 does not cause an energy gap for the Ti band, which makes the large density of states at . Therefore, there is plenty of spectral weight available for superconductivity. This is perhaps why superconductivity in 1T-TMD’s is first discovered here, when large spectral weight near is induced by Cu doping. Moreover, our results suggest that the seeming competition between CDW and superconductivity in this system is very likely a coincidence, as the doping will increase the density of states and raise the chemical potential simultaneously.
To summarize, 1T-CuxTiSe2 is proved to be a correlated semiconductor at zero doping, and the doping behavior of the CDW in this material can be well understood if electron-hole coupling is taken into account. Cu doping enhances the density of states and thus favors the superconductivity, while it also raises the chemical potential and weakens the charge density wave.
We gratefully acknowledge the helpful discussion with Prof. Z. Y. Weng and Prof. D. H. Lee. This work was supported by NSFC, MOST (973 project No.2006CB601002 and No.2006CB921300), and STCSM of China.
References
- (1) J. A. Wilson, F. J. Di Salvo and S. Mahajan, Adv. Phys. 24, 117 (1975).
- (2) Th. Pillo et al, Phys. Rev. Lett. (83),3494 (1999).
- (3) D. W. Shen et al., Arxiv:cond-mat/0612064.
- (4) P. Aebi et al.,Phys. Rev. B61,16213 (2000), and reference therein.
- (5) T. Valla et al., Phys. Rev. Lett. 92, 086401 (2004).
- (6) A. H. Castro Neto, Phys. Rev. Lett. 86, 4382 (2001).
- (7) T. Yokoya et al., Science 294, 2518 (2001).
- (8) E. Morosan et al., Nature Physics 2, 544 (2006).
- (9) H. P. Hughes, J. Phys. C 10, L319 (1977).
- (10) J. Rossnagel, L. Kipp and M. Skibowski Phys. Rev. B65, 235101 (2002).
- (11) W. Kohn, Phys. Rev. Lett. 19, 439 (1967).
- (12) J. A. Wilson and A. D. Yoffe, Adv. Phys. 18, 193 (1969).
- (13) T. E. Kidd, T. Miller, M. Y. Chou, and T.-C. Chiang, Phys. Rev. Lett. 88, 226402 (2002), and references therein.
- (14) P. Aebi, Th. Pillo, H. Berger, and F. Lévy J. Electron Spectrosc. Relat. Phenom. 117-118, 433 (2001).
- (15) X. Y. Cui et al, Phys. Rev. B 73, 085111 (2006).
- (16) F. J. Di Salvo and J. V. Waszczak, Phys. Rev. B 17, 3801 (1978).
- (17) F. Levy, J. Phys. C: Solid St. Phys., 13, 2901 (1980).
- (18) N. V. Baranov et al, J. Phys.: Condens. Matter 19, 016005 (2007).
- (19) E. Dagotto, Science 309, 257 (2005).
- (20) G. Wu et al., Arxiv:cond-mat/0703645.
- (21) R. Claessen et al. Phys. Rev. B54, 2453 (1996).
- (22) With Cu intercalation, only increases by 5% at the maximum concentration. Our synchrotron experiments show that the photon energy corresponding to particular momentum varies negligibly with dopings.
- (23) S. Y. Li, L. Taillefer, G. Wu, and X. H. Chen, Arxiv:cond-mat/0701669.
- (24) M. Holt, P. Zschack, H. Hong, M. Y. Chou, and T.-C. Chiang, Phys. Rev. Lett. 86, 3799 (2001).