Wide-band detection of the third moment of shot noise by a hysteretic Josephson junction
Abstract
We use a hysteretic Josephson junction as an on-chip detector of the third moment of shot noise of a tunnel junction. The detectable bandwidth is determined by the plasma frequency of the detector, which is about 50 GHz in the present experiment. The third moment of shot noise results in a measurable change of the switching rate when reversing polarity of the current through the noise source. We analyze the observed asymmetry assuming adiabatic response of the detector.
pacs:
72.70.+m,73.23.-b,05.40.-aStudies of shot noise in mesoscopic conductors are presently of great interest, revealing detailed information on microscopic mechanisms of electronic transport blanter00 ; nazarov03 ; glattli04 . The theory of full counting statistics (FCS) of electrons levitov96 determines the probability distribution of current fluctuations and its n order moments. Experimentally, however, measurements of higher moments beyond the variance remain difficult especially in the interesting high frequency regime, mainly because of weak signals and demanding filtering requirements. The first experiments on the third moment of shot noise of a tunnel junction were performed on samples connected remotely to the detector reulet03 ; bomze05 . Yet the most natural way to investigate noise in nano-structures would seem to be via an on-chip detector. In recent measurements of Gustavsson et al. gustavsson06 and of Fujisawa et al. fujisawa06 , single electrons tunneling through quantum dots could be counted directly. The noise correlations were observed up to the third order over a bandwidth of a few tens of kHz. The latest remarkable results on observation of the fourth and the fifth moments of current through a quantum dot gustavsson0607 demonstrated on-chip detection of FCS in the low frequency regime. As regards to high-frequency on-chip detectors of non-Gaussian noise, a Josephson junction (JJ) appears to be a very attractive one according to various theoretical predictions JJdet ; ankerhold06 ; peltonen06 ; sukhorukov06 . On the experimental side, the influence of non-Gaussian noise on the conductance of a Coulomb blockaded JJ has been measured in lindell04 .
In this Letter we present an experimental observation and a theoretical interpretation of the influence of wide-band third order fluctuations on escape of a hysteretic JJ threshold detector from its zero voltage state.
Our analysis of the experiment is based on the following model. Let us assume for a moment that the Josephson potential of the detector is strictly harmonic with oscillation (plasma) frequency , where and are the critical current and capacitance of the junction at bias current , respectively. Then, on the level of the second moment, noise affects the escape of a JJ predominantly by promoting resonant activation at such that shot noise induced transitions between adjacent energy levels and in the potential are given by (excitation) and (relaxation), where is the spectral density of noise at (angular) frequency . These rates lead to dynamics in the potential with effective temperature jp05
| (1) |
Here we have assumed that the bath temperature is , i.e., the detector is in macroscopic quantum tunneling (MQT) regime in the absence of shot noise, and that the voltage across the scatterer is large enough such that we are in pure shot noise regime: . In Eq. (1) is the quality factor of the junction at plasma frequency, and is the average value of the noise current through the scatterer junction with Fano factor fano . Unlike in the earlier experiments by some of us jp05 , in the present measurements we can determine independently by detecting the crossover from escape dynamics to under-damped phase diffusion (UPD) UPD as described in the experimental part below. This leaves no free parameters to determine the consistency between the measured escape rate
| (2) |
and given by independent measurements of the parameters in Eq. (1). In (2) is the barrier height of the potential well with Josephson energy .
The linear coupling to current fluctuations in the Josephson potential is of the form , where is the phase operator. It is proportional to the sum of the creation and annihilation operators of the harmonic oscillator, and therefore, in contrast to the influence of the second moment, the third order fluctuations do not induce transitions between adjacent levels in a harmonic well heikkila06 ; peltonen06 . Therefore, up to the third order, the influence of resonant activation in a harmonic potential is exclusively that due to the second order fluctuations. There are weak corrections to the results above, if we allow the potential to be anharmonic. Yet in the case of the third order fluctuations such corrections vanish unless the third order spectral densities are assumed to have frequency dependence heikkila06 ; peltonen06 . Therefore we assume in what follows that the third order effects come from non-resonant fluctuations only, at sub-plasma frequencies. Throughout we ignore the effects related to higher than third order fluctuations. Under these conditions, in analogy to adiabatic Gaussian noise martinis88 , the contribution of the third moment to the escape rate from the well is determined by the instantaneous value of the fluctuating bias current. The asymmetry between escape rates , averaged over the adiabatic fluctuations, at different polarities of either pulse or noise currents can then be written as peltonen06 . Here is the exponent in the expression of the tunneling rate and is the third moment of current fluctuations at the detector. For thermal activation of Eq. (2), with , one then obtains
| (3) |
Here, , where is the bandwidth of adiabatic fluctuations, and is the low frequency limit of the third order spectral density with Fano factor .
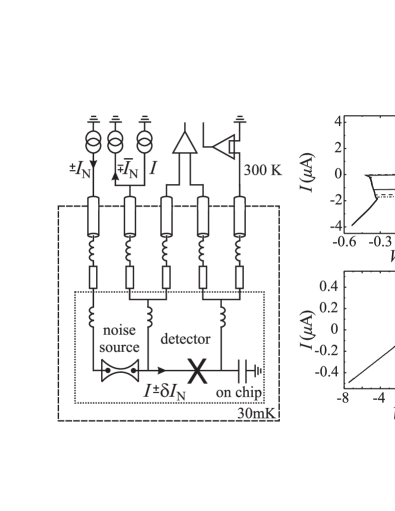
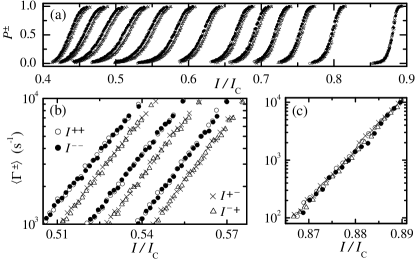
The measurement scheme is shown in Fig. 1. The detector is an Al/AlOx/Al JJ with an area of m2 and it stays initially in a superconducting state. Another tunnel junction, the noise source, is biased with a current , such that it is driven far from equilibrium into the shot noise regime. All samples were fabricated by electron beam lithography and shadow evaporation and they were measured via filtered signal lines at a bath temperature of mK. In order to detect only the fluctuations of , the balancing current of opposite polarity is applied such that no DC-component due to passes through the detector. Owing to the small magnitude of the third order fluctuations, careful DC-balancing is extremely important. The residual non-balanced current across the detector is measured repeatedly by a low input impedance current amplifier. However, the resulting correction never exceeded 1 nA during the measurements. The on-chip inductors in Fig. 1 are long (few mm) and narrow (2 m) superconducting lines. In all the samples, the detector was connected to a large contact pad on the chip (few mm2 in area), which served as a capacitive short to ground at high frequencies. To probe the fluctuations of , we applied trapezoidal current pulses of height through the detector with 100 s - 1 ms duration, and with a 1 ms delay between two pulses. Typically pulses at each value of were repeated, and the escape probability was obtained as the fraction of pulses leading to an escape from the supercurrent state. When increasing the average value of , shot noise enhances the escape rate, leading to suppression of the escape threshold current jp05 . To extract information about the third moment, we applied four different combinations of current polarities, which we call , , , and , where the superscripts refer to the signs of and , respectively. The first two combinations should lead to identical escape characteristics, which should differ, in the presence of odd moments, from the last two identical combinations. We normally measure the separation of the histograms, , corresponding to equal escape probability in the two pulse/noise current directions. By a simple geometric argument, assuming linear dependence between escape probability and current over a short interval (weak third order effects), we obtain
| (4) |
| Sample | detector | noise junction | |||
| (A) | (fF) | (GHz) | (k) | (fF) | |
| NIS | 2.88 | 80 | 53 | 15.4 | 8 |
| SIS | 2.51 | 80 | 49 | 1.9 | 6 |
| REF | 2.36 | 75 | 49 | 0 | - |
We present data of three samples, see Table I. Sample NIS had a normal metal-insulator-superconductor Cu/AlOx/Al noise source. In Sample SIS the noise source was another Al/AlOx/Al JJ, but with a much smaller critical current than in the detector. In the reference sample, Sample REF, the noise source was replaced by a superconducting line. In Table I denotes the normal state resistance of the noise junction, and is taken at .
Here we describe data of Sample NIS unless otherwise specified. Figure 1 shows current-voltage characteristics of the detector and the noise source junction. The detector s have been measured at different values of noise current. Besides the standard hysteretic character and suppression of switching threshold upon increasing , there are two important features to observe here. (i) The s are vertical in the supercurrent branch, such that V up to the switching current. This means that the rate of phase diffusion events from one well to another is MHz. (ii) The gap voltage is the same at all values of noise current up to 5 A; this is higher than all those currents used for further analysis of data. Thus there is no excess overheating of the bath and the only relevant temperature is then . Figure 2 shows escape characteristics with rates that are related to the measured escape probabilities via . Here the current pulses were s long. The measurements were performed at various values of using the four polarity configurations. Suppression of the mean bias current and change in the width with increasing is evident from the histograms in Fig 2 (a). Moreover, as to the different polarity configurations, the and data indeed lie together for the same magnitude of , and the suppression of switching threshold for this pair is higher than for and . The latter two are again grouped together, as depicted in Fig. 2 (b). This shift is the manifestation of the skewness of the current distribution, where the sign of the third moment is positive. The values of and of the detector in Table I are obtained from fits to MQT escape weiss ; Fig. 2 (c) shows the rates. The obtained value of agrees with the Ambegaokar-Baratoff prediction ambegaokar62 , and with that based on the size of the junction.

In Fig. 3 we have analyzed the escape histograms of Fig. 2 based on Eq. (2) to extract effective temperature at various levels of . We obtain in (a) a set of values of , spread within about 2% around the mean, for each at different values of bias current along a histogram. For clarity, we show data of one pulse configuration () only, because the third order effects are weak: the variation in between different configurations is only about 1% at maximum. Figure 3 (b) shows the measured width, defined as between and of the same escape histograms. We see an increase up to about A, in fair agreement with the thermal activation model (dashed line). Above this value of the width starts to decrease. We attribute the maximum to the crossover from escape dynamics to UPD UPD , now induced by the increase of effective temperature and subsequent decrease of the switching threshold current. From the value of for the switching threshold at this noise current, we obtain the quality factor . (Similar procedure gave also for Sample SIS.) Based on this value of and the values of and from independent measurements, we are then able to draw the theoretical line based on Eq. (1) in Fig. 3 (a).
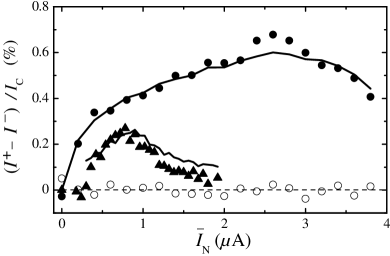
Figure 4 shows the influence of the odd moments on escape threshold of all the three samples. The quantity has been extracted as , all taken at . We see that the signal due to the third moment, plotted against again, of Sample NIS (filled dots) has a maximum value of about 0.6% of . This is to be contrasted to the essentially vanishing signal of the reference sample (open circles). The solid line following closely the data of Sample NIS is the result of the theoretical model according to Eqs. (3) and (4). The non-trivial parameters needed to construct this curve, and , have been extracted from experiment. Note that values of and are not needed here since we measure directly. In addition, we have set , the value for Poissonian noise of a tunnel junction, and , which is a very natural choice for our model including adiabatic frequencies only. We also show similar data of Sample SIS (triangles). Here, the bandwidth was taken to be for the theory line. It may seem surprising at the first view that the results follow the theoretical prediction also in the regime where the detector is in the UPD regime ( A for Sample NIS). Yet this is quite natural, because the frequency of the phase diffusion events is MHz, whereas the relevant bandwidth of noise affecting the phase particle extends up to GHz. Therefore it suffices to study escape from one well only.
We have observed the third moment of shot noise up to frequencies of GHz, and interpreted this observation by assuming that the third order effects manifest themselves in our JJ system as an average thermal escape rate in a potential which varies according to adiabatically fluctuating bias currents. A similar problem has been analyzed theoretically in ankerhold06 using an effective Fokker-Planck method and very recently in sukhorukov06 by generalized stochastic path integral methods. The results of our model coincide with ankerhold06 up to numerical prefactor of the order of unity in the limit of large , and with sukhorukov06 excluding the circuit corrections that are weak in our case. Finally, although the data presented here can be interpreted quantitatively, it remains a challenge to engineer the radio-frequency environment on the chip to the degree that no uncertainty in the relevant bandwidth would remain. However, it is already possible to envision experiments where different mesoscopic noise sources use a common JJ detector of third order fluctuations, and where a tunnel junction serves as a reference scatterer.
We thank J. Ankerhold, H. Grabert, T. Ojanen, H. Pothier and E. Sukhorukov for useful discussions and Academy of Finland for financial support. A.V.T. thanks Finnish Academy of Science and Letters for a scholarship.
References
- (1) Y.M. Blanter and M. Büttiker, Phys. Rep. 336, 1 (2000).
- (2) Quantum Noise in Mesoscopic Physics, edited by Yu.V Nazarov (Kluwer, Dordrecht, 2003).
- (3) Quantum Information and Decoherence in Nanosystems, edited by D. C. Glattli, M. Sanquer, and J. Tran Thanh Van. (Proc. XXXIX Recontres de Moriond, La Thuile, Italy, 2004.)
- (4) L.S. Levitov, H.W. Lee, and G.B. Lesovik, J. Math. Phys. 37, 4845 (1996).
- (5) B. Reulet, J. Senzier, and D.E. Prober, Phys. Rev. Lett. 91, 196601 (2003); B. Reulet et al., in Ref. nazarov03 .
- (6) Yu. Bomze et al., Phys. Rev. Lett. 95, 176601 (2005).
- (7) S. Gustavsson et al., Phys. Rev. Lett. 96, 076605 (2006).
- (8) T. Fujisawa, T. Hayashi, R. Tomita, Y. Hirayama, Science 312, 1634 (2006).
- (9) S. Gustavsson et al., cond-mat/0607192.
- (10) J. Tobiska and Yu.V. Nazarov, Phys. Rev. Lett. 93, 106801 (2004); J.P. Pekola, ibid. 93, 206601 (2004); T.T. Heikkilä, P. Virtanen, G. Johansson, and F.K. Wilhelm, ibid. 93, 247005 (2004); E.B. Sonin, Phys. Rev. B 70, 140506(R) (2004); J. Ankerhold and H. Grabert, Phys. Rev. Lett. 95, 186601 (2005).
- (11) J. Ankerhold, cond-mat/0607020 (2006).
- (12) J.T. Peltonen, A.V. Timofeev, M. Meschke, and J.P. Pekola, cond-mat/0611593, J. Low Temp. Phys., to be published (2006).
- (13) E.V. Sukhorukov and A.N. Jordan, cond-mat/0611783.
- (14) R.K. Lindell et al., Phys. Rev. Lett. 93, 197002 (2004).
- (15) J.P. Pekola et. al., Phys. Rev. Lett. 95, 197004 (2005).
- (16) This factor is ideally the Fano factor of the noise source blanter00 , but it does include the frequency dependence of the surrounding circuit also. In the present experiment the circuit was designed in such a way that its influence on is supposedly weak.
- (17) J.M. Kivioja et al., Phys. Rev. Lett. 94, 247002 (2005); V.M. Krasnov et al., ibid. 95, 157002 (2005); J. Männik et al., Phys. Rev. B 71, 220509(R) (2005).
- (18) T.T. Heikkilä and T. Ojanen, cond-mat/0609133.
- (19) J.M. Martinis and H. Grabert, Phys. Rev. B 38, 2371 (1988).
- (20) U. Weiss, Quantum Dissipative Systems, 2nd edition (World Scientific, Singapore, 1999).
- (21) V. Ambegaokar and A. Baratoff, Phys. Rev. Lett. 10, 000486 (1963).