Distinct Fermi-Momentum Dependent Energy Gaps in Deeply Underdoped Bi2212
We use angle-resolved photoemission spectroscopy applied to deeply underdoped cuprate superconductors Bi2Sr2(Ca,Y)Cu2O8 (Bi2212) to reveal the presence of two distinct energy gaps exhibiting different doping dependence. One gap, associated with the antinodal region where no coherent peak is observed, increases with underdoping - a behavior known for more than a decade and considered as the general gap behavior in the underdoped regime. The other gap, associated with the near nodal regime where a coherent peak in the spectrum can be observed, does not increase with less doping - a behavior not observed in the single particle spectra before. We propose a two-gap scenario in momentum space that is consistent with other experiments and may contain important information on the mechanism of high- superconductivity.
The pseudogap phase of underdoped cuprates has proven to be an important region for discoveries and surprises in the field of high-transition temperature () superconductors (?). Early angle-resolved photoemission (ARPES) (?) and electron tunneling experiments from lightly underdoped samples (?) suggested that the pseudogap has similar characteristics to the superconducting gap below , consistent with the idea that the pseudogap is a precursor to the superconducting state but lacks pair phase coherence. In this scenario, below where the phase coherence of pairs is established, the pseudogap smoothly evolves into the superconducting gap. There is only one energy scale in the system and is associated with the magnitude of the gap at the antinode. This antinodal gap was found via ARPES (?), thermal conductivity (?), and tunneling measurements (?) to increase as the doping was reduced from optimum. However, the energy gap obtained by Andreev reflection (?), penetration depth (?), and recent Ramman experiments (?, ?) of cuprates exhibits the opposite trend with doping suggesting a rather different scenario from the one-gap picture.
We present ARPES data for deeply underdoped Bi2Sr2(Ca,Y)Cu2O8 (Bi2212) crystals with values of 50 K, 40 K, and 30 K, finding evidence for the existence of two distinct energy gaps in the single-particle spectral function ( See “Supporting Online Materials” for details about materials and the ARPES measurements setup). One gap manifests itself as a spectral weight suppression near the Brillouin zone boundary (antinodal region); this antinodal gap becomes larger with decreased doping, consistent with previous ARPES studies (?). The other gap is resolved near the diagonal of the zone (nodal region) where a quasi-particle peak can be observed. We find that the gap size of this near nodal gap determined by empirical methods does not increase by decreasing doping level. We attribute our result as evidence for two distinct Fermi momentum dependent energy gaps, with the gap near the nodal region corresponding to the superconducting gap and the gap near the antinodal region to the pseudogap state.
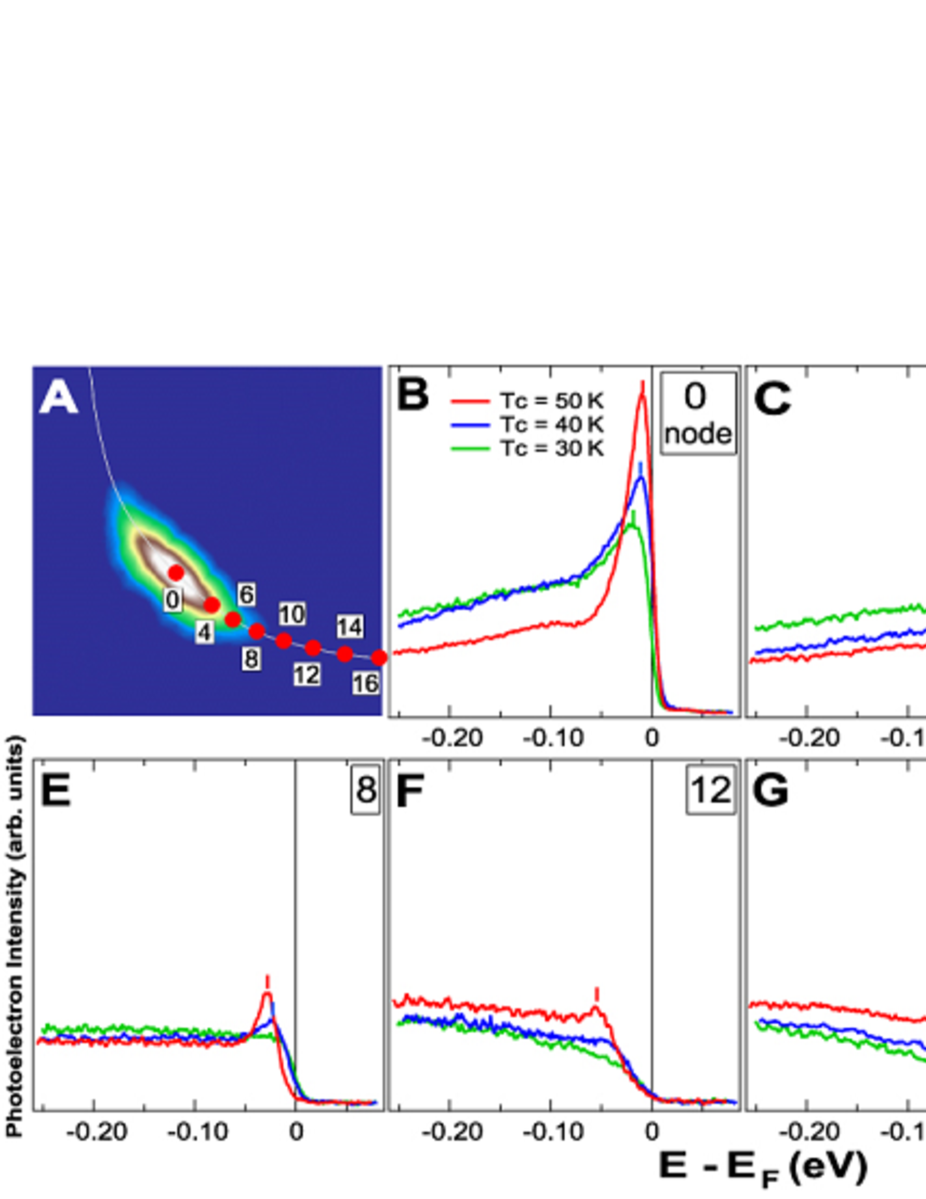
In Fig. 1, we show energy distribution curves (EDCs) along the Fermi surface (FS) for the K, 40 K, and 30 K samples. Compared to previous ARPES studies on underdoped Bi2212 with a similar doping level (?), our new data have a much improved quality; even for the most underdoped sample ( K), a clear quasi-particle (or coherence) peak can still be observed near the nodal region (Fig. 1B), which has not been seen previously in Bi2212 for such a low doping. This improvement makes possible a more quantitative data analysis. We first note that the lineshape of the spectra shows a marked change along the FS. The sharp coherence peak gradually loses spectral weight when moving from the nodal region toward the antinodal region. In the antinodal region, the peak disappears and only a broad hump in the spectrum located far away from the Fermi level () can be observed for the K and 40 K samples. This behavior is consistent with previous studies of other underdoped cuprates such as La2-xSrxCuO4 (LSCO) and Ca2-xNaxCuO2Cl2 (Na-CCOC) (?, ?). Here, we operationally define the Fermi arc as the region where one can see a peak in the superconducting state EDCs. Clearly, as demonstrated in Figs. 1B-G and the inset of Fig. 1H, the length of the Fermi arc decreases as the doping level of the samples decreases.
In Fig. 1H, we plot the leading-edge gap, defined as the energy difference between the mid-point of the spectral leading edge and that of the nodal spectrum within the Fermi arc region. We find that the leading-edge gap is smaller for the lower samples suggesting that the energy gap associated with this Fermi arc region decreases with decreased doping. This doping dependence can be directly observed in the raw spectrum. The EDCs in the intermediate region (Fig. 1E) show that both the coherence peak position and the leading-edge gap of the K sample is larger than the K and 30 K samples. Similar observation can also be deduced from Fig. 1, C and D, which are all still within the Fermi arc region. This gap-reduction trend within the Fermi arc region is opposite to the doping dependence of the energy gap in the antinodal region reported in previous ARPES studies (?), and is in conflict with the doping dependence of the energy gap inferred from thermal conductivity (?) and tunneling measurements (?).
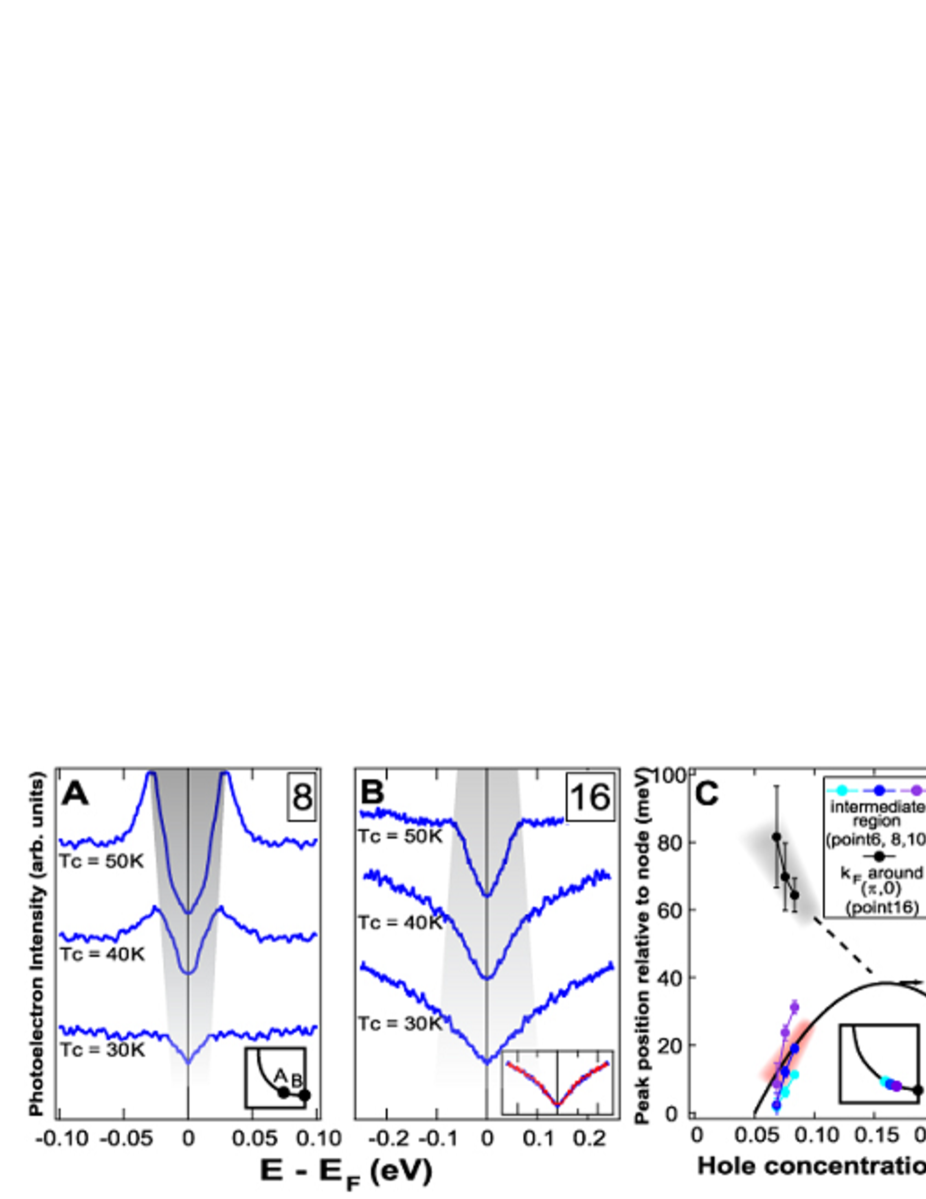
In the antinodal region, the spectrum is characterized by a suppression of the spectral weight over a region which one associates with a pseudogap. To illustrate the difference in the doping dependence of the pseudogap and the energy gap associated with the Fermi arc, we have plot symmetrized EDCs (?) for the three samples for an intermediate Fermi arc k-point (point 8), and an antinodal k-point (point 16) (Fig. 2A, B). As indicated by the shaded areas, it is clear that the EDCs of point 16 show a larger gap with more underdoping while the EDCs of point 8 exhibit the opposite trend with doping. The inset in Fig. 2B shows that there is essentially no change in the EDC of the K sample between the superconducting ( K, blue line) and the normal state ( K, red line) in the antinodal region. It also suggests that the broadening of the peak with temperature does not shift the leading-edge position downwards in these deeply underdoped samples. For a more comprehensive view of the trend, the peak positions of EDCs relative to the node at various locations near the intermediate region (point 6, 8, and 10) and the antinodal region (point 16) are plotted (Fig. 2C). Clearly, the doping dependence of the energy gap along the Fermi arc and the antinodal region are different. This behavior suggests that the energy gaps associated with the Fermi arc region and antinodal region represent two distinct energy gaps arising from different mechanisms. The antinodal gap appears to be related to the pseudogap and not related to superconductivity; whereas, the nodal gap more likely represents the “real” superconducting gap because of the existence of a coherence peak in the spectrum. The distinction between the two gaps becomes smaller and harder to observe towards optimum doping (?, ?, ?, ?). While an earlier experiment near optimal doping has seen this same trend, the result was attributed to an anharmonic term in the -wave gap (?). Uncovering the distinct spectral lineshape in these deeply underdoped samples makes it possible to attribute to distinct energy gaps.
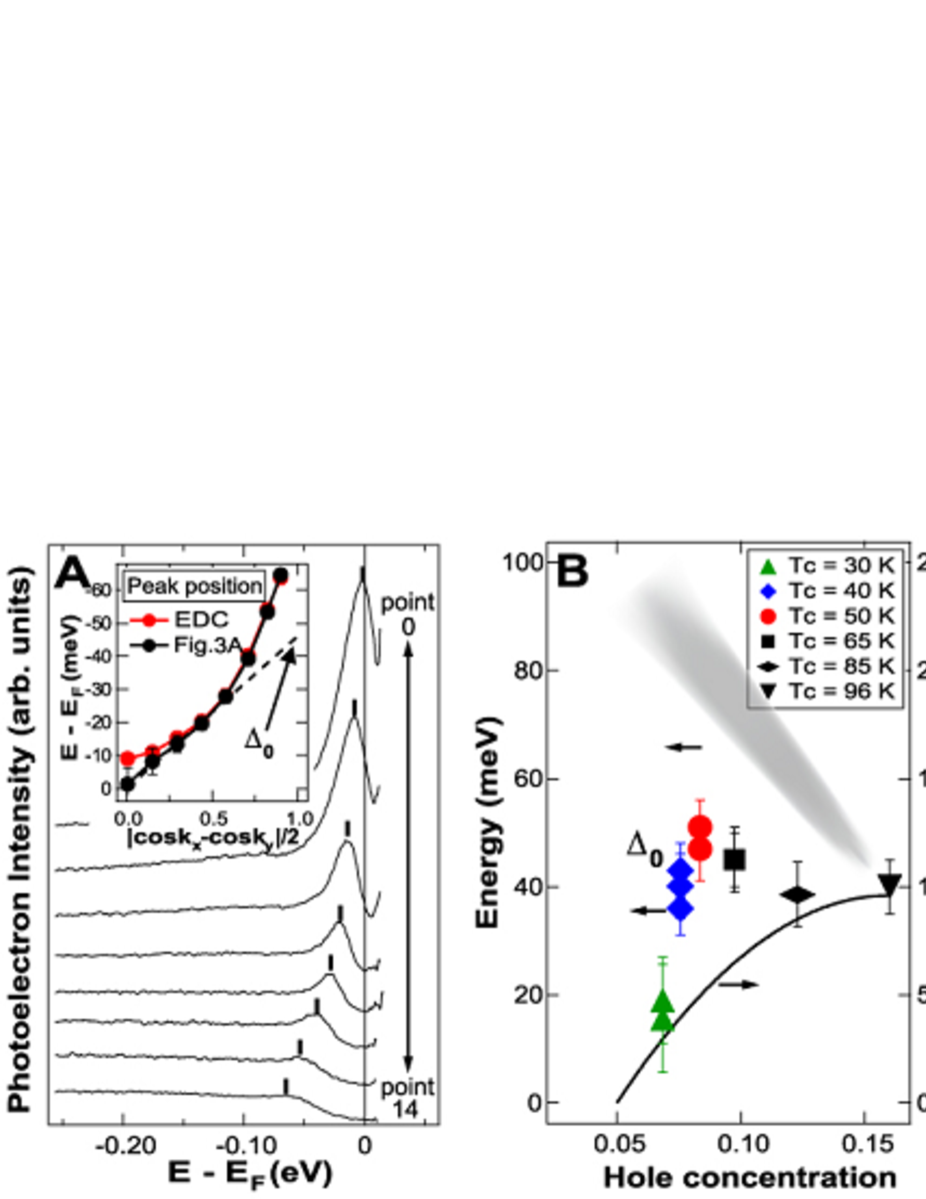
As the energy gap in the antinodal region is primarily dominated by the pseudogap, it is not straightforward to estimate the magnitude of the maximum superconducting gap . Here, we exploit a phenomenological method to estimate . The EDCs along the Fermi arc are first divided by the Fermi-Dirac (FD) function at the measurement temperature convoluted with the experimental resolution (Fig. 3A). In this way, one can track the peak position of the single-particle spectral function without the complications of FD cut-off near . We then plot the peak position of these spectra with respect to the function (), as illustrated in the inset of Fig. 3A. It can be seen that the peak positions of these FD-function divided spectra lay on a straight line for values in the nodal region, suggesting that the superconducting gap around the nodal region is consistent with this form. We then estimate by extrapolating this straight line to the boundary where , as shown in the inset of Fig. 3A. Using this method, we extract for samples with various doping levels and summarize the result in Fig. 3B. The values of determined in this way increases as the doping changes from K to K, consistent with the behavior of the peak positions shown in Fig. 2C. It reaches a maximum at a doping level of approximately 0.1 and then remains at the same size (or even slightly decreases) for doping levels up to the optimal doping level. We note that similar behavior appears in results obtained from Nernst effect measurements (?). Thus, taken at face value (?), the extrapolation of the nodal region data along with the behavior of the peak position at the points 6, 8, and 10 suggest that the gap characteristic of the nodal region has a distinct doping dependence from that of the antinodal gap. Specifically, the nodal region gap has a -wave momentum dependence with an amplitude that remains relatively constant for a range of doping below optimal doping and then decreases as the system becomes severely underdoped.
Now, let us summarize our momentum-space picture of this two-gap scenario. Beginning with the deeply underdoped Bi2212, there is a small Fermi arc where a peak can be observed in the EDCs at the Fermi crossing points . This arc, centered at the nodal point, then extends out along the FS increasing in length as the doping is increased. Along this arc, we find evidence for a -dependent gap, consistent with a superconducting gap with an increasing magnitude as the hole doping increases. Another pseudogap which is much larger and decreases with doping dominates the antinodal region. We believe that the smaller nodal region gap is the true superconducting gap because it exhibits a peak in the EDC. The pseudogap may arise from another mechanism such as Umklapp scattering by the antiferromagnetic correlation or competing states, such as stripes (?, ?), polaronic (?, ?) behavior, or a charge-density-wave (?, ?).
This two-gap scenario is consistent with other experiments. First, thermodynamic data suggest a distinct pseudogap and a superconducting gap (?). Second, recent Raman studies (?, ?) also suggest energy gaps extracted from B1g (dominated by the antinodal region) and B2g symmetry (dominated by the nodal region) have different origins with opposite doping dependence. In addition, contradictive results of the superconducting gap deduced from different experimental tools can also be resolved within this momentum-space two-gap picture. Andreev reflection (?) and penetration depth measurement (?) clearly indicate that the superconducting gap declines with more underdoping while tunneling spectroscopy (?, ?) shows the opposite trend with the doping. Such inconsistencies are difficult to explain using a one-gap scenario, but are naturally compatible with the two-gap scenario. We suggest that some measurements, such as Andreev reflection and the penetration depth, are sensitive to the superconducting condensate itself; thus, the superconducting gap near the nodal region is probed. On the contrary, STM spectrum is more sensitive to the antinodal gap because of larger phase space. Thus, the doping dependence of the energy gap obtained from STM, Andreev reflection and penetration depth is different because they are sensitive to different gaps in the FS.
This two-gap scenario has two important implications which could be very important for developing a microscopic theory of high superconductivity. First, the pseudogap near the antinodal region in these deeply underdoped samples is unlikely a precursor state of the superconducting state. Second, our data suggest that the weakened superconductivity in the deeply underdoped region arises not only from the loss of phase coherence (?) due to the decrease in the superfluid density but also a weakening of the pair amplitude. In this case, a mechanism for the superconducting gap reduction could be related to the shrinkage of the coherent FS with less doping leading to a smaller phase space for pairing.
References and Notes
- 1. T. Timusk, B. Statt, Rep. Prog. Phys. 62, 61 (1999).
- 2. A. G. Loeser et al., Science 273, 325 (1996).
- 3. Ch. Renner, B. Revaz, J.-Y. Genoud, K. Kadowaki, O. Fischer, Phys. Rev. Lett. 80, 149 (1998).
- 4. J. C. Campuzano et al., Phys. Rev. Lett. 83, 3709 (1999).
- 5. M. Sutherland et al., Phys. Rev. B 67, 174520 (2003).
- 6. N. Miyakawa, P. Guptasarma, J. F. Zasadzinski, D. G. Hinks, K. E. Gray, Phys. Rev. Lett. 80, 157 (1998).
- 7. G. Deustcher, Nature 397, 410 (1999).
- 8. C. Panagopoulos, J. R. Cooper, T. Xiang, Phys. Rev. B 57, 13422 (1998).
- 9. M. Opel et al., Phys. Rev. B 61, 9752 (2000).
- 10. M. Le Tacon et al., Nature Physics 2, 537 (2006).
- 11. J. M. Harris et al., Phys. Rev. B 54, R15665 (1996).
- 12. T. Yoshida et al., Phys. Rev. Lett. 91, 027001 (2003).
- 13. K.M. Shen et al., Science 307, 901 (2005).
- 14. J. Mesot et al., Phys. Rev. B 63, 224516 (2001).
- 15. J. Mesot et al., Phys. Rev. Lett. 83, 840 (1999).
- 16. Y. Wang, L. Li, N. P. Ong, Phys. Rev. B 73, 024510 (2006).
- 17. We have fit the ARPES data using various impurity scattering (Born, unitary, forward scattering (L. Zhu, P. J. Hirschfeld, D. J. Scalapino, Phys. Rev. B 70, 214503 (2004).)) models and backgrounds. However, the large number of parameters and the choice of backgrounds make it hard to extract unique conclusions from fits. Therefore we focuse directly on the data.
- 18. J. M. Tranquada, B. J. Sternlieb, J. D. Axe, Y. Nakamura, S. Uchida, Nature 375, 561 (1995).
- 19. K. Yamada et al., Phys. Rev. B 57, 6165(1998).
- 20. K. M. Shen et al., Phys. Rev. Lett. 93, 267002 (2004).
- 21. A. S. Mishchenko, N. Nagaosa, Phys. Rev. Lett. 93, 036402 (2004).
- 22. T. Hanaguri et al., Nature 430, 1001 (2004).
- 23. J. W. Loram, J. Luo, J. R. Cooper, W. Y. Liang, J. L. Tallon, J. Phys. Chem. Solids 62, 59 (2001).
- 24. V. J. Emery, S. A. Kivelson, Nature 374, 436 (1995).
- 25. A. Damascelli, Z. Hussain, Z.-X. Shen, Fig. 62, Rev. Mod. Phys. 75, 473 (2003).
- 26. ARPES experiments were performed at Stanford Synchrotron Radiation Laboratory which is operated by the Department of Energy Office of Basic Energy Science under contract DE-FG03-01ER45929-A001. This work is also supported by Office of Naval Research grant N00014-01-1-0048 and NSF grant 0304981. DJS would like to acknowledge the Center for Nanophase Materials Science at Oak Ridge National Laboratory for their support.