Scale-free statistics of plasticity-induced surface steps on KCl single crystals
Abstract
Experimental investigations of plastic flow have demonstrated temporal intermittency as deformation proceeds in a series of intermittent bursts with scale-free size distribution. In the present investigation, a corresponding spatial intermittency is demonstrated for plastic flow of KCl single crystals. Deformation bursts lead to large surface steps with a height distribution that is consistent with the distribution of strain increments in deformation of micro-columns, and the energy distribution of acoustic emission bursts observed in deformation of macroscopic single crystal samples of a wide class of materials.
Keywords: plasticity, fluctuations, defects, avalanches.
1 Introduction
In recent years, numerous experimental investigations have demonstrated temporal intermittency of plastic flow in crystalline solids. Weiss and co-workers (Weiss and Grasso 1997, Miguel et al. 2001, Richeton et al. 2006) investigated the acoustic emission of plastically deforming ice and metal single crystals and demonstrated that the acoustic emission signal consists of a series of intermittent bursts which are characterized by scale-free distributions of the energy (amplitude square integrated over the duration of a burst) and peak amplitude of the acoustic signal, with probability density functions and that are well described as power laws with exponents and , extending over up to 8 decades with no apparent cut-off.
Recently, Dimiduk and co-workers (2006) confirmed the temporally intermittent nature of plastic flow in metallic single crystals by direct observation. They carried out compressive deformation of microcolumns machined out of Ni single crystals. The elongation vs. time curves observed under stress-controlled loading are characterized by an intermittent sequence of deformation jumps, with elongation increments that are characterized by a scale-free distribution where, again, . This finding can be directly related to the acoustic emission results if one assumes that a fixed fraction of the work done by the external forces during an elongation jump is released in the form of acoustic energy.
Theoretically, the occurrence of intermittent deformation bursts has been modelled using both discrete dislocation simulations (see e.g. Miguel et al. 2001) and different types of continuum models (Koslowski et al. 2004, Zaiser and Moretti 2005). In the latter case, the emergence of scale-free avalanche dynamics is related to a depinning-like transition between an elastic and a plastically deforming phase (‘yielding transition’). A comprehensive overview of the experimental and theoretical findings has been given by Zaiser (2006).
While the temporal characteristics of plastic flow in single crystals of various materials have received a great deal of attention, much less has been done regarding the spatial aspects of plastic deformation. Weiss and Marsan (2004) used spatial triangulation to locate acoustic emission sources in plastically deforming ice single crystals and found indications of a fractal pattern of deformation loci with a fractal dimension of about 2.5. Several investigators (Zaiser et al. 2004, Wouters et al., 2005, 2006) studied the deformation-induced surface morphology of polycrystalline specimens and observed self-affine surface patterns with roughness exponents and an upper correlation length proportional to the grain size of the polycrystalline aggregates.
However, a very straightforward question regarding a possible link between temporal intermittency and spatial patterning of plastic deformation has to our knowledge never been addressed. Plastic deformation by crystallographic slip produces surface steps (in dislocation language: passage of a dislocation leaves a monoatomic step on the surface). It has been known for decades that these steps are not evenly distributed but bundled together in so-called slip lines or slip bands (for an overview see e.g. Neuhäuser 1983). A conjecture that comes almost naturally to a metallurgist’s mind is that the emergence of each slip line or slip band might be directly related to a single temporal deformation burst - in other words, that the surface steps result from deformation events that are localized both in space and in time. In this case, the surface step pattern should be intermittent in very much the same sense as the pattern of deformation steps on the strain vs. time curves, and it should be possible to match the respective statistics. The present letter is exploring this conjecture.
Any investigation of the statistics of deformation-induced surface steps hinges on the capability of preparing surfaces with a low initial density of surface steps. Accordingly, in the present investigation we use an alkali halide (KCl) single crystal specimen where atomically almost flat surfaces can be prepared by cleavage.
2 Experimental
A KCl compression specimen with {100}-oriented faces and dimensions of about mm3 was prepared by cleavage from a large commercial ‘optical grade’ single crystal. KCl cleaves readily along planes resulting in nearly atomically flat surfaces. The specimen was deformed by compression in successive steps in a standard testing machine, Instron 3360. Tests were done in compression at room temperature, at a crosshead rate of 0.002 mm/s corresponding to a nominal strain rate of s-1. The specimen exhibits a typical three-stage hardening curve with small constant hardening during Stage I, an increased hardening rate in Stage II, and a decreasing hardening rate in Stage III. The initial stages of the hardening curve (Stage I and onset of Stage II) are seen in Figure 1. In the specimen considered in the present study, initial symmetry breaking let to the initiation of plastic flow on one of four equivalent slip systems (, henceforth called the primary system) and deformation then proceeded on this system throughout Stage I. At the onset of Stage II, other slip systems (the so-called orthogonal slip system and possibly the so-called oblique slip systems) became active. For illustration of the slip geometry see the inset in Figure 1.
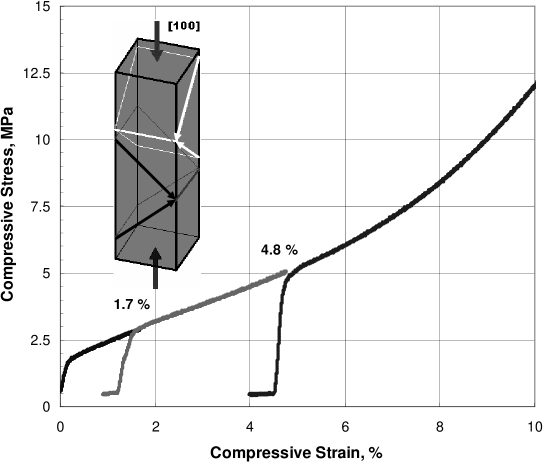
Surface topography measurements were done with a scanning white light interferometer (SWLI), Zygo NewView 100, with a lateral resolution of about 0.5 m and a vertical resolution of 0.3 nm. After examining the as-cleaved specimen, areas of mm2 were marked out on two adjacent side faces of the specimen. These areas were chosen such as to exhibit as few as possible large cleavage steps, and the surface topography was recorded. Compression was then carried out in successive steps with surface maps taken at and compressive strain, corresponding to the beginning and end of hardening Stage I, and to hardening Stage II, respectively.
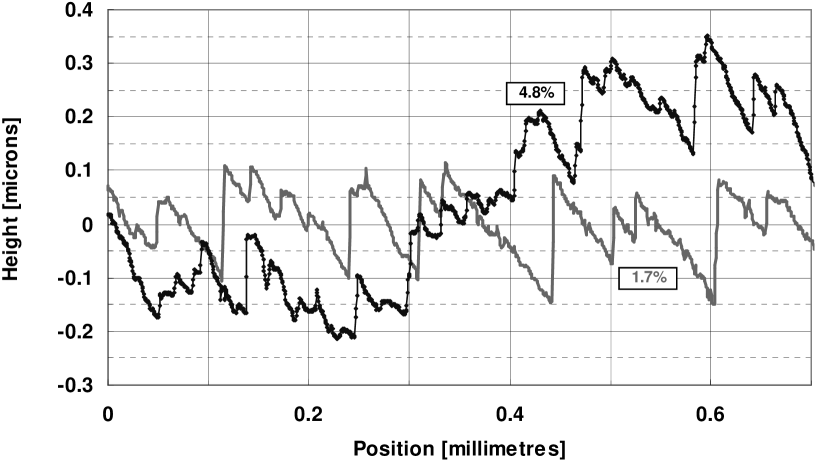
Profiles were taken after each deformation step on the specimen face where slip steps from the primary and (in Stage II) orthogonal slip systems emerged. The area coordinates on the sample were fixed relatively to one of its corners allowing, in combination with topographical characteristics such as large cleavage steps, fairly precise location of the previously measured area. For each deformation step, five 2D-profiles were extracted parallel to the compression axis (i.e. orthogonal to the slip lines). Profile lengths ranged between 0.7 and 1 mm, with a sampling step of 0.55 m. Surface profiles obtained after deformation to compressive strains of and are shown in Figure 2. At the specimen surface exhibits significant macroscopic curvature as the specimen assumes a barrel shape. The corresponding profile is not shown for the simple reason that it does not fit into the same figure.
3 Results and Discussion
From the SWLI profiles, statistics of step heights and step spacings (width of slip terraces) were determined. To this end, the local slope of the profile was evaluated in terms of the height difference of adjacent data points, a slip step was defined as a compact interval of positive slope, and accordingly a slip terrace as a compact interval of negative slope. Note that the profiles are recorded such as to have zero average slope. If deformation proceeds by slip on a single slip system, this implies that any interval over which the local strain exceeds the average strain has positive slope and, conversely, any interval over which the local strain falls below the average strain has negative slope. Hence, our definition of the slip steps and terraces implicitly uses the average strain as a threshold value.
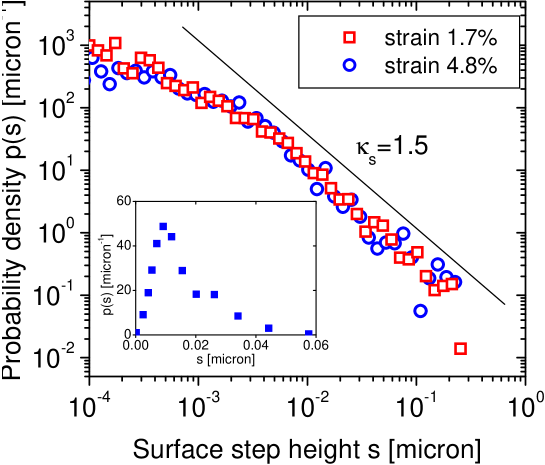
The initial as-cleaved surface exhibited cleavage steps with a typical spacing of 30 m. The probability density function of the step heights is shown in the inset of Figure 3. It exhibits a peak at a typical step height of 10 nm, while the mean step height is slightly larger.
After even a small degree of plastic deformation, the initial cleavage steps are obliterated by the larger and more dense deformation-induced slip steps. This can be seen from the distributions of surface step heights that are shown in Figure 3 for strains of and . The surface step heights now exhibit a scale-free distribution where for both and strain. Scaling is observed above a slip step height of about 2 nm (corresponding to about 6 dislocations leaving the surface) and extends over two orders of magnitude in step height without indications of an upper cut-off. The peak at a characteristic step height of 10 nm, which was the signal feature of the height distribution of cleavage steps, has disappeared completely. Using a higher threshold value for the local slope in the definition of a ’slip step’ eliminates some of the smaller slip steps but leaves the scaling regime virtually unchanged.
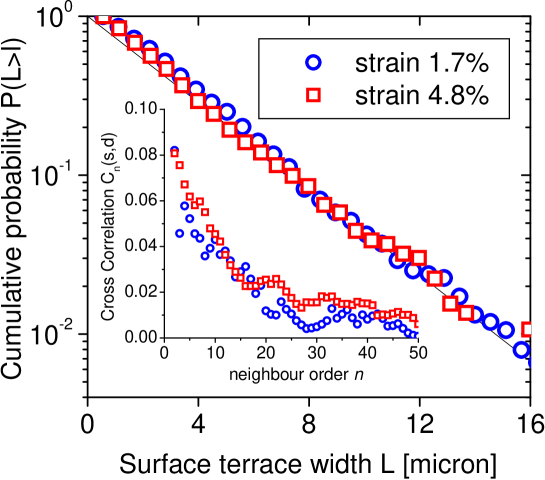
Cumulative probability distributions of slip terrace widths are plotted in Figure 4. These are quite different from the slip step height distributions: The slip terrace widths are exponentially distributed. Nevertheless, slip step heights and slip step spacings turn out to be correlated. We have evaluated the correlation functions between the size of a burst and the spacing of its neighbors. To this end, we enumerate the bursts along the profile and define (the th neighbor spacing of the th burst) as . The correlation function is then defined as
This is plotted as a function of in the insert of Figure 4. One observes a positive correlation between slip step height and slip step spacing: Larger slip steps tend to be surrounded by larger slip terraces and vice versa. This correlation can be detected up to , corresponding to a characteristic spacing of about 200 m. The available statistics does, however, not allow us to decide whether or not we are dealing with a power-law decay.
The profiles obtained at 10% strain (i.e., in hardening stage II) are quite different from those obtained in hardening stage I. In hardening stage II, multiple slip systems (the orthogonal and possibly the oblique slip systems) become active. As a consequence, the specimen surface develops significant macroscopic curvature as the specimen assumes a barrel shape. This change in shape has been corrected by subtracting a least-square fit 3rd or 4th order polynomial from the surface profiles before determining the statistics of surface steps. Simultaneous activity of the primary and orthogonal slip systems also implies that it becomes quite impossible to distinguish between slip steps and slip terraces, since slip steps created by the primary and orthogonal systems have opposite ‘signs’: On a crystal face where an edge dislocation of the primary system creates an upward step of half a lattice constant, an edge dislocation of the orthogonal system creates a downward step of the same height. Accordingly, on the profiles taken at 10 % strain, upward and downward surface steps obey similar statistics. The distributions are characterized by an exponential decay at large step sizes, and no trace of power-law statistics can be found.
The present findings regarding the slip step statistics in hardening stage I (single slip) allow for a simple and straightforward interpretation of the spatial ‘signature’ of slip events. The distribution of slip step heights is scale free with an exponent of -1.5. This is the same exponent that has been found for distribution of elongation increments observed by Dimiduk et al. (2006) and the distribution of acoustic emission energies as reported, e.g., by Miguel et al. (2001), indicating a one-to-one correspondence between strain bursts and the emergence of discrete slip steps.
It is interesting to compare the present findings with investigations of the global surface morphology of plastically deformed KCl single crystals as reported by Nadgorny et al. (2006) and Zaiser (2006), and with the results of theoretical simulations (Zaiser and Moretti 2005, Zaiser 2006). In these investigations, non-trivial scaling of the height-height correlation function of the surface profiles was reported: where . Such scaling with an exponent can be either due to the presence of long range correlations in the surface strain , (self-affine scaling), or due to the presence of fat tails in the distribution of surface step heights. Specifically, if surface steps are spatially uncorrelated but characterized by a probability density with a tail , then for the sum will scale like , i.e., . On large scales, such a profile would correspond to a Levy flight.
In the present case, we find a heavy-tailed distribution of surface steps but the surface profiles cannot be envisaged as Levy flights. Our value corresponds to , hence a sequence of uncorrelated slip steps drawn from this distribution would lead to a large-scale surface profile which might be envisaged as a Levy flight with . In the actual profiles, however, the effect of the heavy tails is partly offset by the long-range anti-correlation that arises from the fact that larger slip steps are surrounded by larger slip terraces and vice versa. The profiles cannot be interpreted as self-affine, and they are not Levy flights either.
Further and more systematic investigations, and better statistics, are clearly needed to understand the roughening of plastically deformed metal surfaces. In the present investigation, the lateral resolution along the surface achieved by SWLI is above the average slip step spacing such that individual slip steps may get ’lost’ in the statistics. Further investigations should therefore include techniques with higher lateral resolution such as atomic force microscopy (AFM). Using AFM, it may also be possible to decide upon the slip step statistics in higher deformation stages, where optical data suffer greatly from lack of lateral resolution, both in view of the smaller slip step spacings and in view of the superposition of slip steps pertaining to multiple slip systems.
Acknowledgements
Financial support by the European Commission under RTN/SizeDepEn HPRN-CT 2002-00198 and of EPSRC under Grant No. EP/E029825 is gratefully acknowledged.
References
Dimiduk, D.M., Woodward, C., LeSar, R., Uchic, M.D., 2006. Scale-Free Intermittent Flow in Crystal Plasticity, Science 26, 1188-1190.
Koslowski, M., LeSar, R., Thomson, R., 2004. Avalanches and scaling in plastic deformation, Phys. Rev. Letters 93, 125502.
Miguel, M.C., Vespignani, A., Zapperi, S., Weiss, J., Grasso, J.-R., 2001. Intermittent dislocation flow in viscoplastic deformation. Nature 410, 667-671.
Nadgorny, E.M., Schwerdtfeger, J., Madani-Grasset, F., Koutsos, V., Aifantis, E.C., and Zaiser, M., 2006. Evolution of self-affine surface roughness in plastically deforming KCl single crystals. In: A. El-Azab, S. Dattagupta, S.B. Krupanidhi, S. Noronha, S.S. Shivashankar and M. Zaiser (Eds.), Proc. Int. Conf. on Statistical Mechanics of Plasticity and Related Instabilities, Proceedings of Science, PoS (SMPRI2005) 012.
Neuhäuser, H., 1984. Slip-line formation and collective dislocation motion. In: F.R.N. Nabarro (Ed.), Dislocations in Solids, Vol. 4, North-Holland, Amsterdam, pp. 319-440.
Richeton, T., Dobron, P., Chmelik, F., Weiss, J., and Louchet, F., 2006. On the critical character of plasticity in metallic single crystals. Mater. Sci. Engng. A 424, 190-195.
Weiss, J., Grasso, J.-R., 1997. Acoustic emission in Single Crystals of Ice. J. Phys. Chem. B 101, 6113-6117.
Weiss, J., Marsan, D., 2003. Three-dimensional mapping of dislocation avalanches: Clustering and space/time coupling. Science 299, 89-92.
Wouters, O., Vellinga, W.P., Van Tijum, R., De Hosson, J.T.M., 2005. On the evolution of surface roughness during deformation of polycrystalline aluminum alloys. Acta Mater. 53, 4043-4050.
Wouters, O., Vellinga, W.P., Van Tijum, R., De Hosson, J.T.M., 2006. Effects of crystal structure and grain orientation on the roughness of deformed polycrystalline metals. Acta Mater. 54, 2813-2821.
Zaiser, M., Madani, F., Koutsos, V., Aifantis E.C., 2004. Self-affine surface morphology of plastically deformed metals. Phys. Rev. Letters 93, 195507.
Zaiser, M., Moretti, P., 2005. Fluctuation phenomena in crystal plasticity - a continuum model. J. Stat. Mech, P08004.
Zaiser, M., 2006. Scale invariance in plastic flow of crystalline solids. Adv. Physics 55, 185-245.