Separation of energy scales in the kagome antiferromagnet TmAgGe: a magnetic-field-orientation study up to 55 T
Abstract
TmAgGe is an antiferromagnet in which the spins are confined to distorted kagome-like planes at low temperatures. We report angle-dependent measurements of the magnetization in fields of up to 55 T that show that there are two distinct and separate energy scales present in TmAgGe, each responsible for a set of step-like metamagnetic transitions; weak exchange interactions and strong crystalline electric field (CEF) interactions. Simulations of using a three-dimensional, free-energy minimization technique allow us to specify for the first time the physical origin of the metamagnetic transitions in low, in-plane fields. We also show that the transitions observed with the field perpendicular to the kagome planes are associated with the CEF-split multiplet of Tm.
pacs:
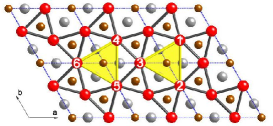
75.25.+x, 75.10.-b, 75.30.Gw, 75.30.KzInterest in antiferromagnetic (AF) systems based on structures with possible frustration, such as triangular, kagome or pyrocholore lattices, has recently burgeoned, as such materials often exhibit novel cooperative phases moessnerramirez . One example, exhibiting complex metamagnetic behavior, is TmAgGe, a member of the RAgGe (R=Tb, Dy, Ho, Er, Tm and Y) family of metallic compounds. TmAgGe adopts a layered, distorted-kagome lattice similar to the ZnNiAl structure (Fig. 1) baran ; morprb . In this paper, we show that a model based on a six-spin repeating structure can account for the majority of magnetic data on TmAgGe, including the field () positions of the metamagnetic transitions and the magnitude of the magnetization , when is applied within the kagome planes. Though TmAgGe exhibits few of the features conventionally associated with frustration, the model shows that it conforms to the fundamental definition of a frustrated system moessnerramirez : the geometry of the lattice precludes the simultaneous minimization of all of the interaction energies, in this case antiferromagnetic (AF) next-nearest-neighbor (NNN) and ferromagnetic (FM) nearest neighbour (NN) exchange with a characteristic energy scale K. We also report the first observation of a series of high-field metamagnetic transitions when is approximately parallel to ; these are due to field-induced level crossing within the crystalline-electric-field (CEF) split Tm3+ (4f12, 3H6) multiplet. Here, the energy scale is K. Based on these two energy scales (i.e. exchange K, CEF K), we can produce a complete quantitative phase diagram for TmAgGe.
Much of the essential physics is captured in Fig. 2. Fig. 2(a) shows the metamagnetic transitions (peaks in , corresponding to steep rises in ) at several values of , the angle between and the -axis. These low- transitions, determined by the K energy scale, depend only on the component of parallel to the -planes. At higher , the new series of transitions is observed (Fig. 2(b)); as shown below in the discussion of Fig. 4, these result in approaching its full saturated value of per Tm3+ ion. These transitions, determined by the K energy scale, depend only on the component of perpendicular to the -planes. The phase diagram is in Fig. 2(c); note that the low- and high- transitions can be seen in the same field sweep, showing that they are distinct phenomena, separated at all .
Oriented single crystals of TmAgGe (for growth details, see mor04 ), mm3, were used in compensated-coil measurements in a 65 T pulsed magnet at NHMFL. In one probe, the sample can be inserted into and extracted from the coil in situ, enabling a measurement of the sample’s . In the second probe, the sample is in a coil that tilts so that the angle-dependence of can be recorded. This was used to obtain the data in Fig. 2. The inclination is deduced by comparing the voltage induced in an empty coil on the tilting platform, and that from another empty, static coil. Both probes were placed in 3He cryostats ( mK). Pulsed-field data were calibrated against results from Quantum Design MPMS systems ( T; K).
The sharp features in observed in Fig. 2(a) correspond to steep increases of on either side of rounded plateaux. Examples are shown in Fig. 2(d) for and () and (); here, is an azimuthal angle coordinate, for rotating in the plane. In the former data, a broadened plateau is centred on and in the latter, a smaller, rounded shelf can be discerned at . These data, and others recorded at fixed , reproduce quantitatively the measurements in Fig. 24 of Ref. morprb . To model such data, and to predict the phase diagram of TmAgGe, we use the following Hamiltonian:
| (1) | |||||
Here, and are NNN AF and NN FM exchange constants, is the component of the th spin along the local easy axis morprb and is the anisotropy energy. The 6-spin repeating structure (Fig. 1) is sufficient to reproduce the majority of the features of .
Having established the interactions and the number of spins involved, the simulation involves using the downhill simplex method neld65 ; numrecip to find the minimum free-energy spin configuration for a particular value and direction of . The parameters , and are then adjusted to quantitatively match data (e.g. Figs. 2(d) and 3(b)), a process that provides a tight constraint of the values. Note that in contrast to previous phenomenological geometrical models of TmAgGe morprb , there is no need to impose a starting spin configuration; our model automatically finds a reasonable arrangement.
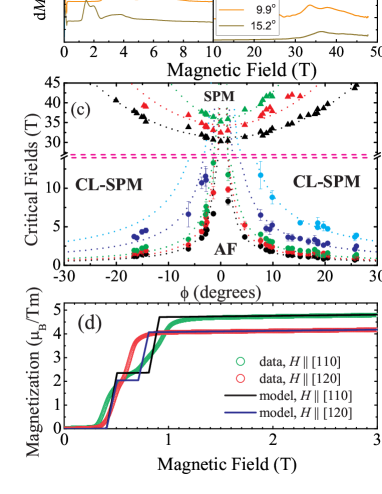
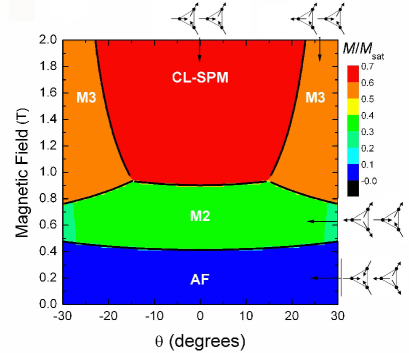
Simulations are shown with data in Fig. 2(d), and corresponding spin configurations are given in the phase diagram () of Fig. 3(a) for the various states. In the AF groundstate, the spins on each triangular plaquette lie in the non-colinear directions dictated by the anisotropy, with spins pointing inwards and outwards alternately on adjacent triangles in order to minimize the energy of the FM term in the Hamiltonian. As increases along [110] () the spins remain parallel to their easy axes, but three of the spins flip towards the direction of , while two flip back to minimize the AF term’s energy. This forms the M2 state morprb , corresponding to the plateau in in the model and the broadened step in the data. As increases further, the AF interactions are overcome and the spins rotate towards , leading to the crystal-field-limited saturated paramagnetic (CL-SPM) state. For (), the M2 state again forms (plateau in model, inflexion in data) but the CL-SPM state is not realized, as one of the spins is perpendicular to, and so cannot couple with, . Instead, the FM interactions force the moments into the M3 state.
In addition to the absolute size of within the various states (color scale), Fig. 3(a) shows the -dependences of the critical fields marking the boundaries between the spin configurations (thick lines). These are obtained by equating the free energies of the states, yielding:
| (2) |
Here, , where and are respectively the total angular momentum quantum number and Landé g-factor for Tm3+.
Eqs. 2 are similar to those extracted from data in Ref. morprb , but with explicit prefactors; comparison of Eqs. 2 with the experimental critical fields observed in the current study and in Ref. morprb forms a tight constraint on the model parameters and . We find K and K. The energy ranges of the first two terms in Eq. (1) are and ; thus the energy scale at which the exchange interactions are important is K. Not only does this energy scale account for the sizes of the critical fields of the low-field metamagnetic transitions (Figs. 2(a),(d)); it is also responsible for the transition at K into the state that we have labelled. Although the AF state has zero moment, the model shows that the FM interactions are ultimately responsible for its spin configuration. This, and the plethora of other states observed in the data (Figs. 3(a), (b)) result from competition of FM and AF interactions; the geometry of the lattice precludes the simultaneous minimization of all of the interaction energies. In this respect, TmAgGe conforms to the most fundamental definition of a frustrated system moessnerramirez .
Whilst our 6-spin system (Fig. 1) and Hamiltonian (Eq. 1) describe most of the low-field data presented in this paper and in Ref. morprb , it is necessary to make two comments. First, the rise in observed between the low-field AFM state and the broadened step associated with the M2 spin configuration (Fig. 2(d)) is attributed elsewhere morprb to a state labelled M1; our model does not predict M1, instead showing a direct AFM-M2 transition (fig. 3(a)). Second, to achieve a quantitative reproduction of all the other states observed, it is necessary to suppress FM interactions between spin 1 in Fig. 1 and its NNs: if these interactions are switched on in the simulations then the angular region over which the M3 state is observed is severely reduced and the M2 state disappears completely, in contradiction to experiments. The most likely explanation is that our 6-spin model is a subset of the actual repeating magnetic structure in TmAgGe. Support for this view comes from the structures inferred from analysis of data in Ref. morprb , which suggest that spins are required to reproduce within the M1 state. Nevertheless, we emphasise that the 6-spin repeating system (Fig 1, Eq. 1) is able to describe almost all of the data, especially those at high , and represents a tractable model for exploring spin physics in layered kagome systems of this kind.
We now turn to the other energy scale in TmAgGe, associated with the CEF interactions. Though the moments are strongly inclined to lie along the easy axes, the finite means that they will cant towards , leading to the gradual increase in as rises seen in the CL-SPM state (Fig. 2(d)). Using this gradient, we find that K. This explains the large negative Curie temperature for (); the Zeeman and anisotropy terms dominate in Eq. 1 for , and in this limit one can show that the high- is linear with a -axis intercept of K, in reasonable agreement with experiment ( K mor04 ).
The third term of Eq. 1 has a magnitude K, forcing a non-colinear or “compromise” structure on the Tm moments at s far in excess of those at which the AF interactions become important. This compromise structure, in which the moments lie in the planes apart, could potentially possess a number of different degenerate spin configurations moessnerramirez . However, in TmAgGe the model shows that the degeneracy is lifted by the FM NN interactions, leading to the states at low s and the magnitude and sign of K mor04 . As mentioned above, these states are then accessible using small in-plane () s, accounting for the metamagnetic transitions (Figs. 2(d) and 3) footnote .
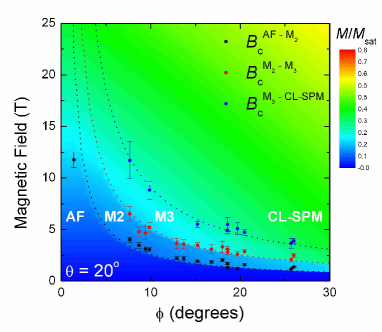
Fig. 3(b) shows the phase diagram of TmAgGe simulated using the above parameters, together with experimental data. In agreement with experiment, the relatively large confines the spins to the planes, so that the low-, metamagnetic transitions depend only on the component of in the planes; the critical fields scale as xxx . Note that the simulation uses , in agreement with the nominal orientation of the sample.
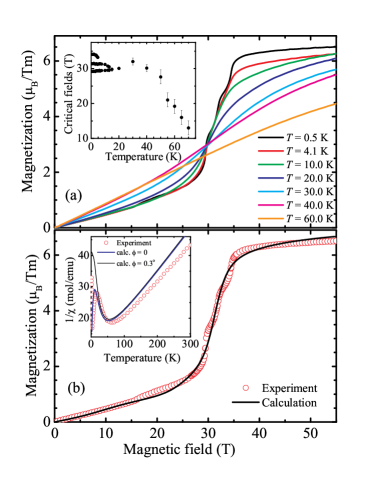
We now turn to the high- metamagnetic transitions observed when is applied out of the planes (Fig. 2(b)). As mentioned before, peaks in correspond to steep rises in ; this is shown in Fig. 4(a) for . Eq. (1) predicts that for , the low- should increase linearly in with a gradient given by , reaching its saturated value of 7 per Tm3+ ion at T. The experimental in Fig. 4(a) does increase linearly at low (albeit at low with a smaller gradient than predicted); however, at T the steep rise in mentioned above is observed, and approaches its saturated value. This is similar to what has been observed in high- measurements of HoNi2B2C abliz . For K, there is a two- or three-fold structure within the rise in ; at higher , these structures are not resolved, but a single transition in is visible to K (Fig. 4(a), inset). s of 20 K and 70 K are several times higher than K, indicating that the transition(s) in in Fig. 4 cannot easily be attributed to exchange interactions. Indeed, as one tilts away from (Figs. 2(a), (b)), the low- metamagnetic transitions that can be confidently attributed to the competing FM and AF exchange interactions are observed within the same field sweeps as the transition(s) at T; this strongly suggests that the mechanisms for the low- and high- transition(s) are distinct.
The field of T suggests an energy scale for the high- transitions similar to the anisotropy term in Eq. 1. The likely candidate is CEF splitting of the multiplet, which causes the easy-axis anisotropy seen at low . As stated above, such splittings would be of the order of K (Eq. 1, third term). When the Zeeman energy becomes of this order, level crossings are expected; this occurs when T, in agreement with the data. The Tm ions are located at sites with orthorhombic symmetry baran and so we consider the Hamiltonian , a sum of CEF walter84 and Zeeman terms, where the and are the CEF parameters and Stevens operators, respectively. The with contain the angular momentum raising and lowering operators; thus, if the corresponding CEF parameters are large enough, these terms will lead to substantial mixing of the energy levels.
By diagonalizing and using expressions for and from Ref. abliz , we find values for the Stevens parameters such that the low- with is a reasonable match to the experimental data (Fig. 4(b)). The low- -axis is well reproduced, as is the transition to saturation around 35 T. However the three steps within this transition are not found in the calculations. The inset in Fig. 4(b) shows the calculated low-field versus . Whilst the calculations reproduce the inset data qualitatively, the quantitative agreement is less good than in Fig. 4(b), partly because at low the calculated is very sensitive to ; the same is true to a lesser extent of the experimental data. Note that the values in the caption to Fig. 4 merely represent a possible solution to the problem; our intent here is to show that CEF splitting of the multiplet alone can account for the primary features of the dependence of the -axis and . A further constraint on the parameters must await inelastic neutron scattering experiments.
This work is supported by the U.S. Department of Energy (DoE), NSF, the State of Florida, EPSRC (UK) and the Oxford Glasstone Fellowship Scheme. Ames Laboratory is operated for DoE by Iowa State University under Contract W-7405-ENG-82. We thank Susan Cox and Neil Harrison for helpful suggestions.
References
- (1) R. Moessner and A. P. Ramirez, Phys. Today, 59, 24, (2006).
- (2) S. Baran et al., J. Alloys Comp., 281, 92, (1998).
- (3) E. Morosan et al., Phys. Rev. B, 71, 014445, (2005).
- (4) E. Morosan et al., J. Magn. Magn. Mat. 277, 298 (2004).
- (5) J. A. Nelder and R. Mead, Comp. J., 7, 308, (1965).
- (6) W. H. Press et al., Numerical Recipes In Fortran 77, (Cambridge: CUP) p402.
- (7) An analogous result was found for jarosites ballou . Jarosites are insulators, and so the exchange mechanism differs from metallic TmAgGe. Nevertheless, the physics of competing NN and NNN interactions is the same.
- (8) R. Ballou et al., J. Magn. Magn. Mat., 262, 465 (2003).
- (9) Similar angle dependences have been observed for other highly anisotropic, local-moment systems when is rotated away from the easy axis (or plane) budko .
- (10) S.L. Bud’ko et al., J. Magn. Magn. Mat. 205, 53 (1999).
- (11) U. Walter, J. Phys. Chem. Solids, 45, 401, (1984).
- (12) M. Abliz et al., J. Phys. Soc. Japan, 72, 2599, (2003).