noise and avalanche scaling in plastic deformation
Abstract
We study the intermittency and noise of dislocation systems undergoing shear deformation. Simulations of a simple two-dimensional discrete dislocation dynamics model indicate that the deformation rate exhibits a power spectrum scaling of the type . The noise exponent is far away from a Lorentzian, with . This result is directly related to the way the durations of avalanches of plastic deformation activity scale with their size.
pacs:
62.20.Fe,05.40.-a,89.75.-k,61.72.BdI Introduction
Traditionally, the plastic deformation of solids has been thought of as a smooth process, so that the fluctuations can be neglected on large enough scales as the behavior becomes homogeneous. Contrary to this old paradigm, very recent evidence from experiments points out clearly that plastic deformation proceeds via bursts of dislocation activity miguel ; dimiduk ; weiss ; marsan ; zaiser ; weiss_jcp ; zaiserreview . This activity, due to the long-range interactions, should have extended spatial and temporal correlations. Supporting this new picture, a number of simulation studies of simplified models miguel ; miguel2 ; koslowski ; morettizaiser_jstat have demonstrated that such bursts or avalanches can be characterized by, apparently, scale-free size distributions.
These advances bring plasticity close to a multitude of systems exhibiting “crackling noise” sethna . This is a generic property of many non-equilibrium systems, such as earthquakes gr , Barkhausen noise in ferromagnets durin , fracture ciliberto ; salminen , vortex avalanches in superconductors field and martensitic shape memory alloys vives to name a few. The common feature among these are metastability and avalanches of activity that intercept quiescent periods. The realization that plastic deformation has rich internal dynamics is of interest both for physics and materials science. Dislocations provide an interesting example of the physics of systems with long-range interactions competing with pinning from obstacles such as impurities, grain boundaries, and other dislocations zaiserreview ; morettizaiser (“forest hardening” being a well-known example of the ensuing phenomena).
Such avalanching systems are most simply studied by the one-dimensional activity time series . In plasticity, could be the global strain rate, or the acoustic emission activity during deformation, or in a constant strain rate experiment the shear stress. In this work we consider the temporal characterization of dislocation activity and show that its power spectrum (PS) exhibits what is known as -noise, . This “flicker” noise is a well-known but relatively little understood phenomenon in various fields of science 1/f . Then, we relate the scaling exponent to the characteristic scaling of the avalanches. This has to be done with care due to the low-level background activity included in . At the end, we are able to demonstrate that the noise of irreversible deformation may follow generic, experimentally verifiable scaling laws. We use a simple two-dimensional (2d) discrete dislocation dynamics (DDD) model miguel2 , and study its behavior in the steady-state regime with a constant shear stress and a small (on the average constant) deformation rate. While the statistics of avalanche sizes in this kind of models has been established to be of power law type miguel ; miguel2 , no temporal scaling analysis has been presented so far.
The PS of a time series is the absolute square of the Fourier transform of ,
| (1) |
Since the time-time correlation function and the PS are related, the latter is a measure of temporal correlations in the system. -values less than two indicate the presence of complex time correlations. Recently it has been realized that under certain fairly general conditions the exponent can be derived from the scaling exponents characterizing the avalanche distributions, the examples ranging from models of Barkhausen noise KS , to self-organized criticality oma to fluid invasion into disordered media rost . The intermittency is easier to understand in toy models as sandpile models of self-organized criticality btw , where drops to zero between avalanches. In most experiments and more realistic model systems - such as here - there is a background (from noise, or processes that co-exist with the avalanches). Also, finite drive rates can lead to merging of avalanches, thus to problems in characterizing the underlying activity.
The structure of the paper is as follows: In Sec. II we introduce the 2d DDD model, and in Sec. III the scaling relation relating the power spectrum exponent to the avalanche statistics is presented. Results of the numerical simulations are presented in Sec. IV. Section V finishes the paper with conclusions.
II DDD model
Despite its simplicity, the DDD model we study here has been shown to capture many features of realistic plasticity, such as avalanches with scale-free size distributions miguel ; miguel2 as well as the Andrade creep law miguelprl . It is a two-dimensional model representing a cross section of a crystal with single-slip geometry. The dislocations are assumed to be straight parallel edge dislocations, with the dislocation lines oriented along the axis. They glide along directions parallel to their Burgers vectors , with the unit vector in the -direction. It is thus sufficient to consider a two-dimensional system (i.e. the plane) with pointlike edge dislocations gliding in the -direction. Equal numbers of dislocations with positive and negative Burgers vectors are assumed. For simplicity other processes contributing to dislocation motion such as dislocation climb are not considered.
An essential feature of the model is that the dislocations interact with each other through their anisotropic long-range stress fields
| (2) |
where , with the shear modulus and the Poisson ratio of the material. We assume overdamped dynamics with a linear force-velocity relationship, giving rise to the equations of motion of the form
| (3) |
where is the velocity of the ’th dislocation, is the dislocation mobility, refers to the sign of the Burgers vector of the ’th dislocation and is the external shear stress experienced by the dislocation. These equations are put into a dimensionless form by measuring lengths in units of , times in units of and stresses in units of . Due to the long range nature of the dislocation-dislocation interaction, periodic boundary conditions are implemented with an infinite sum of images hirth . The positions , , of the dislocations as a function of time are computed by integrating the equations of motion (3) numerically by using an adaptive step size fifth-order Runge-Kutta algorithm.
For small distances, Eq. (2) ceases to be valid. Thus for distances smaller than from the dislocation, we set the dislocation stress field to zero. This procedure removes the unphysical singularity in Eq. (2). Furthermore, when the distance between two dislocations with Burgers vectors of opposite sign gets small, i.e. , we employ a phenomenological annihilation reaction by simply removing them from the system. To compensate, and to include dislocation multiplication (as in real plasticity through Frank-Read sources), we introduce a mechanism to create new dislocations. The system is split into smaller cells and then one monitors both the local stress and the number of pinned dislocations (i.e. those moving slower than a threshold velocity) in each cell. Given pinned dislocations and that the local stress exceeds a threshold value, a dislocation pair with opposite Burgers vectors is generated with a probability proportional to the absolute local stress value. This means that on the average it takes a finite time for the source to create a new dislocation pair, as is the case with real dislocation sources. The two new dislocations of opposite sign are inserted into random locations inside the neighboring cells of the one containing the activated source. This is done with the constraint that their combined stress field must decrease the magnitude of the local stress at the source location, while elsewhere in the system further dislocation activity may be triggered, resulting in a correlated sequence of dislocation activity.
III Scaling of the power spectrum
Consider a bursty time series consisting of temporally separated avalanches. The usual definition of an avalanche is a connected sequence of values of exceeding some threshold value , to e.g. subtract uncorrelated background noise. If an avalanche starts at and ends at , the size of an avalanche of duration is defined as . Assume that the average avalanche size of avalanches of a given duration scales as a power law of the duration,
| (4) |
and that the avalanches are self-similar so that the averaged avalanche shapes of avalanches of different durations can be collapsed onto a single curve by using the ansatz
| (5) |
Here, is a scaling function. The total energy is obtained as the component of the stationary time-time correlation function, defined by . By cosine transforming the time-time correlation function of avalanches of a given size , one obtains the scaling form
| (6) |
for the corresponding energy spectrum. The scaling of the total power spectrum then follows by averaging over the avalanche size probability distribution , e.g. a power law cut off at , so that
| (7) |
The result will depend on the value of as well as on the form of the scaling function KS ; oma . In the case KS ; oma and (for the DDD models at hand, the latter condition seems to be fulfilled, with miguel2 ) the power spectrum scales as
| (8) |
This indicates a scaling relation , which possibility we next check with simulations.
IV Results
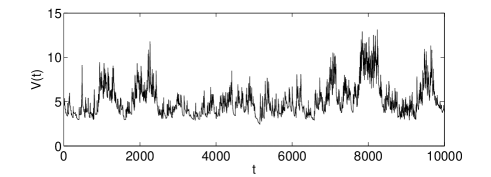
A natural choice for the time series is the “collective velocity” of the dislocations, . It is proportional to the energy dissipated per unit time by the dislocation system. Thus the statistical properties of could be related to the acoustic emission (AE) statistics, as suggested by a number of authors, see Ref. zaiserreview . Another possibility is , i.e. the global strain rate. We mainly present results here for the first choice.
The numerical simulations are started from a random initial configuration of dislocations with equal numbers of positive and negative Burgers vectors (here and , with and , respectively). The system is first let to relax in the absence of external stress, until it reaches a metastable arrangement with . Then a small constant external stress is applied and the evolution of the system is monitored. In the absence of dislocation multiplication, the system undergoes a “jamming transition” at a critical value of the external stress miguelprl . For , the strain rate decays as a power law in time, with the Andrade’s power law creep exponent close to . For , the system crosses over to a constant strain rate regime (linear creep) which we study next.
With the dislocation multiplication turned on, the system displays intermittent avalanche-like bursts of dislocation activity. The number of dislocations fluctuates around for and for . Fig. 1 shows that displays intermittent behavior, consisting of avalanches. These are defined as a connected sequence of -values exceeding a threshold value and have a wide range of sizes. Here, we monitor for external stress values close to but above the critical value .
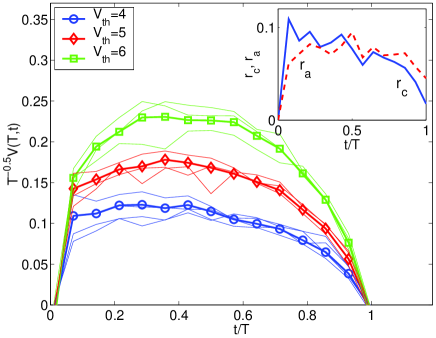
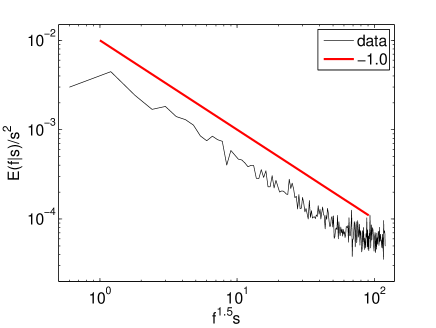
Fig. 2 exhibits the average avalanche shape (one needs a minimum duration, of the order of 10, for scaling), for varying . They appear to agree with Eq. (5). The data has been obtained by scaling all individual avalanches in a given duration range according to Eq. (5). The threshold value does not have any effect on the statistics (given that is high enough such that a “noise level” corresponding to incoherent motion of dislocations is not taken into account), but the avalanche shapes appear to depend on . For small -values, avalanches are clearly asymmetric to the left (in agreement with experiments weiss3 ), but become more symmetric upon increasing . This asymmetry is also manifest in the creation rate of dislocations during an avalanche (inset of Fig. 2). In Fig. 3 we show the energy spectra computed using the Lomb periodogram, scaled according to Eq. (6). The behavior of the scaling function indicates that .
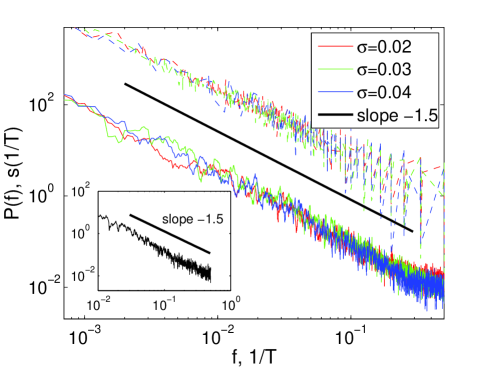
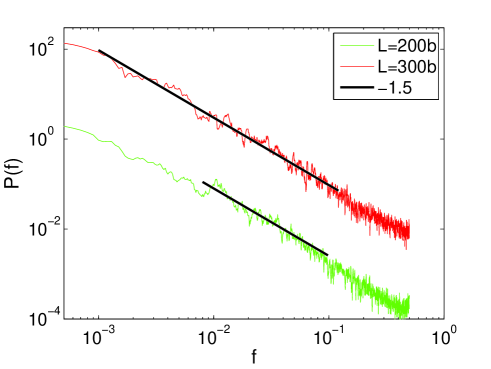
The main result is shown in Fig. 4, where we compare the scaling of the total power spectrum, from , with that of . We observe a PS of the form spanning almost two decades, with . Thus the PS of dislocation activity is related here to the intrinsic scaling of the avalanches. The extension of the scaling regime increases with , the system size (Fig. 5), with a cut-off frequency roughly equal to the system size dependent inverse duration of the longest avalanche, . The absence of scaling for the very highest frequencies () is due to a finite crossover time, before the avalanches have a self-similar structure. Similarly to the exponent of the avalanche size distribution miguel , the exponent of the power spectrum is interestingly insensitive to the value of the external stress. In the inset of Fig. 4 we consider the PS of the total strain rate. While the scaling region appears somewhat narrower in this case, the exponent is observed to be unchanged from .
These results are largely independent of the details of the model, such as the threshold value for the local stress to create new dislocations. We have checked that the same results can be recovered even in the case with no dislocation multiplication, where the avalanches are due to different threshold mechanisms, such as unpinning of dislocation dipoles. As this approach suffers from the fact that simulations are computationally more demanding due to the longer time scales one must reach, we have here restricted ourselves to considering only the case where dislocation multiplication does occur.
Knowing that the the avalanches are self-affine one can also compute from the other known exponents. Consider the probability that a value will occur at some point during an avalanche of size . Assuming scaling and requiring normalization, , as well as , one obtains (see also KS )
| (9) |
where is a scaling function. The total probability is then obtained by integrating over the avalanche size distribution , giving rise to . Miguel et al. miguel studied the statistics of the quantity , and found that its distribution behaves like , with . From one may solve for , resulting in (with miguel2 )
| (10) |
in reasonable agreement with our results above.
V Conclusions
In this work, we have demonstrated that a simple two-dimensional dislocation system exhibits -noise, so that the relation can be explained by the scaling properties of the avalanche dynamics. We have also considered the PS of the global strain rate, with similar conclusions. These findings lend themselves to experimental tests, e.g. as in the creep experiments of ice single crystals weiss , in experiments on deforming metallic single (micro)crystals weiss2 ; dimiduk , and could also be considered in experiments on colloidal crystals pertsinidis . In AE experiments performed with three-dimensional systems, values consistent with mean field exponents have been reported weiss ; weiss2 , suggesting (see Eq. (10)). It is thus possible that to get quantitative agreement with experiments, the full three-dimensional problem should be studied, e.g. by means of simulations of a three-dimensional dislocation dynamics model. Other issues not considered in the present study include the possible relevance of quenched disorder e.g. in the form of forest dislocations, which would provide strong pinning centers to resist dislocation motion. One should note, however, that also the present model contains a pinning force landscape generated by the dislocations themselves miguel .
In polycrystals, avalanches interact with the grain boundaries, which will probably lead to a size-dependent avalanche shape richeton . This means that Eq. (5) is no longer directly applicable, presenting an interesting theoretical question. Our theory assumes negligible correlations between avalanches. In experiments, dislocation avalanches have been found to exhibit a tendency to cluster in time, such that a “mainshock” is typically followed by a sequence of few “aftershocks” weiss ; dimiduk . While this may modify the low frequency part of the PS, the high frequency part, corresponding to correlations within individual avalanches, is still expected to scale according to Eq. (8).
Finally we note that in addition to materials with crystalline structure, one field where the use of spectral tools and the study of avalanches might be used to characterize the spatio-temporal behavior is the plasticity of non-crystalline media, e.g. amorphous glasses, where the localization and intermittency of plastic events has been recently demonstrated in simulations lemaitre ; tanguy .
Acknowledgments The Center of Excellence program of the Academy of Finland is thanked for financial support.
References
- (1) M. Zaiser, Advances in Physics 55, 185 (2006).
- (2) M.-C. Miguel, A. Vespignani, S. Zapperi, J. Weiss, and J.-R. Grasso, Nature 410, 667 (2001).
- (3) D. M. Dimiduk, C. Woodward, R. LeSar, M. D. Uchic, Science 312 1188 (2006).
- (4) J. Weiss, J.-R. Grasso, M.-C. Miguel, A. Vespignani, and S. Zapperi, Mat. Sci. Eng. A 309-310, 360 (2001).
- (5) J. Weiss and D. Marsan, Science 299, 89 (2003).
- (6) M. Zaiser, F. Madani, V. Koutsos, and E. C. Aifantis. Phys. Rev. Lett. 93, 195507 (2004).
- (7) J. Weiss and J.-R. Grasso, J. Phys. Chem. B 101, 6113 (1997).
- (8) For a typical 2d DDD model, see: M.-C. Miguel, A. Vespignani, S. Zapperi, J. Weiss, and J.-R. Grasso, Mat. Sci. Eng. A 309-310, 324 (2001).
- (9) M. Koslowski, R. LeSar, and R. Thomson, Phys. Rev. Lett. 93, 125502 (2004).
- (10) M. Zaiser and P. Moretti, J. Stat. Mech. (2005) P08004.
- (11) J. P. Sethna, K. A. Dahmen, and C. Myers, Nature 410, 242 (2001).
- (12) B. Gutenberg and C. F. Richter, Bull. Seismol. Soc. Am. 34, 185 (1944).
- (13) G. Durin and S. Zapperi, J. Magn. Mat. 242-245, 1085 (2002).
- (14) A. Garcimartin et al., Phys. Rev. Lett 79, 3202 (1997).
- (15) L.I. Salminen, A.I. Tolvanen, and M.J. Alava, Phys. Rev. Lett. 89, 185503 (2002).
- (16) S. Field, J. Witt, F. Nori, and X. Ling, Phys. Rev. Lett. 74, 1206 (1995).
- (17) E. Vives, J. Ortín, L. Mañosa, I. Ràfols, R. Pérez-Magrané, and A. Planes, Phys. Rev. Lett. 72, 1694 (1994).
- (18) P. Moretti, M.-C. Miguel, M. Zaiser, and S. Zapperi, Phys. Rev. B 69, 214103 (2004).
- (19) P. Dutta and P. M. Horn, Rev. Mod. Phys. 53, 497 (1981); M. B. Weissmann, Rev. Mod. Phys. 60, 537 (1988); E. Milotti, physics/0204033.
- (20) M. C. Kuntz and J. P. Sethna, Phys. Rev. B 62, 11699 (2000).
- (21) L. Laurson, M. J. Alava, and S. Zapperi, J. Stat. Mech. (2005) L11001.
- (22) M. Rost, L. Laurson, M. Dubé, and M. Alava, submitted.
- (23) P. Bak, C. Tang, and K. Wiesenfeld, Phys. Rev. Lett. 59, 381 (1987).
- (24) M.-C. Miguel, A. Vespignani, M. Zaiser, and S. Zapperi, Phys. Rev. Lett. 89, 165501 (2002).
- (25) J. P. Hirth and J. Lothe, Theory of Dislocations (Krieger, Malabar, Florida, 1992).
- (26) T. Richeton, J. Weiss, and F. Louchet, Acta Mater. 53, 4463 (2005).
- (27) T. Richeton, P. Dobron, F. Chmelik, J. Weiss, and F. Louchet, Mat. Sci. Eng. A 424, 190 (2006).
- (28) A. Pertsinidis and X. S. Ling, New J. Phys. 7, 33 (2005).
- (29) T. Richeton, J. Weiss, and F. Louchet, Nature Materials 4, 465 (2005).
- (30) C. Maloney and A. Lemaître, Phys. Rev. Lett. 93, 016001 (2004).
- (31) A. Tanguy, F. Leonforte, and J.-L. Barrat, Eur. Phys. J. E 20, 355 (2006).