Point-contact spectroscopy of the nickel borocarbide superconductor YNi2B2C in the normal and superconducting state
Abstract
Point-contact (PC) spectroscopy measurements of YNi2B2C single crystals in the normal and superconducting (SC) state (T15.4 K) for the main crystallographic directions are reported. The PC study reveals the electron-phonon interaction (EPI) spectral function with dominant phonon maximum around 12 meV and further weak structures (hump or kink) at higher energy at about 50 meV. No ”soft” modes below 12 meV are resolved in the normal state. The PC EPI spectra are qualitatively similar for the different directions. Contrary, directional study of the SC gap results in 1.5 meV for the a direction and 2.3 meV along the c axis; however the critical temperature in PC in all cases is near to that in the bulk sample. The value 2/ 3.6 is close to the BCS value of 3.52, and the temperature dependence is BCS-like, while the for small gap is below BCS behavior at similarly as in the two-gap superconductor MgB2. It is supposed that the directional variation can be attributed to a multiband nature of the SC state in YNi2B2C.
pacs:
72.10.Di, 74.45.+c, 74.70DdI Introduction
The family of borocarbide superconductors B2C, where is a rare-earth element and is a transition metal element (mainly Ni) have been studied intensively after superconductivity in B2C was discovered in 1994 Cava ; Nagarajan . Nevertheless, the nature and mechanism of superconductivity in borocarbides which have 3D electronic structure are still under debate. The most thermodynamic, transport and spectroscopic measurements Muller ; Muller1 give evidence that the superconducting (SC) state has an -wave symmetry and the pairing is mediated by the electron-phonon interaction. However, for nonmagnetic = Lu and Y compounds there are several properties mentioned in Ref.Drechsler , which when taken together, might be interpreted also as hints for unconventional -wave or -wave superconductivity. An anisotropic s-wave order parameter (or s+g model) was proposed for LuNi2B2C and YNi2B2C in Maki . Anyhow, irrespective of the actual order parameter symmetry, there is clear evidence for a notable anisotropy of the SC gap in YNi2B2C Izawa ; Park ; Martinez ; Pratap ; Mukho ; Bashlakov ; Yokoya ; Huang at least on parts of the complex Fermi surface drechsler04 ; drechsler03 ; drechsler01 .
Using point-contact (PC) spectroscopy Naid both the SC order parameter and the PC electron-phonon interaction (EPI) function can be determined from the first and second derivatives of the characteristic of PC, respectively. The measurement of the second derivative of the for PC provides straightforward information as to the PC EPI function Naid ; KOS ; Kulik . The knowledge of for conducting systems is a touchstone as to phonon-mediated superconductivity, which is governed by the value of the electron-phonon-coupling parameter . Moreover, the comparison of the experimentally determined with the calculated one can discriminate different theoretical models and approaches. Thus the PC spectroscopy could be helpful to illuminate details of the EPI in B2C as well as to resolve non-phonon quasiparticle interactions. In addition, the SC gap determines the behavior of the curve of PC at the low biases of a few mV, which is widely used to derive the SC gap from routine fitting by the well-known Blonder-Tinkham-Klapwijk (BTK) equations BTK82 . These experimental information as to the SC gap and EPI function is very useful for understanding the SC properties and the mechanism of superconductivity for the material under study.
Up to now there are a few papers where YNi2B2C has been investigated by PC spectroscopy Ryba1 ; Pratap ; Mukho ; Bashlakov ; Yanson0 ; Yanson1 . The first four papers are devoted to study of the SC gap, while the PC EPI spectra for YNi2B2C were measured and analyzed in Yanson0 ; Yanson1 . The main attention there was devoted to study the low energy part of the PC spectra and to so called ”soft” mode at about 4-5 meV in the electron-quasiparticle spectrum. However, the measured PC spectra were featureless above 20 mV, although a number of pronounced phonon peaks are well resolved at higher energy by neutron spectroscopy Gompf . In this paper we present more detailed data as to PC EPI spectra of YNi2B2C and as to directional measurements of the SC gap in this compound. The data were reported on M2S-HTSC Conference in Dresden (July 9-14, 2006) and partially published in Physica C M2Sconf .
II Experimental details
We have used single crystals of YNi2B2C grown by a floating zone technique with optical heating Souptel . The sample has a residual resistivity of cm and a residual resistivity ratio (RRR) about 40. It becomes superconducting at about 15.4 K with a transition width about 0.1 K. PCs were established both along the c axis and along the a axis as well as in the basal plane close to the [110] direction by standard ”needle-anvil” or ”shear” methods Naid . As a counter electrode Cu or Ag thin (0.15 mm) wires were used to study the SC gap via the mechanism of Andreev reflection. A series of measurements were done using homocontacts between two pieces of YNi2B2C. In this case the orientation of the contact axis with respect to the crystallographic directions was not controlled. The experimental cell was placed in a flow cryostat, enabling measurements from 1.5 K up to and higher. PCs were created by touching the YNi2B2C surface by sharpened Cu and Ag wires directly in the cryostat at liquid helium temperature. To establish homocontacts two pieces of YNi2B2C were touched. An disadvantage of the ”needle–anvil” method is the sensitivity of the contacts to mechanical vibrations and to change of temperature. As a result, temperature measurements have sustained about a quarter from total in four tens of the contacts investigated at liquid helium temperature.
Using a technique of synchronous detection of weak alternating signal harmonics, the first harmonic of the modulating signal (proportional to the differential resistance ) and the second harmonic (proportional to ) were recorded as a function of the bias voltage . can be expressed as follows:
| (1) |
According to the theory of PC spectroscopy KOS ; Kulik the second derivative of the curve of the ballistic contact at low temperatures is determined by the PC EPI function :
| (2) |
where e is the electron charge, is the PC diameter and , roughly speaking, reflects strength of the interaction of electrons with phonons. This interaction underlines the large-angle scattering (back-scattering) processes KOS of electrons in the PC constriction. Thus is a kind of transport EPI function which selects phonons with a large momentum or Umklapp scattering. The PC diameter , which enters in Eq.(2), can be calculated by the Wexler Wexler relation:
| (3) |
which consists of a sum of ballistic (Sharvin) and the diffusive (Maxwell) terms. Here e2 corresponds to the free electron model, where is the Fermi momentum and is the density of charge carriers. Using data for cm and =41 nm from Shulga the product is about 10 cm2 in YNi2B2C.
From (1) and (2) can be defined as:
| (4) |
that is the measured ac voltage weighted by is directly proportional to the PC EPI function . Here it is necessary to mention that the finite temperature and the alternating voltage result in a smearing of the measured spectra. Thus, the infinitely narrow spectral peak smears into a bell-shaped maximum (see, e. g. Naid ) with the width
| (5) |
For example, the smearing of a PC spectrum measured at liquid helium temperature 4.2 K and at ac voltage between 1 and 2 mV, mainly used in our measurements, is between 2.6 and 4 mV.
The PC EPI function should vanish above the maximum phonon energy , which is close to the Debye energy , because of the lack of phonons with larger energy. Therefore, according to (4) the PC spectrum should vanish above . In fact, measured PC spectra always have a nonzero almost constant value above the Debye energy, the so-called background. The general nature of the background was understood by taking into account an accumulation of nonequilibrium phonons in the PC region created by the energized electrons. The details of the background calculations are given elsewhere Kulik ; Kulik1 . The most often semiempirical formula Naid
| (6) |
is used to describe the background. Here for calculations of the energy dependent background an iterative procedure is applied taking as a first approximation for a curve, which continuously increases from zero to the maximal background value at .
In the case of a heterocontact between two metals the PC spectrum represents a sum of the contributions from both metals 1 and 2 weighted by the inverse Fermi velocity Shekhter83 :
| (7) |
where is the relative volume occupied by metal 1 in the PC. Thus, using of heterocontacts enables also, e. g., qualitative estimation of the relative strength of EPI in the investigated material as compared to some standard or well known one.
According to the BTK theory BTK82 of conductivity of N-c-S heterocontacts (here N is the normal metal, c is the constriction and S is the superconductor) a maximum at zero-bias voltage and a double-minimum structure at about e in the dd curves manifest the Andreev reflection processes at the N-S interface with a finite, so called, barrier strength parameter 0. The latter has a simple interpretation: it increases normal state resistance of the PC by a factor of (1+). Thus, as it was mentioned, the minima position in dd reflect roughly the SC gap value, which follows from the equations for the characteristics BTK82 :
| (8) | |||||
where f() is the Fermi distribution function. In general, characterizes reflection (or transmission) of the N-S interface, which is defined also by the mismatch of the Fermi velocity . Thus, even in the absence of a ”natural” barrier is non zero and is given by
| (9) |
The smearing of the experimental curves as compared to the calculated ones according to (8) is usually attributed to quasiparticle DOS N() broadening in the superconductor due to finite-lifetime. According to Dynes et al. Dynes78 it can be taken into account by adding an imaginary part to the energy , namely, is replaced by in (8). We used (8) to fit the measured dd curves of PCs and to extract the SC gap.
III Experimental results and discussion
III.1 PC spectroscopy of quasiparticle excitations

Figure 1 shows PC spectra of several YNi2B2C–Ag heterocontacts for which the SC gap has been measured simultaneously. We have selected the PC spectra for which the SC gap varies (see Fig. 4) gradually from the maximal value of 2.5 meV (upper spectrum) to the minimal one of 1.65 meV (bottom spectrum). However, no qualitative difference between PC EPI spectra is observed. The spectra show a dominant maximum at about 12 mV and a broad shallow maximum or hump centered around 50 mV (Fig. 1). These maxima correspond well to the phonon DOS maxima at 12 and 50 mV of YNi2B2C (see Fig. 2) obtained by neutron diffraction Gompf . At the same time the PC spectra do not contain contributions from the other phonon maxima at 20, 24, 32 mV and 100 mV observed in the phonon DOS. In this context we should mention that PC spectra of HoNi2B2C NaidSCES display mentioned phonon maxima near 20, 24, 32 mV. Contrary, the PC spectra of YNi2B2C above 12 mV is monotonic and almost featureless, except of the mentioned 50 mV feature. Of course, the increase of noise with the voltage hides details of the spectra at higher energies. Note also, that the spectra in Fig. 1 are measured in the normal state at 16 K where the resolution due to the Fermi level smearing is according to (5) about 8 meV which can mask fine features. However, as the upper insert in Fig. 1 shows, the spectrum measured at 4.5 K (solid curve) with the resolution of about 4 meV is similar to the other one (dashed curve) only it has a little bit sharper maximum at 12 mV. Even improving resolution below 3 mV (see Fig. 3) does not recover additional details of the spectra. It means that the instrumental broadening of the spectra does not play here a crucial role. In this respect we should note that according to recent data Reich the strong EPI gives rise to pronounced anomalies in the phonon dispersion curves of YNi2B2C and concurrently to large line widths of certain phonon modes. The latter along with selection of the large-angle scattering processes in PC can be responsible for the broad and less detailed (compared to PhDOS) structure in PC EPI spectra.
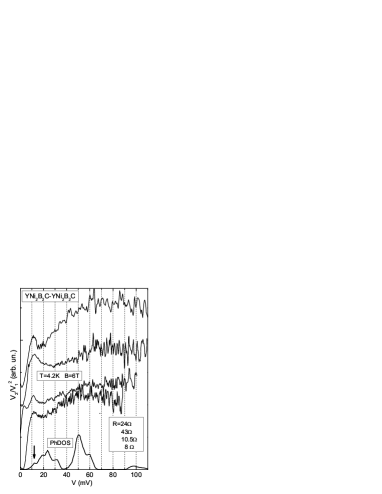
By interpreting the PC spectra of heterocontacts we have to take into account for possible contributions of the normal metal (e.g., Ag or Cu) used as a counter electrode. To avoid this we have measured PC spectra of homocontacts shown in Fig. 2. No qualitative difference in the spectra of homo and heterocontacts is seen (compare spectra in Figs. 1 and 2). Thus, the contribution of Ag or Cu in the presented PC spectra of heterocontacts (see, Fig. 1) is negligible. Apparently, low Fermi velocities in nickel borocarbides Muller ; Muller1 as compared to the noble metals accentuate the contribution of YNi2B2C in the PC spectra according to Eq. (7).
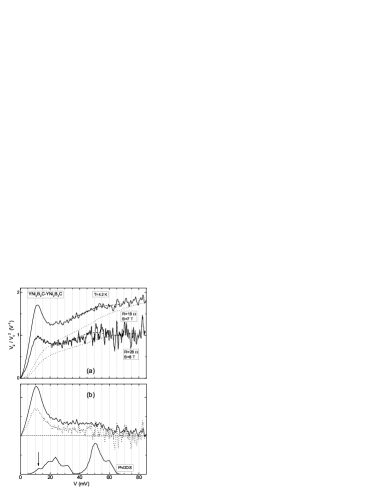
Fig. 3 displays the PC spectra of two homocontacts averaged for negative and positive polarity. Here also the behavior of the background obtained from (6) and the neutron phonon DOS are shown. According to neutron data Gompf there is a gap around 40 meV, which separates acoustic and optic phonon branches. In this energy region only a flattering occurs in our PC spectra after subtracting of the background. The main reason is that subtraction of the background for PC spectra with a high background level is not a straightforward procedure. Nevertheless, the PC spectra show two remarkable features – a maximum at about 12 mV and a hump around 50 mV. Similar PC EPI spectra of YNi2B2C were presented in Yanson0 ; Yanson1 . Here we only note that the measured normal state PC EPI spectra of YNi2B2C demonstrate no ”soft” modes around 4–5 mV discussed by Yanson et al. Yanson0 ; Yanson1 and noticed by Martinez-Samper et al. Martinez in STM spectra. Similar to ”soft” mode maxima are seen in the bottom spectrum in Fig. 1 and in the spectrum of 10.5 -contact in Fig. 2, but they can be attributed to superconductivity which is not fully suppressed in these contacts.
After subtracting the background from the measured PC spectra the EPI function is established according to Eq.(4) (see Fig. 3b) and the EPI parameter is calculated, which is found to be about 0.1. However, the calculation of from a PC spectrum is complicated for several reasons. First of all equation (4) is derived for a free electron model and a single band Fermi surface. Secondly, deviations from the ballistic regime in PC due to elastic scattering have to be corrected by a pre-factor in (4), where is the elastic electron mean free path and is the PC diameter. However, is difficult to evaluate for the PC. In this case only a qualitative estimation of is possible taking into account that contribution of Ag or Cu in the PC spectra of YNi2B2C–Ag/Cu heterocontacts in Fig. 1 (PC spectra of YNi2B2C–Cu heterocontact is shown in inset) is hardly to resolve. From the latter we can conclude that the intensity of the EPI function in YNi2B2C is at least larger than that in Cu, where 0.25 Naid . This provides an complementary confirmation of the moderate EPI in YNi2B2C with the lower limit of 0.25 for the 111By discussion of the value calculated from PC spectra we should always to bear in mind that is some kind of transport and it can be, in general, different from the thermodynamic one. Moreover, as we have discussed in the case of HoNi2B2C compound (Yu. G. Naidyuk et al., will be published) different bands can have different , while from PC spectra some average is calculated.. Note also that because the 12 mV-maximum prevails in the PC spectra, the main (about 90%) contribution to comes from the energy region below 35 meV corresponding to the low energy (acoustic) part of the phonon DOS. Calculation of EPI coupling in YNi2B2C revealed that about 70% of results from the nine lowest branches Reich .
No significant anisotropy of the PC EPI spectra in YNi2B2C was observed (see, e.g., Fig. 1). The main reason can be that the spectra are quite broad and smeared, what hides the fine structure of EPI, which might be anisotropic. However, isotropic behavior of the resistivity in YNi2B2C mentioned in Muller ; Muller1 is in line with almost isotropic PC spectra.
III.2 Directional PCS of the SC energy gap

As it was mentioned above the SC gap manifests itself in the characteristic of a N-c-S contact as minima around if 0 and a temperature is well below Tc. Such curves are presented in Fig. 4 for several contacts whose PC spectra are shown in Fig. 1. in Fig. 4 reflects also the distribution of the gap in YNi2B2C.
| (meV) | (meV) | Z | |
|---|---|---|---|
| Average | 2.2 | 0.64 | 0.5 |
| Minimal | 1.3 | 0.3 | 0.33 |
| Maximal | 3.3 | 2.3 | 0.69 |
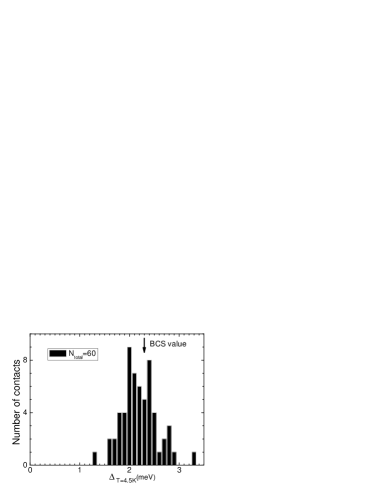
The gap distribution is also shown in Fig. 5 for a cleaved nonoriented rough YNi2B2C surface. The characteristic values of the fitting parameters are shown in Table I. The distribution in Fig. 5 is similar to that observed for YNi2B2C films Bashlakov . Different from the films is that the gap values in Fig. 5 stretched above 2.4 meV. Note, that the average gap is close to the BCS value of =1.762.3 meV. Interesting that using effective Fermi velocities in YNi2B2C in the range from 0.45 to 4.5 m/s drechsler01 within the two-band model Shulga and a typical Fermi velocity of Cu 1.57 m/s, the barrier parameter can be estimated according to (9) to be between 0.67 and 2.9 values, that is the lower value is close to the maximal Z from the Table I.
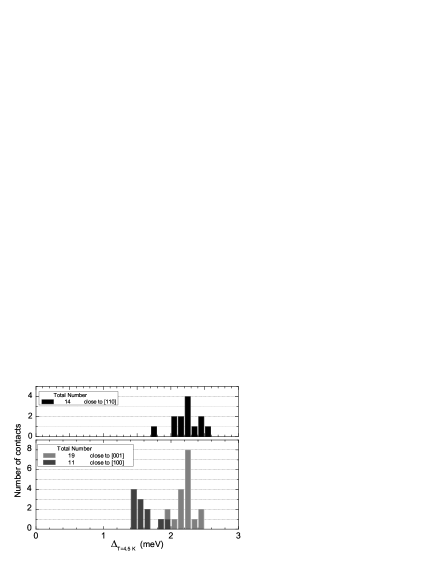
The gap distribution for different crystallographic orientations in YNi2B2C is shown in Fig. 6. The anisotropy in the distribution is clearly seen: a small gap is characteristic for the a-axis, while along the c-axis the gap is larger. Also the [110] direction has in average a slightly enhanced gap.
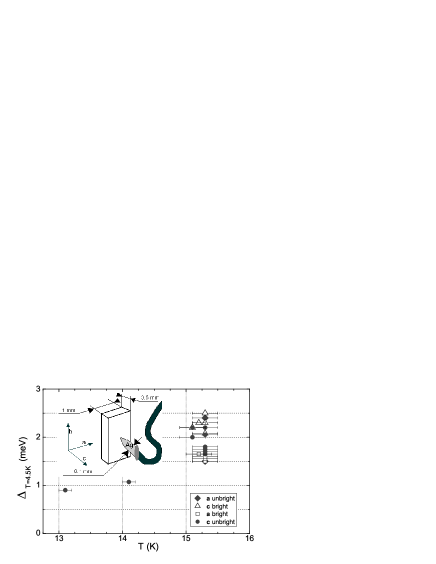
To exclude the gap variation due to surface degradation we have checked also the critical temperature of the gap vanishing for most of PCs. In Fig. 7 gap values for the a and c axis for the surface before polishing (marked by dark symbols) and after mechanical polishing and chemical etching (marked by bright symbols) are plotted against the critical temperature Tc of the PC. It is seen that for two PCs with low gap value of about 1 meV Tc is reduced as compared to the bulk one, therefore, a degradation of the SC state at the surface is likely responsible for the low gap value ( 1 meV) rather than an anisotropy of the gap. Contrary, different gap values for PCs with the same Tc shown in Fig. 7 gives unequivocal evidence of intrinsic reason of the gap variation.
It is noted that the derived gap values are fairly consistent with recent specific heat data Huang . Here it was shown that the two-gap model with =2.67 meV and 1.19 meV describe the SC gap function of YNi2B2C better than other models based on the isotropic s-wave, the d-wave line nodes, or the s+g wave approach. Furthermore, as it was shown in Bobrov two-gap fit better describes d/d curve of PCs in the sister compound LuNi2B2C.
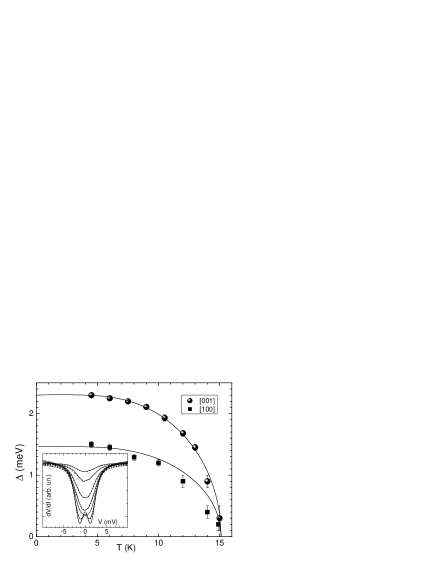
The temperature dependence of for two PCs with different gaps is shown in Fig. 8. It is seen that has in general BCS-type dependence. The gap is found to vanish close to the bulk Tc. However, the small gap deviates from the BCS curve by approaching Tc. Similar (small) gap behavior is characteristic for the well-known multiband (two-gap) superconductor MgB2 Szabo . Thus the mentioned observations of the gap behavior and distribution can be taken as support of two-gap scenario in YNi2B2C. At the same time as follows from recent ARPES experiments Yokoya , the momentum-dependent superconducting gap shows a large anisotropy ( meV) observed on a single FS. Also ultrahigh-resolution photoemission spectra Baba are better described by anisotropic s-wave gap in the form (meV). Therefore, the gap behavior in YNi2B2C is rather complex, showing both anisotropic and multiband superconductivity.
III.3 Magnetic field behavior of the SC energy gap and excess current
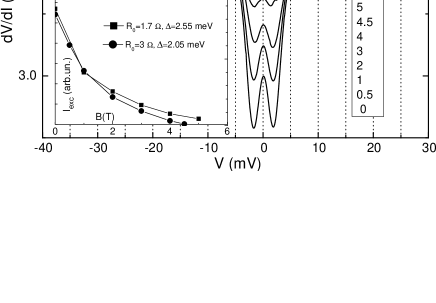
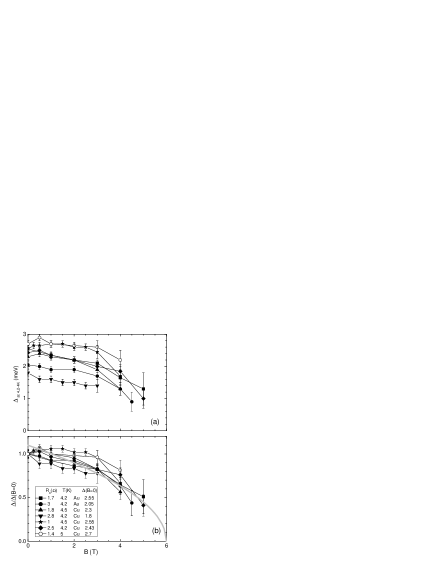
In Fig. 9 the field dependence of curves for a YNi2B2C–Au contact is shown. A remarkable suppression of the minimum in is observed for applied field above 3 T. This increases of the error in the determination of the value and makes calculations of less accurate, especially close to the critical field. The latter can be estimated of about 6 T from the SC features (minimum) disappearing in , that is it is close to the bulk critical field at helium temperature 4.5 K (see e. g. Shulga ). behavior extracted from the curves for this and several other contacts is shown in Fig. 10. In general, exhibits a conventional behavior decreasing with overall negative curvature. At the same time the excess current , which is roughly speaking proportional to the area of the gap minimum in (or more precisely to the area of the gap maximum in differential conductivity ), decreases with the magnetic field with a positive curvature (see Fig. 9 inset). Similar behavior we have recently reported for PC on YNi2B2C film Bashlakov and before a remarkable positive curvature in has been observed for the two-band superconductor MgB2 NaidyukF . As it was shown for the first time in Artemenko , the excess current of an S-c-N contact is governed by or SC order parameter Belob . Indeed, the temperature dependence of (not shown) is similar to the dependence, that is has a negative curvature, while does not. In NaidyukF the model was proposed that in the mixed state of type-II superconductor is proportional not only to , but also to the SC volume, outside vortices. The size of the contacts in Fig. 10 can be estimated from (3) in a few tens of nanometers, while coherence length in YNi2B2C is about 5–8 nm Muller ; Muller1 . Therefore a number of vortices can penetrate the PC area at a field approaching .
IV Conclusion
We have carried out investigations of the electron-phonon spectral function and the SC energy gap in YNi2B2C by PCS. We have measured PC EPI spectra of YNi2B2C in the normal state showing the dominant phonon maximum at about 12 meV along with hump or kink around 50 meV. Position of these features in the PC spectra corresponds to the maxima in the phonon DOS measured by neutron diffraction. However most of the phonon peaks are not resolved in the PC spectra. The reason can be weak contribution of some phonons into large-angle electron-phonon scattering in PC and/or large line widths of certain phonon modes. We did not found appreciable difference in the PC EPI spectra for PCs demonstrating different SC gap value, what may testify that the gap variation (anisotropy) is connected with the electronic structure.
The observed variation of the gap is such that the small gap (1.5 meV) is characteristic for the direction along the a-axis, while along the c-axis the gap is higher (2.3 meV) and similar or slightly larger gap is measured for the [110] direction. The directional variation along with the absence of marked anisotropy of PC EPI spectra can be an issue of complex multiband ground state in YNi2B2C. Multiband scenario for the SC state is also supported by the observation of the small gap and the excess current behavior for YNi2B2C similar as in the two-gap(band) superconductor MgB2.
Acknowledgements
The support of the Deutsche Forschungsgemeinschaft within SFB 463 ”Rare earth transition metal compounds: structure, magnetism and transport”, the U.S. Civilian Research and Development Foundation for the Independent States of the Former Soviet Union (grant no. UP1-2566-KH-03) and of the National Academy of Sciences of Ukraine are acknowledged. The investigations were carried out in part with the help of donated by A. von Humboldt Foundation (Germany) equipments.
References
- (1) R. J. Cava, H. Takagi, H. W. Zandbergen, J. J. Krajewski, W. F. Peck Jr., T. Siegrist, B. Batlogg, R. B. van Dover, R. J. Felder, K. Mizuhashi, J. O. Lee, H. Eisaki, S. Uchida, Nature 367 252 (1994).
- (2) R. Nagarajan, C. Mazumdar, Z. Hossain, S. K. Dhar, K. V. Gopalakrisnan, L. C. Gupta, C. Godart, B. D. Padalia, R. Vijayaraghavan, Phys. Rev. Lett. 72 (1994) 274.
- (3) K.-H. Müller, V. N. Narozhnyi, Rep. Prog. Phys. 64, 943 (2001).
- (4) K.-H. Müller, G. Fuchs, S.-L. Drechsler and V. N. Narozhnyi, in: Magnetic and Superconducting Properties of Rare Earth Borocarbides of the Type RNi2B2C, Handbook of Magnetic Materials, (Ed. K. H. J. Buschow), Elsevier North-Holland, Vol. 14, (2002), pp. 199-305.
- (5) S.-L. Drechsler, S. V. Shulga, K.-H. Müller, G. Fuchs, J. Freudenberger, G. Behr, H. Eschrig, L. Schultz, M. S. Golden, H. von Lips, J. Fink, V. N. Narozhnyi, H. Rosner, P. Zahn, A. Gladun, D. Lipp, A. Kreyssig, M. Loewenhaupt, K. Koepernik, K. Winzer, K. Krug, Physica C 317-318, 117 (1999).
- (6) K. Maki, P. Thalmeier, and H. Won, Phys. Rev. B 65, 140502 (2002).
- (7) K. Izawa, K. Kamata, Y. Nakajima, Y. Matsuda, T. Watanabe, M. Nohara, H. Takagi, P. Thalmeier, K. Maki, Phys. Rev. Lett. 89, 137006 (2002).
- (8) T. Park, E. E. M. Chia, M. B. Salamon, E. D. Bauer, I. Vekhter, J. D. Thompson, E. M. Choi, H. J. Kim, S.-I. Lee, P. C. Canfield, Phys. Rev. Lett. 92, 237002 (2004).
- (9) P. Martinez-Samper, H. Suderow, S. Vieira, J. P. Brison, N. Luchier, P. Lejay, and P. C. Canfield, Phys. Rev. B 67, 014526 (2003).
- (10) P. Raychaudhuri, D. Jaiswal-Nagar, Goutam Sheet, S. Ramakrishnan, and H. Takeya, Phys. Rev. Lett. 93, 156802 (2004).
- (11) S. Mukhopadhyay, Goutam Sheet, P. Raychaudhuri, H. Takeya, Phys. Rev. B 72, 014545 (2005).
- (12) D. L. Bashlakov, Yu. G. Naidyuk, I. K. Yanson, S. C. Wimbush, B. Holzapfel, G. Fuchs and S-L Drechsler, Supercond. Sci. Technol. 18, 1094 (2005).
- (13) T. Yokoya, T. Baba, S. Tsuda, T. Kiss, A. Chainani, S. Shin, T. Watanabe, M. Nohara, T. Hanaguri, H. Takagi, Y. Takano, H. Kito, J. Itoh, H. Harima, T. Oguchi, J. of Physics and Chemistry of Solids 67, 277 (2006).
- (14) C. L. Huang, J.-Y. Lin, C. P. Sun, T. K. Lee, J. D. Kim, E. M. Choi, S. I. Lee, and H. D. Yang, Phys. Rev. B 73, 012502 (2006).
- (15) S.-L. Drechsler, H. Rosner, I. Opahle, and H. Eschrig, Physica C 408, 104 (2004).
- (16) S.-L. Drechsler, I. Opahle, S. V. Shulga, H. Eschrig, G. Fuchs, K.-H. Müller, W. Löser, H. Bitterlich, G. Behr, and H. Rosner, Physica B 329, 1352 (2003).
- (17) S.-L. Drechsler, H. Rosner, S. V. Shulga, I. Opahle, H. Eschrig, J. Freudenberger, G. Fuchs, K. Nenkov, K.-H. Müller, H. Bitterlich, W. Löser, G. Behr, D. Lipp, and A. Gladun, Physica C 364-365 31 (2001).
- (18) Yu. G. Naidyuk and I.K. Yanson, Point-Contact Spectroscopy, Springer Series in Solid-State Sciences, Vol.145 (Springer Science+Business Media, Inc, 2005).
- (19) I. O. Kulik, A. N. Omelyanchouk, R. I. Shekhter, Fiz. Nizk. Temp. 3, 1543 (1977) [Sov. J. Low Temp. Phys. 3, 840 (1977)].
- (20) I. O. Kulik, Fiz. Nizk. Temp. 18, 450 (1992) [Sov. J. Low Temp. Phys. 18, 302 (1992)].
- (21) G. E. Blonder, M. Tinkham, T. M. Klapwijk, Phys. Rev. B 25, 4515 (1982).
- (22) L. F. Rybaltchenko, I. K. Yanson, A. G. M. Jansen, P. Mandal, P. Wyder, C. V. Tomy, D. McK Paul, Physica B 218, 189 (1996).
- (23) I. K. Yanson, V. V. Fisun, A. G. M. Jansen, P. Wyder, P. C. Canfield, B. K. Cho, C. V. Tomy and D. McK Paul, Phys. Rev. Lett. 78 935 (1997).
- (24) I. K. Yanson, V. V. Fisun, A. G. M. Jansen, P. Wyder, P. C. Canfield, B. K. Cho, C. V. Tomy, D. M. Paul, Fiz. Nizk. Temp. 23, 951 (1997) [ Low Temp. Phys. 23, 712 (1997)].
- (25) F. Gompf, W. Reichardt, H. Schober, B. Renker, M. Buchgeister, Phys. Rev. B 55, 9058 (1997).
- (26) Yu. G. Naidyuk, D. L. Bashlakov, I. K. Yanson, G. Fuchs, G. Behr, D. Souptel, and S.-L. Drechsler, to be published in Physica C (2007).
- (27) D. Souptel, G. Behr, W. Löser, K. Nenkov, G. Fuchs, J. of Crystal Growth, 275, e91 (2005).
- (28) A. Wexler, Proc. Phys. Soc. (London) 89, 927 (1966).
- (29) S. V. Shulga, S.-L. Drechsler, G. Fuchs, K.-H. Müller, K. Winzer, M. Heinecke, and K. Krug, Phys. Rev. Lett. 80, 1730–1733 (1998).
- (30) I. O. Kulik, Fiz. Nizk. Temp. 11, 937 (1985) [Sov. J. Low Temp. Phys. 11, 516 (1985)].
- (31) R. I. Shekhter and I. O. Kulik, Fiz. Nizk. Temp. 9, 46 (1983) [Sov. J. Low Temp. Phys. 9, 22 (1983)].
- (32) R. C. Dynes, V. Naraynamurti, J. P. Garno, Phys. Rev. Lett. 41, 1509 (1978).
- (33) Yu. G. Naidyuk, O. E. Kvitnitskaya, I. K. Yanson, G. Fuchs, K. Nenkov, S.-L. Drechsler, G. Behr, D. Souptel, K. Gloos, Physica B 359-361, 469 (2005).
- (34) W. Reichardt, R. Heid, and K. P. Bohnen, J. of Superconductivity, 18, 759 (2005).
- (35) N. L. Bobrov, S. I. Beloborod‘ko, L. V. Tyutrina, V. N. Chernobay, I. K. Yanson, D. G. Naugle and K. D. D. Rathnayaka, Fiz. Nizk. Temp. 32, 641 (2006) [Low Temp. Phys. 32, 489 (2006)].
- (36) P. Szabó, P. Samuely, J. Kačmarčik, T. Klein, J. Marcus, D. Fruchart, S. Miraglia, C. Marcenat, and A. G. M. Jansen, Phys. Rev. Lett. 87, 137005 (2001).
- (37) T. Baba, T. Yokoya, S. Tsuda, T. Kiss, T. Shimojima, S. Shina, T. Togashi, C. T. Chen, C. Q. Zhang, S. Watanabe, T. Watanabea, M. Nohara, H. Takagi, Physica B 378-380, 469 (2006).
- (38) Yu. G. Naidyuk, O. E. Kvitnitskaya, I. K. Yanson, S. Lee, and S. Tajima, Solid State Commun. 133, 363 (2005).
- (39) S. N. Artemenko, A. F. Volkov and A. V. Zaitsev, Solid State Communs. 30, 771 (1979).
- (40) S. I. Beloborod’ko, A. N. Omelyanchouk, Fiz. Nizk. Temp. 17, 994 (1991) [Sov. J. Low Temp. Phys. 17, 518 (1991)].