A repair strategy to the attacked random and scale-free networks
Abstract
With a simple attack and repair evolution model, we investigate the stability and structural changes of the Erdös-Rényi random graphs (RG) and Barabási-Albert scale-free (SF) networks. We introduce a new quantity, invulnerability , to describe the stability of the system. We find that both RG and SF networks can evolve to a stationary state. The stationary value has a power-law dependence on the repair probability . We also analyze the effects of the repair strategy to the attack tolerance of the networks. We observe that there is a threshold, , for the maximum degree. The maximum degree at time will be no smaller than . We give further information on the evolution of the networks by comparing the changes of the topological parameters, such as degree distribution , average degree , shortest path length , clustering coefficient , assortativity , under the initial and stationary states.
pacs:
89.75.Hc, 87.23.Kg, 89.75.FbI Introduction
Most of the systems in the real world can be represented as complex networks s1 ; s2 ; s3 ; s4 ; s5 ; s6 ; s7 ; s8 , in which the nodes are the elementary components of the system and the edges connect pair of nodes that mutually interact exchanging information. The existing empirical and theoretical results indicate that complex networks can be divided into two major classes based on their degree distribution s10 . The degree of a node is the number of links adjacent to the node and the degree distribution gives the probability that a node in the network is connected to other nodes. The first class of networks is characterized by Poisson degree distribution, such as Erdős and Rényi random graph s11 . It is constructed starting from an initial condition of nodes and then adding links with connection probability . The second class of networks is characterized by power-law degree distribution , such as Barabási and Albert scale-free network s12 . It starts from an initial condition of nodes and then, for each time step, evolves adding a new node with edges (growth) that is connected more likely to nodes with higher degree (preferential attachment).
Recently enormous interest has been devoted to study the robustness of complex networks under random failures or intentional attacks s13 ; s14 ; s15 ; s16 ; s17 ; s18 . By random failure we mean the removal of randomly selected network nodes and their edges. Instead, we call intentional attack the targeted removal of the most important nodes and their edges. The importance of a node can be determined by the degree, or the betweenness (the number of shortest paths that pass through the node), etc.
In this paper, the node with highest degree suffers attack. Since this node has highest connections to other nodes, it is most likely attacked and is the most vulnerable site in the network. The aim of this paper is to investigate and compare the stability of Erdős and Rényi random graph and Barabási and Albert scale-free network under the attack and repair strategy. At the same time, we will compare the effects of the attack and repair strategy to these two different topological structures. The paper is organized as follows. In Section II, we describe the evolution model of the attack and repair strategy. Simulation results are in the next section. In the conclusion, we formulate the main results of the paper.
II The attack and repair strategy
Our attack and repair strategy is simulated as follows. We start by constructing a network according to the algorithms of Erdős and Rényi random graph (RG) or Barabási and Albert scale-free network (SF). In RG, the network size is and the connection probability is . In SF networks, the initial and are both 2. The dynamics of our model is defined in terms of the following two operations.
-
(i)
Attack: Find a node with the maximum degree and remove all its links. (If several nodes happen to have the same highest degree of connection, we randomly choose one of them.)
-
(ii)
Repair: Reconnect this node with the other nodes in the network with probability . We assume that all information on the former links of the damaged nodes has been lost, the damaged nodes have be connected randomly to other nodes in the network again.
Then, the evolution comes into the next Monte Carlo time step. An issue should be mentioned here. Unlike previous attack model s12 the nodes damaged will not be removed from the network, instead they will be reconnected in certain way. In this way, we keep the size of the system constant.
III simulation results
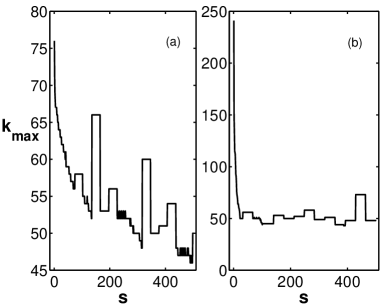
We have performed extensive numerical simulations to study the evolution of RG and SF networks under the attack and repair strategy. In Fig. 1, we give a snapshot of the maximum degree versus time step with nodes and repair probability . We find that of RG model decreases slowly with big fluctuations during the evolution. For SF model, decreases steeply at the beginning of the evolution and then slowly later. This behavior is rooted in their different topological structures. The RG network is a homogenous network and all nodes have approximately the same number of links. Thus the removal of each node causes the same amount of damage. The SF networks is an extremely inhomogeneous network, in which the minority of nodes have most of the links. The removal of these ’important’ nodes will have dramatic impact on the changes of .
Generally, the systems with larger have higher probability to be attacked. In order to evaluate the probability that the system is vulnerable, we introduce the concept, invulnerability, . Considering an evolution of network with maximum degrees , ,…, , invulnerability at time is defined as
| (1) |
According to Eq. (1), is a non-decreasing parameter, and helps filter out some fluctuations in .
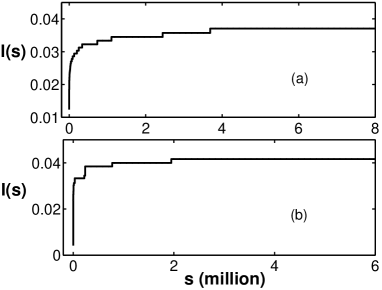
In Fig. 2 we plot the evolution of versus for RG and SF networks under and . We observe that in both networks increases very quickly at small but slowly at large and finally reaches a stationary value after taking a long transient period. The stationary value of the RG network is 0.037, while of the SF network is 0.042.
Additionally, we can see from Eq. (1) that the maximum degree of the network in the stationary state is
| (2) |
Since stationary value is the maximum of all the , at time will be no smaller than , that is, . For instance, under and , the repair strategy ensures the maximum degree of the RG network is no smaller than and the of the SF network is no smaller than . The introduction of the repair strategy ensures that of the attacked RG and SF networks are greater than 27 and 24 during the evolution, respectively. If without the repair strategy, all the links will be removed after about 5000 time steps for attacked RG model, 2000 time steps for attacked SF model.
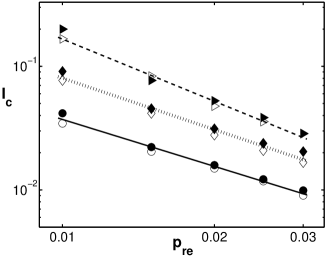
In order to understand the effects of the repair strategy to the stationary state of the system, we plot the stationary value as a function of the repair probability in log-log scale for RG networks (open symbols) and SF networks (filled symbols) with different network sizes. Triangles, diamonds and circles represent , and , respectively. We find that under fixed network size , the higher the repair probability is, the smaller the stationary value is. On the other hand, under the fixed , the larger is, the smaller is. In fact, has an inverse ratio to the product of and .
Figure 2 also tells that the stationary value has a power-law dependence on the repair probability ,
| (3) |
Under the same network size and repair probability , the stationary values of RG and SF networks are very similar, with of SF networks a little larger, thus more invulnerable.
By investigating the changes of the topological parameters of RG and SF networks at the initial and stationary states, we are trying to understand the effects of the repair strategy to the topological structures of these two different structural networks.
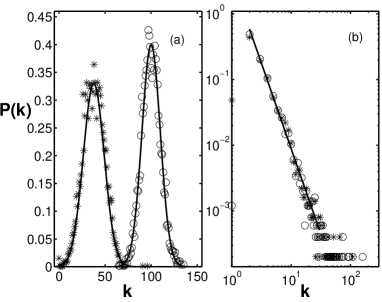
Degree distribution. Figure 4(a) and 4(b) display the degree distributions of RG and SF networks in the initial and stationary states under and . Figure 4(a) and 4(b) show that the shape of the degree distributions is almost the same for RG and SF networks in initial and stationary states. For RG networks, the degree distributions in the initial and stationary state are both Gaussian distributions, with the peak changes from 100 in the initial state to 38 in the stationary one. At the same time, the distribution of SF networks in the initial and stationary states are both power-law distribution, having the same exponent about 2.6. Figure 4 suggests that the general structures of the systems do not change even after a long time evolution to the stationary states.
Average degree. We find that the average degree of RG network in the stationary state decreases dramatically, while slightly for SF networks. This result is caused by the homogeneity of RG networks. Since in RG networks all nodes have approximately the same number of links, majority of nodes in the network will be impacted by the attacks and, hence, the rapid decrease of . The power-law topology of SF networks displays that is mainly determined by the nodes with small degrees, which are less influenced by attacks.
Shortest path length. The shortest path length is the average length of the shortest paths between any two nodes in the network. in the stationary states for RG and SF networks both increases. That is, the efficiency for the nodes in the network to communicate decreases under the attacks.
Clustering coefficient. The clustering coefficient of node is defined as the existing numbers among the links of node over all the possible links, that is, . The clustering coefficient of the whole network is the average over all the . The increase of clustering coefficient for RG networks in the stationary states means the nodes have the tendency to be highly clustered. In fact, the small shortest path length and large clustering coefficient suggest the RG network in the stationary states is more or less a small-world network. The clustering coefficient of SF networks decreases a little in the stationary states. It seems that few nodes with largest connections are attacked and have a big affect on the network, which makes the connections in the network becomes sparse, thus the clustering coefficient becomes decrease.
Assortativity. The assortativity in the range is another interesting feature of complex networks. A network is said to show assortative, , if the high-degree nodes in the network preferentially connect to other high-degree nodes. By contrast, a network is disassortative, , if the high-degree nodes tend to connect to other low-degree nodes. The increase of for RG networks in the stationary states are consistent with our conjecture that the networks becomes a little highly clustered. For SF networks, they are inhomogeneous in both initial and stationary states according to the analysis of the degree distribution above, so are both negative, that is disassortative.
| RG | SF | ||||
|---|---|---|---|---|---|
| initial | stationary | initial | stationary | ||
| — | 0.0149 | — | 0.0152 | ||
| 100.06 | 38.09 | 3.99 | 3.92 | ||
| 2.11 | 3.89 | 4.83 | 5.28 | ||
| 0.02 | 0.47 | 0.0068 | 0.0028 | ||
| 0.23 | 0.52 | -0.062 | -0.074 | ||
IV Conclusions
Summarily, in this paper we study the effects of the repair strategy to the attacked ER random graph model and BA scale-free model. We find the introduction of the repair strategy has significant effects on the attack tolerance of the networks. We also introduce a new quality, invulnerability , to describe the stability of the networks. After a long time evolution, the invulnerability of ER random graph model and BA scale-free model can both evolve to a stationary value . has a power-law dependence on the repair probability . In addition, the maximum degree in the stationary state is always smaller than the maximum degree at time , .
We give further information on the evolution of the networks by comparing the changes of the topological parameters, such as degree distribution , average degree , shortest path length , clustering coefficient and assortativity , between the initial and stationary states. We conclude that the topological structure of SF networks does not change during the evolution, while RG networks become small-world networks during the evolution, according to the small shortest path length and large clustering coefficient.
ACKNOWLEDGEMENTS
This work was supported by National Natural Science Foundation of China under Grant Nos. 70401020, 70571027 and 10647125.
References
- (1) S. Boccaletti, V. Latora, Y. Moreno, et al, Physics Reports 424 (2006) 175.
- (2) R.J. Williams and N.D. Martinez, Nature 404 (2000) 180.
- (3) W. Li and X. Cai X, Phys. Rev. E 69 (2004) 046106.
- (4) L.P. Chi, R. Wang, H. Su, et al, Chin. Phys. Lett. 20 (2003) 1393.
- (5) L.P. Chi and X. Cai, Int. J. Mod. Phys. B 18 (2004) 2394.
- (6) V. Latora and M. Marchiori, Physica A 314 (2002) 109.
- (7) R.F. Cancho and R.V. Solé, Proc. Natl. Acad. Sci. 100 (2003) 788.
- (8) Xiang Li and G. Chen, Physica A 328 (2003) 274.
- (9) R. Albert, H. Jeong and A.-L. Barabási, Nature 401 (1999) 130.
- (10) A.-L. Barabási and R. Albert, Science 286 (1999) 509.
- (11) P. Erdős and A. Rényi, Publ. Math. Inst. Hung. Acad. Sci. 5 (1960) 17.
- (12) R. Albert, H. Jeong and A.-L. Barabási, Nature 406 (2000) 378.
- (13) R. Albert and A.-L. Barabási, Rev. Mod. Phys. 74 (2002) 47.
- (14) M.E.J. Newman, Eur. Phys. J. B 38 (2004) 321.
- (15) L.P. Chi, C.B. Yang and X. Cai, Chin. Phys. Lett. 23 (2006) 263.
- (16) L.P. Chi, C.B. Yang, K. Ma and X. Cai, Commun. Theor. Phys. 45 (2006) 765.
- (17) P. Crucitti, V. Latora, M. Marchiori and A. Rapisarda, Physica A 340 (2004) 388.
- (18) P. Crucitti, V. Latora, M. Marchiori and A. Rapisarda, Physica A 320 (2003) 622.