Growth and Characterization of Bi2+xSr2-xCuO6+δ Single Crystals
Abstract
High-quality Bi2+xSr2-xCuO6+δ(0x0.5) single crystals have been grown successfully using the travelling-solvent floating-zone(TSFZ) technique. The samples with 0.05 are in the underdoped level. The structure of these crystals was investigated by X-ray diffraction. The evolution of c-axis lattice parameters with varied x is displayed, which is strongly associated with the behavior of . The crystals exhibit superconducting transitions with to K for the samples with to , while for samples with and above no superconductivity was discovered down to 1.6 K. The resistivity of samples with =0.31, 0.40 and 0.50 exhibits a drastic divergence as temperature approaches 0 K.
keywords:
A2. Travelling solvent zone growth, B2. Oxide superconducting materials, B1. Cuprates, B1. Bismuth compounds.PACS:
74.72.Hs, 74.62.Bf, 74.62.Dh1 Introduction
Since the high temperature superconductors(HTSCs) were discovered, there has been no consensus yet on the mechanism of the high superconductivity in these materials. Because of the complex structure and anomalous behavior in both superconducting and normal states, it is tempting to conclude that the Landau-Fermi liquid and BCS theories seem inapplicable to describe the physics in the normal and superconducting states. The single-layer copper-oxide superconductor Bi2+xSr2-xCuO6+δ(BSCO) is an ideal material for the research of mechanism of HTSCs. This system has a rather low K and a structure with Cu-O conducting layer and carrier reservoir which is similar to other cuprates [1, 2, 3, 4, 5, 6, 7, 8, 9, 10]. The advantage to conduct investigation on this system is that the upper critical field is rather low (about 25 T) and the superconductivity can be easily suppressed by applying a magnetic field [11, 12, 13], so both of the superconductivity and normal state characteristics can be investigated. In addition, the nature of the ground state of pseudogap is still highly debated [14], this system may provide a possible way to reach the ground state of the pseudogap phase[15]. Comparing to its brother system, the La-doped Bi-2201 namely (BSLCO) with identical structure but much higher ( 38 K ), the low of the present system was attributed to a greater out-of-plane disorder effect induced by a larger mismatch of the ionic radius between Sr2+ and Bi3+ than Sr2+ and La3+[16, 17, 21], but more experiments on good quality single crystals are required to clarify this point.
It was reported that the Bi-based Bi-2201 single crystal could be grown by the self-flux and KCl-solution-melt method[1, 2, 3, 4, 5, 6, 7]. However, large size crystals with high homogeneity and less contamination were still hard to obtain. On the other hand, the optical travelling-solvent floating-zone(TSFZ) method could overcome these drawbacks. As far as we know, only Lin et. al. have successfully grown the La-free bulk superconducting Bi2+xSr2-xCuO6+δ crystals from the non-stoichiometric starting composition of Bi2.2Sr1.9Cu1.2O6+δ and Bi2.35Sr1.98Cu1.0O6+δ by TSFZ method under oxygen pressure ( 2 bar) [8, 9, 10]. In this paper, we report the successful growth of large size Bi2+xSr2-xCuO6+δ single crystals with high quality by TSFZ method. The value in the starting composition is varied from 0 to 0.50. The crystals cleaved from the ingots with =0.04 0.20 exhibit superconductivity, it seems that the optimal doping point is at the nominal value of =0.05. Superconductivity has not been observed at =0.25 and above, and a much stronger low temperature up-turn of resistivity has been observed as is beyond 0.25. A strong correlation between -axis parameter and is found suggesting an influential effect on superconductivity by the subtle change of structure.
2 Experiment and Characterization
Before the crystal growth, a feed rod with high density is prepared. The polycrystalline material was prepared by an ordinary solid reaction method. The starting powders of Bi2O3(99.99 %), SrCO3(99.99%) and CuO(99.5%) with the same composition as the target proportion were mixed by hand in a dry agate mortar for about 4 hours and pressed into cylindrical rods of mm under hydrostatical pressure at 70 MPa, then calcined in a vertical molisili furnace at 780 oC for 36 hours under 1 atm atmosphere. The rods were crushed into powder to be ground again. This procedure was repeated for 4 times to ensure the homogeneity of the polycrystalline powder. At the last time, the feed rod was sintered at 850 oC for more than 36 h in order to get a higher density. No crucible was used throughout the whole process, so there was little contamination for the rods. In order to get higher density feed rod with sufficient oxygen content, the premelting was performed under oxygen pressure atm, and the moving speed of mirror stage was 25 30 mm/hr depending on values. After premelting, a homogeneous feed rod with 6 mm in diameter and 6090 mm in length was obtained .
Single crystal growth by the TSFZ method was performed at an optical floating-zone furnace equipped with four ellipsoidal mirrors which was produced by the Crystal Systems Corporation. A steep temperature gradient was obtained by using four 300 W halogen lamp as the heating source. The crystal growth was under an oxygen pressure in an enclosed quartz tube, two conditions of oxygen pressure )=2 atm and 6 atm were applied, and the O2 flowing rate was about 20 40 cc/min. The typical growth rate is about 0.50 mm/hr, which sometimes is varied between 0.40 mm/hr and 0.60 mm/hr in order to obtain a more stable floating-zone and larger crystals. The rotation rate is 25.0 28.0 rpm for the upper shaft and 14.0 17.0 rpm for the lower shaft in opposite directions.
In order to check the quality of crystals, the as-grown ingots were cleaved into many pieces of crystals. Then the single crystals selected under microscope were characterized by various techniques. The single crystal surface topography was examined by scanning electron microscopy (SEM, Hitachi S-4200), and the energy dispersive X-ray (EDX, Oxford-6566, installed in the S-4200 apparatus) analysis was used to determine the composition of the crystals. While the X-ray diffraction(XRD) of the crystals was carried out by a Mac- Science MXP18A-HF equipment with scan to see the crystalline quality of the samples. radiation of Cu target was used, and the continuous scanning range of 2 is from 5o to 80o. The splitting peaks at high degree angle indicated different wavelength effects between and radiation. Before crystal growth, XRD for the powder of polycrystal was also carried out to check the phase purity of starting materials. The c-axis lattice parameters were calculated from XRD patterns of the single crystals, the raw data of XRD was analyzed by PowderX software where the zero-shift and -elimination and other factors were taken into account [18, 19, 20]. The superconductivity of the crystals was measured with AC susceptibility and resistivity based on an Oxford cryogenic system Maglab-EXA-12 and a Quantum Design Physical Property Measurement System(PPMS). An alternating magnetic field Oe was applied perpendicular to the -plane at a frequency =333 Hz when the AC susceptibility measurement was undertaken with the zero-field-cooling(ZFC) method. The transition temperature () of the crystals was derived from AC susceptibility curve by the point where the real part of the susceptibility becomes flat. A four-probe Ohmic contact with low resistance () on -plane was used for the resistivity measurement , and the sweeping rate of temperature is about 2 K/min from 2 K to 300 K.
3 Results and discussion
3.1 Crystal growth
The crystal growth was performed under oxygen atmosphere enclosed by a quartz tube. At the initial stage of the heating, both of the feed rod and seed rod were set apart by a distance of a few mm, the lamp power was increased gradually until both ends of the feed rod and seed rod began to melt. Then the upper feed rod was moved downwards carefully until it touched the seed rod and formed the molten zone. The length and width of floating-zone were adjusted carefully so that its diameter was almost the same as that of the feed and seed rods(about 6 mm).
In order to get high quality single crystals, a stable floating-zone with proper volume should be sustained during the growth. The parameters such as the power of lamp, growth rate, rotation rate of shafts, pressure and flowing rate of oxygen should be carefully chosen. The volume of floating-zone could also be adjusted carefully by the downwards or upwards slow moving of the upper shaft. The length of floating-zone, namely the distance between the feed rod and seed rod, was sensitive to the power of lamps and thus a proper power of lamp was applied. It could be changed 0.1%0.5% to get the optimal length of floating-zone. While the width of floating-zone was sensitive to the moving speed of mirror stage, namely, the growth rate of crystals. Sometimes it was tuned ( 0.1mm/hr) in order to obtain a more stable floating-zone and larger crystals. At the same time, both of the upper and lower shafts were rotated in opposite directions, the rotation rates which determine the convex shape of solid-liquid interface could also be changed at a suitable range until the floating-zone was stable enough. Generally, the rotation rate of upper shaft was relatively faster to mix the liquid homogeneously, but the lower shaft was rotated at a lower rate to get a stable floating-zone and large size crystals. Furthermore, the pressure of oxygen could influence on the melting point of the feed rod and stability of floating-zone. Comparing the case between atm and =6 atm, we found no distinct effects on crystal structure and . However, for the same composition of starting material, larger flowing rate of would lead to little larger crystals but make the floating-zone more unstable, while higher pressure did not lead to larger thickness along c-axis of the crystals. This is slightly different from the previous reports[9, 10], and it will be discussed in the following.
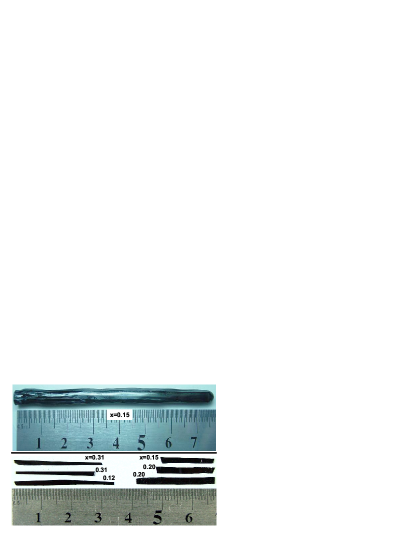
It is noteworthy that all growth parameters depend on starting compositions with different values, because the relative content of Bi2O3 influences the melting point of feed rod and the viscosity of the mixed liquid. To our experience, the properties of the crystal mostly depended on Bi content in the starting material and had little relation with oxygen pressure. For 0.10, large plate-like single crystals could be obtained easily, but for 00.10, the crystals became smaller and for there were only tiny needle-like crystals were obtained. In addition, for the too much higher and lower viscosity of compound with and (where Sr was more sufficient than Bi) respectively, the floating-zone collapsed frequently and the crystal growth was interrupted. This is similar to the observation reported in ref.[9, 10], while Lin et.al. only successfully obtained large single crystals from the non-stoichiometric starting composition when Bi content was more than 2.2. On the other hand, most of as-grown single crystals were in underdoped level. It could be attributed to the deficiency of oxygen content of the starting material, because we only sinter the feed rod in air instead of flowing oxygen and premelt the feed rod under oxygen pressure =2 atm. From our result, it seems not easy to change the oxygen content by changing the oxygen pressure during growth. For the same composition of starting material, crystals grown under =0.5 atm , =2 atm and =6 atm have almost the same features such as and size. So we suppose the crystals grown under the same condition have almost the same oxygen contents, and the x value has a simple linear relationship with the doping level where . One of the as-grown ingots with x=0.15 and several cleaved as-grown crystals with x=0.12, 0.15, 0.20 and 0.31 are showed in Fig.1. The crystals are sizeable and flat in large area which exhibit the high quality.
3.2 Composition and structure of the crystals
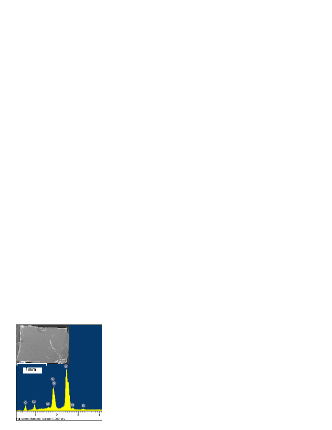
The crystal composition was examined by the energy dispersive X-ray (EDX) analysis. For each value, 35 pieces of as-grown single crystal were selected from the crystals cleaved from different parts of the as-grown ingot and taken EDX measurement. One of the typical EDX spectrums for =0.40 is shown in Fig.2. The crystal composition normalized to Sr=1.60 is Bi2.41Sr1.60Cu1.05O6.36. Note that the composition of oxygen is not precise as other elements because the EDX is not sensitive to light atoms. From the result, it can be seen that the crystal composition is close to the starting material and Cu has slightly more sufficient content than Cu=1. For other values, the results are similar to =0.40 except for =0.05 and 0.04 because of the inhomogeneity of those needle-like crystals. However, there is no remarkable difference between crystals grown under =2 and 6 atm. A brief summary of the properties of the single crystals grown under =2 atm is given in Table I.
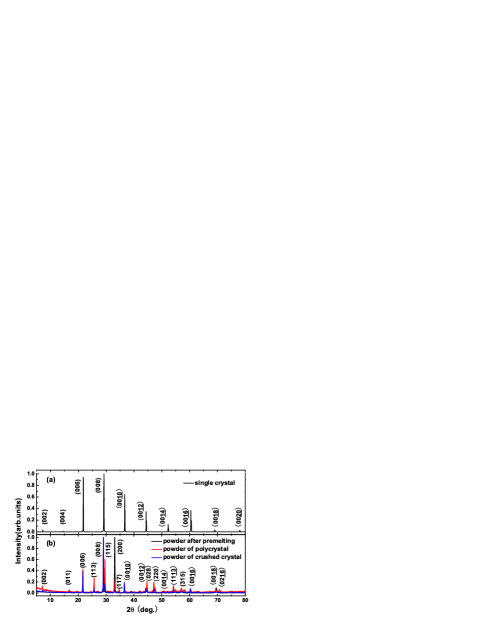
In order to examine the structure of our samples, XRD measurement was carried out. The typical single crystal XRD patterns are shown in Fig.3(a). Only sharp even peaks () along to -axis could be observed. The full-width-at-half-maximum(FWHM) of each peak is about 0.10∘ 0.12∘. The peaks are splitting at high degree angle due to different wavelength effects between and radiation.The powder XRD measurement for crushed BSCO crystals from the ingot was carried out to check for possible phase decomposition, and XRD for the polycrystal and starting material after premelting was also carried out before crystal growth. It is shown in Fig.3(b), all reflections could be indexed to the tetragonal structure. Comparing with the XRD patterns for the single crystal, it is found that the position of peaks from four sets of data coincide very well. This indicates that the phase composition was not changed throughout the whole process.
The c-axis lattice parameters were calculated from the XRD patterns of the single crystals, the raw data of XRD was analyzed by PowderX software where the zero-shift and -elimination and other factors were taken into account [18, 19, 20]. Some results were shown in Table I, and the x value dependence of -axis lattice parameters for the single crystals grown under =2 atm was shown in Fig.6(a). There is a subtle compression of the c-axis parameters when x increases from 0.20 to 0.31, and the c-axis parameters are almost constant when x 0.20 and x 0.31 respectively. This may be attributed to the substitution of Sr2+ (d=1.12 Å) and Bi3+ (d=0.96 Å), and also may have a little relation with the influence of monoclinic distortion and layer modulation. The major factors induced this behavior of c-axis should be carefully discussed, further experiments on TEM are proceeding to find them. The -axis is compressed slightly under the case with =6 atm, but the behavior of the c-axis parameters is similar to that shown in Fig.6(a).
Table I. A brief summary of the properties of the single crystals
grown under =2 atm:
The actual cationic compositions(Bi:Sr:Cu), ratio of Bi/Sr, critical temperature(), c-axis parameters and crystal-feature.
| x | |||||
|---|---|---|---|---|---|
| 0.10 | Needle-like | ||||
| 0.15 | Plate-like | ||||
| 0.20 | Plate-like | ||||
| 0.31 | Plate-like | ||||
| 0.40 | Plate-like | ||||
| 0.50 | Needle-like |
3.3 Superconductivity
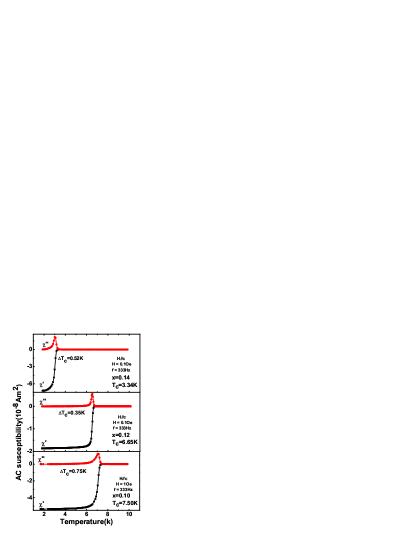
The AC susceptibility was measured on more than 20 pieces of crystals which were cleaved from different parts of the as-grown ingot for each value. Fig.4 shows three typical curves of the AC susceptibility for the crystals with =0.14, 0.12 and 0.10, the was defined as the point where the real part of the susceptibility becomes flat, namely, the onset point. The superconducting transition width(=(90%) - (10%)) of the crystals is very sharp, about 0.3 0.8 K. For the needle-like crystals, is more than 1.0 K. However, due to the strong anisotropy of bismuth based single crystals, it is almost impossible to obtain single-domain as-grown ingot[10, 22, 23]. Actually, the orientation of -axis was always perpendicular to the growth direction. The cleaved surface was always -plane, so the thickness of cleaved crystals was small. However, it was reported that higher pressure of oxygen lead to thicker and sizeable crystals[9, 10]. But by using 6 atm oxygen pressure during the growth, the size of crystals was not improved obviously, and the was increased less than 0.5 K compared with =2 atm. Actually, due to the random growth direction of crystals, the segregation always exists, this leads to the slightly difference of of different pieces cleaved from the same ingot. The curves of the AC susceptibility for all crystals cleaved from the same ingot were drawn together, and the for each value was determined by statistic method, that is, the average value for samples with close values.
As known for cuprate superconductors, post-annealing under different temperature and atmosphere could change the oxygen content, and thus the doping level as well as . But it seems not easy to change the of Bi-based phase Bi2210 by post annealing [5, 12, 26, 27]. The crystallinity becomes worse and phase segretion occurs in the annealing at a high temperature [27]. It was tried many times to change the oxygen contents by annealing in flowing oxygen and nitrogen. The annealing temperature was varied 20 ∘C each time from 400 to 600 ∘C, and sustained for more than 100 hours each time. But the curves of the AC susceptibility for the same crystal moved a little after annealing, the largest change was less than 0.5 K. Perhaps the proper annealing temperature is more than 600 ∘C, but some crystals with big x value melted already under 600∘C in 1 atm atmosphere. The x value dependence of was derived from high quality as-grown single crystal for each value, which has been shown in Table I and Fig.6(b).
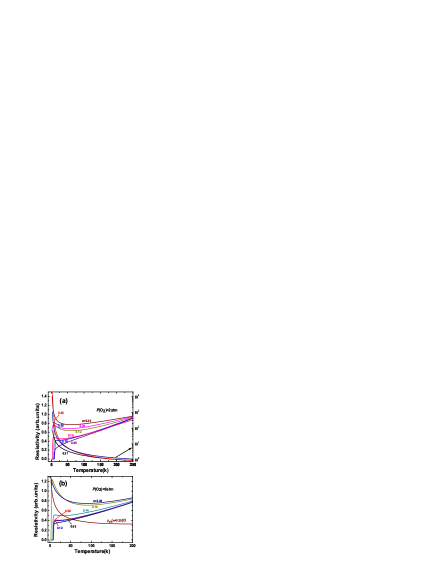
Fig.5 shows the resistivity of as-grown single crystals, where Fig. 5(a) and Fig. 5(b) show the resistivity of the single crystals grown under 2 atm and 6 atm pressure of oxygen, respectively. All resistivity curves were normalized by =280 K) in order to compare with each other. From Fig.5 we can see that most of the curves show underdoped behavior, except for =0.05 in Fig. 5(a), which shows overdoped feature. When the temperature is close to 0 K, the upturn of resistivity becomes more serious as value increases. The resistivity for =0.31, 0.40 and 0.50 samples which correspond to the right axis in Fig. 5(a) become drastically divergent when approaches 0 K. Moreover, the temperature dependance of the crystal resistivity under magnetic field up to 9 T was measured recently. A negative magnetoresistance effect was observed in the weak localized region of resistivity, which may be explained by the delocalization effects.[24, 25]
The evolution of with varied was shown in Fig.6(b), the values were derived by statistic method as described above. It is known that the hole doping decreases as value increases, thus the substitution of Sr2+ with Bi3+ enhances the electron doping and reduces the hole concentration. It is obvious that all samples with varied from 0.05 to 0.50 were in the underdoped region, this can be confirmed further by resistivity measurement. For the samples with =0.05 which is close to optimal doping level, varies in wider range in different parts of the same ingot. And for the samples with =0.04, the situation is similar to =0.05, but most samples are in the overdoped region. In addition, the of samples with =0.20 was derived by extrapolating the resistivity to zero at low temperatures, and for samples with 0.25, no superconductivity was observed down to 1.6 K. Fig. 6(b) shows the relation of vs. and it seems that a half dome shape emerges. While Fig. 6(a) shows the corresponding behavior of c-axis parameters. It is interesting to note that there is a strong correlation between and the c-axis parameters. The vanishing of superconductivity starts from the point where the contraction of c-axis occurs, which suggests that the superconductivity is strongly influenced by a subtle change of the structure.

4 Conclusions
High quality underdoped Bi2+xSr2-xCuO6+δ single crystals were successfully grown by TSFZ method. Higher pressure of oxygen during growth and post-annealing have little effects on the -axis parameters and . The superconductivity vanishes at =0.25, and the resistivity of crystals with 0.31 become drastically divergent with down to zero. There is a strong correlation between the c-axis parameters and suggesting a influence on superconductivity by a subtle change of the structure.
5 Acknowledgement
This work is supported by the National Science Foundation of
China, the Ministry of Science and Technology of China (973
project: 2006CB601000, 2006CB0L1002), the Knowledge Innovation
Project of Chinese Academy of Sciences (ITSNEM). The authors thank
the great helps from Prof. H.Chen and Prof. C.Dong for the XRD
measurement and data analysis, and thank the helpful discussion
with Prof. Y.Z.Zhang, Prof. L.Shan and Prof. R.Cong at IOP, CAS.
∗Email address of the corresponding author: hhwen@aphy.iphy.ac.cn
References
- [1] C. Michel, M.Hervieu, M.M.Borel, A.Grandin, F.Deslandes, J.Provost and B.Raveau, Z.Phys. B 68,421(1987);
- [2] L. F. Schneemeyer, R. B. van Dover, S. H. Glarum, S. A. Sunshine, R. M. Fleming, B. Batlogg, T. Siegrist, J. H. Marshall, J. V. Waszczak, L. W. Rupp, Nature 332,422(1988);
- [3] G.Xiao, M.Z.Cieplak and C.L.Chien, Phys.Rev.B 68, 11824 (1988);
- [4] R. M. Fleming, S.A.Sunshine, L.F.Schneemeyer, R.B.Van Dover, R.J.Cava, P.M.Marsh, J.V.Waszczak, S.H.Glarum S.M.Zahurak and F.J.DiSalvo, Physica C, 173 (1990)37;
- [5] K.Remschnig, J.M.Tarascon, R.Ramesh and G.W.Hull, Physcica C, 175 (1991)261;
- [6] J.I.Gorina, G.A.Kaljushnaia, V.I.Ktitorov, V.P.Martovitsky, V.V.Rodin, V.A.Stepanov and S.I.Vedeneev, Solid State Commun. 91, 615(1994);
- [7] T.Niinae, Y.Ikeda, Y.Bando, M.Takano, Y.Kusano, J.Takada, Physcica C, 313 (1999)29;
- [8] M. Matsumoto, J. Shirafuji, K. Kitahama, S. Kawai, I. Shigaki and Y. Kawate, Physcica C, 185-189 (1991)455;
- [9] C. T. Lin, B. Liang, M. Freiberg, K. Peters and E. Schnherr , Physcica C, 341-348 (2000)541;
- [10] B. Liang, A. Maljuk and C. T. Lin, Physcica C, 361 (2001)156;
- [11] M.S.Osofsky, et al., Phys.Rev.Lett 71, 2315(1993);
- [12] S.I.Vedeneev, A. G. M. Jansen, E. Haanappel, P. Wyder, Phys.Rev.B 60, 12467(1999);
- [13] F.Bouquet, L.Fruchter, I.Sfar, Z.Z.Li and H.Raffy, Cond-mat/0512093(2006);
- [14] A. Kanigel et al., Nature Physics 2, 447(2006)Letters;
- [15] Hai-Hu Wen, Lei Shan, Xiao-Gang Wen, Yue Wang, Hong Gao, Zhi-Yong Liu, Fang Zhou, Jiwu Xiong, and Wenxin Ti, Phys. Rev. B 72,134507(2005);
- [16] H. Eisaki, N. Kaneko, D. L. Feng, A. Damascelli, P. K. Mang, K. M. Shen, Z.-X. Shen, and M. Greven, Phys.Rev.B 69, 064512(2004);
- [17] K. Fujita, T. Noda, K. M. Kojima, H. Eisaki, and S. Uchida, Phys. Rev. Lett. 95, 097006(2005);
- [18] C. Dong, J. Appl. Cryst. (1999), 32, 838-838;
- [19] C. Dong, H. Chen and F. Wu, J. Appl. Cryst. (1999),32, 168-173;
- [20] C. Dong, F. Wu and H. Chen, J.Appl. Cryst. (1999), 32, 850-853;
- [21] A. Sugimoto, S. Kashiwaya, H. Eisaki, H. Kashiwaya, H. Tsuchiura, Y. Tanaka, K. Fujita, and S. Uchida, Phys. Rev.B 74, 094503(2006);
- [22] B.Liang and C.T.Lin, J.Crystal Growth, 267(2004)510;
- [23] B.Liang and C.T.Lin, J.Crystal Growth, 237-239(2004)756;
- [24] T.W.Jing, N.P.Ong, T.V.Ramakrishnan, J.M.Tarascon and K.Remschnig, Phys.Rev.Lett. 67,761(1991);
- [25] P.A.Lee and T.V.Ramakrishnan, Rev.Nod.Phys. 57, 287(1985);
- [26] S.I.Vedeneev and D.K.Maude, Phys.Rev.B 70, 184524(2004);
- [27] F.Sonder,B.Chakoumakos, and B.Sales, Phys.Rev.B 40, 6872(1989);