Intrinsic electronic superconducting phases
at 60 K and 90 K
in double-layer YBa2Cu3O6+δ
Abstract
We study superconducting transition temperature () of oxygen-doped double-layer high-temperature superconductors YBa2Cu3O6+δ (0 1) as a function of the oxygen dopant concentration () and planar hole-doping concentration (). We find that , while clearly influenced by the development of the chain ordering as seen in the plot, lies on a universal curve originating at the critical hole concentration () = 1/16 in the plot. Our analysis suggests that the universal behavior of () can be understood in terms of the competition and collaboration of chemical-phases and electronic-phases that exist in the system. We conclude that the global superconductivity behavior of YBa2Cu3O6+δ as a function of doping is electronically driven and dictated by pristine electronic phases at magic doping numbers that follow the hierarchical order based on , such as 2 , 3 and 4 . We find that there are at least two intrinsic electronic superconducting phases of = 60 K at 2 = 1/8 and = 90 K at 3 = 3/16.
pacs:
74.25.Fy, 74.25.Dw, 74.62.Dh, 74.72.BkIt has become clear in recent years that various physical properties of high temperature superconductors (HTS) are manifestations of a complex electronic texture of intrinsic electronic inhomogeneities due to dopants and, more importantly, electronic phase separation (EPS). In this report we show that the key to understand the underlying electronic texture and the corresponding superconducting properties are electronic phases that exist at magic planar doping concentrations (hole content per CuO2 plane, ) = /, where both and are positive integers with 4 and is determined based on a universal hole scale. Studies of the electronic phase diagram under ambient and high-pressure in cation (Sr) and anion (O) co-doped polycrystalline La2-xSrxCuO4+δ (CD-La214) revealed that there are two intrinsic electronic superconducting phases with superconducting transition temperature = 15 K and = 30 K. lor02 The far-infrared charge dynamics studies on the and phases indicated that they are very peculiar electronic phases which have very small amount ( 1 of total doped hole) of free holes moving in otherwise pinned two-dimensional (2D) electronic lattice. The and phases start at the critical “magic” planar hole-doping levels = 1/16 and = 1/8 = 2 , respectively. kim01 The existence and the clear competition of and phases observed in the pure cation (Sr)-doped polycrystalline La2-xSrxCuO4 (SrD-La214) indicated that, independent of the nature of the dopants, these intrinsic ’s phases are energetically favored electronic phases that exist in the CuO2 planes. hor02 Most recently magnetic studies of SrD-La214 single crystals confirmed the existence of the and transitions and the onset of the superconducting transition temperature were surprisingly robust with little field dependence up to 5 T. don06 These “2D square electronic lattices” formed at magic doping concentrations are the most fundamental building blocks of electronic states, the pristine electronic phase (hereafter PEP), for the understanding of both normal and superconducting properties of HTS. While three-dimensional ordered PEP’s seem to be firmly established in single-layer La214 system, don06 it is not clear how will PEP manifest themselves in other HTS. In this report we show that, indeed, in pure anion (O) doped double-layer YBa2Cu3O6+δ (OD-Y123) system there exist at least two intrinsic ’s of = 60 K and = 90 K that are based on PEP’s at = 2/16 = 2 and 3/16 = 3, respectively. Furthermore we find that the famous “60 K-plateau” in the electronic phase diagram of OD-Y123 can be naturally explained by the EPS of PEP’s
In order to sort out the PEP’s in OD-Y123 system we need to take care of the complications due to sensitive dependences of on both the amount and arrangement of oxygen dopants. jor90 ; vea90 The oxygen dopants tend to form long Cu-O chain ordering along -axis that results in energetically favored meta-stable superstructures consisting of alternative arrangements of full Cu-O chain (full-chain) and O-vacancy chain (empty-chain). and99 It was proposed that there are, starting from complete full-chain-ordering ortho-I phase, ortho-II (-II), -III (-III∗) and -IV (-IV∗) chemical phases will have single, double and triple full-chains (empty-chains) between any two empty-chains (full-chains), respectively. and99 It is well known that in the phase diagram of OD-Y123 there are two prominent plateaus located at 60 K (60K-plateau) and 90 K (90K-plateau). It was generally assumed that 60 K and 90 K phases corresponded to the ortho-II and ortho-I chemical phases, respectively. pou91 ; cal97 There were two possible origins of 60K-plateau proposed: one is the chemical phase separation bey89 and the other is purely electronic in origin. seg01 Recent theoretical study indicated that chemical phase arguments based on chain ordering alone can not account for the observed 60K-plateau. In stead, a chain-ordering induced charge imbalance model was used to account for the 60K-plateau. zal06 The electronic scenario attributed 60K-plateau to the well-known 1/8 anomaly identified in the SrD-La214. ako98 However the analysis was, unfortunately, based on a questionable planar hole scale. obe92 ; kni99 ; hon04 The problem concerning the origin of the = 60 K and 90 K phases and the associated plateaus in OD-Y123 are still unresolved. In this report we show that the electronic phase diagram of OD-Y123 can be understood in terms of the competition and the collaboration among the chemical phases and the PEP’s.
A universal hole scale based on the thermoelectric power at 290 K () was constructed and used for comparing various physical properties in HTS. hon04 It was shown that both normal and superconducting properties can be compared consistently with systematic doping dependences among different HTS. hon04 ; hon06 We analyze the reported () data of OD-Y123 as a function of determined by the universal scale. We find that () lies on one universal curve originating at the critical hole concentration = 1/16, while () lies on several curves which strongly depend on the development of the chain ordering. Further, we also find that the robust 60K- and 90K-plateaus appear at 1/8 = 2 and 3/16 = 3, respectively and the superconductivity is always suppressed beyond = 1/4 = 4. We extracted the data from the published paper, irrespective of the definition of . jor90 ; ako98 ; san03 ; san05 ; bfi93 ; ifi94 ; naq05 ; wan01 ; lia98 ; seg01 ; lia02 ; san04 ; pop97 ; lee05 A sample’s was directly determined from the reported data by using the universal scale. ako98 ; obe92 ; san05 ; bfi93 ; ifi94 ; naq05 ; wan01 ; seg01 ; ous90 ; pop97 ; lee05 For samples with either or reported but not , the of the sample were determined from the or the relation as discussed below. san03 ; lia98 ; lia02 ; san04 ; uem89 ; pum90 ; zim95
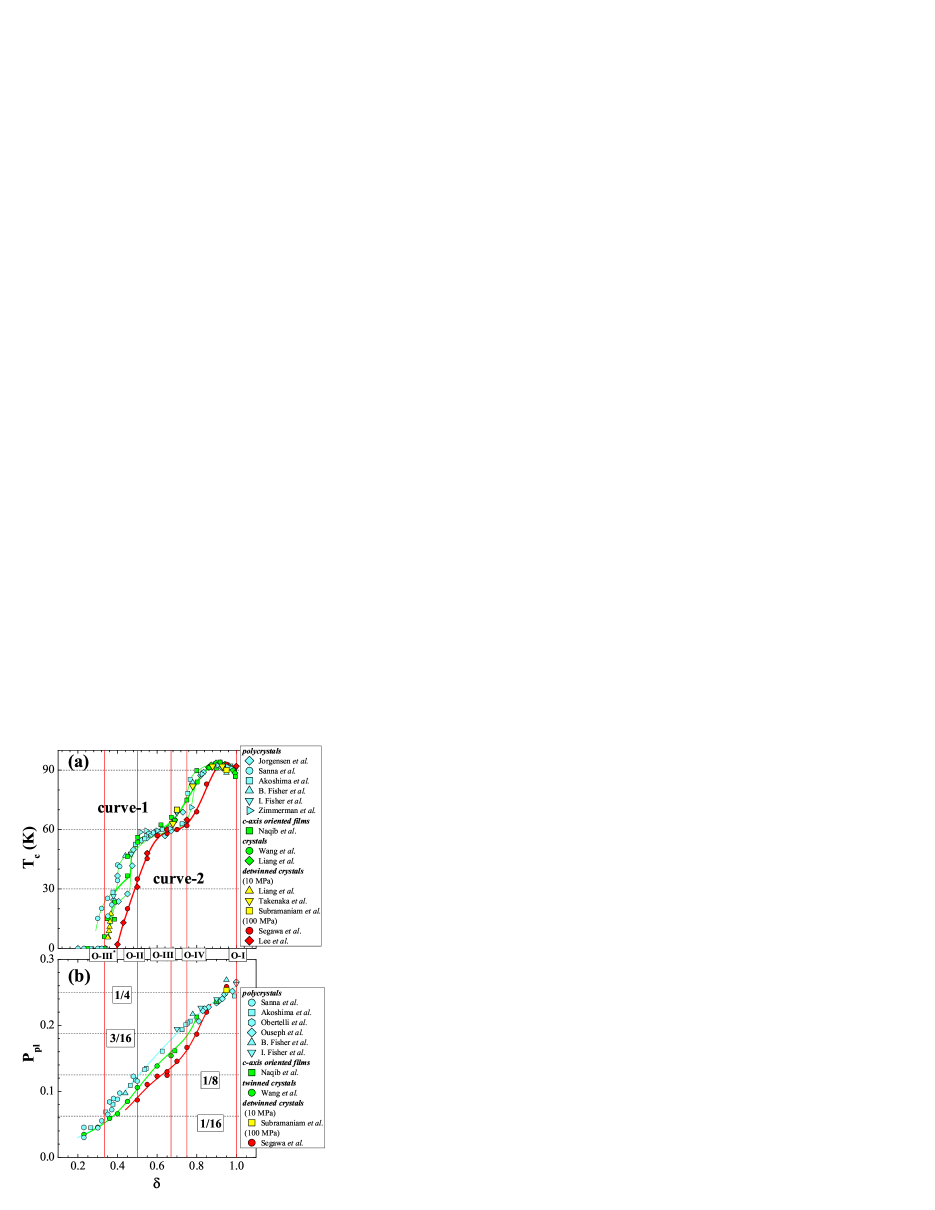
In figure 1(a) we plot for OD-Y123. The () behavior can be roughly separated into two curves with small loop structures for 0.47 and 0.7 0.8. Curve-1 is () behavior corresponding to the polycrystals, jor90 ; ako98 ; san03 ; bfi93 ; ifi94 crystals wan01 ; lia98 ; lia02 and -axis oriented films. naq05 Curve-2 is () behavior as observed in the crystals detwinned by a uniaxial pressure of 100 MPa seg01 ; lee05 applied along ()-axis. For all the curve-1 samples, the appears at 0.35, reaches the 60K-plateau for 0.47 0.65 and reaches the 90K-plateau for 0.82 0.92. Finally, the slightly decreases for 0.92. For the curve-2 samples, the appears at 0.4, exhibits the 60K-plateau at 0.6 0.75 and reaches the 90K-plateau at 0.9. The ()-curve of the detwinned crystals is lower than that of the curve-1 samples. However, the ()-curve of crystals detwinned by the uniaxial pressure of 10 MPa lia02 ; sub95 ; tak94 follows that of the curve-1 samples. This indicates that the artificially prepared very long chain ordering actually suppresses the superconductivity. All of above are intrisically consistent with the facts that the PEP’s are 2D square lattice. Furthermore the report that the highest in La2-xMxCuO4 (M = Nd, Ca, Sr) system is always observed in the tetragonal phase with flat and square CuO2 planes is also consistent with the above picture. dab96 Clearly superconductivity of OD-Y123 is greatly affected by the level of the chain ordering and no systematic universal behavior can be inferred from the phase diagram depicted in figure 1(a).
We plot in figure 1(b). Starting from 0.35 where 1/16 = , the () curve separated into three curves that merge into a common curve for 0.85, where 2/9. The upper, middle and lower curves are determined from the of polycrystals, ako98 ; obe92 ; san05 ; bfi93 ; ifi94 ; ous90 the in-plane of twinned crystals including -axis oriented films, naq05 ; wan01 and the measured along -axis () of crystals detwinned by the uniaxial pressure of 100 MPa, seg01 respectively. increases monotonically with oxygen doping. The continuous increase in is not consistent with the chemical phase separation. vea91 The common curve for 0.85 suggests, in contrast to the charge imbalance model,zal06 that chain ordering has no influences on hole concentration in the CuO2 planes. Accordingly, the scale in ref. hon04, can also be used for 0.85 in OD-Y123. In the -range from 0.35 to 0.85, the planar hole concentration at the same values is successively suppressed in the order of the polycrystals, twinned crystals and detwinned crystals with increasing length of chain ordering. Therefore, in contrast to the common belief, the perfect chemical phase with long chains does not favor the electronic state of HTS. Hereafter, if we only know the value of in the OD-Y123, we estimate the for the polycrystals, twinned crystals and artificially detwinned crystals from the corresponding curve of plot in Fig. 1(b)
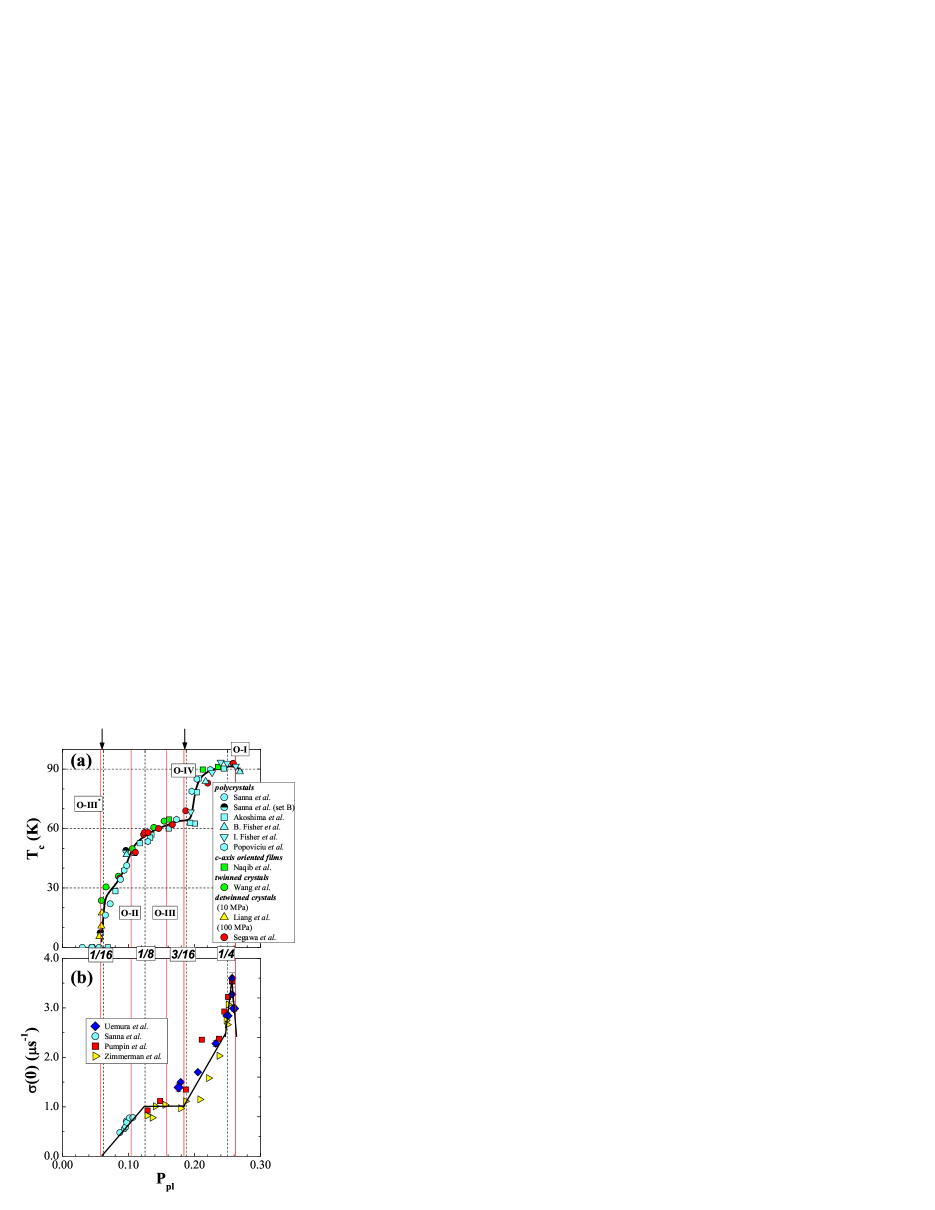
In figure 2(a) we plot for OD-Y123. ako98 ; san05 ; bfi93 ; ifi94 ; naq05 ; wan01 ; lia98 ; seg01 ; san04 ; pop97 ; lee05 Surprisingly, data of all samples collapsed into a single universal curve in the plot. The superconductivity appeared at 0.06 ( ) that exhibits an extremely sharp -jump to 30 K followed by a broad increase to 60 K at 0.1. The 60K-plateau is observed between 0.12 ( 2) 0.19 ( 3). Further, the suddenly jumps to 90 K over 0.19 ( 3) and goes into the 90K-plateau for 0.21 0.25 ( 4). Finally, the decreases for 0.25 ( 4). The phase diagram is characterized by fast -jumps and much flatter regions in between. Noted that the sharp -jumps occurred whenever the of a chemical phase is almost identical to that of a PEP (See two arrows in Fig. 2(a)). In contrast, the broad -increase at 1/8 seems to come from the mismatch between the of chemical phases to 2. The above observations suggest that the global behavior of the electronic phase diagram is dictated by the EPS of PEP’s under the influences of chemical phases: the jump in is due to the matching of a PEP and a chemical phase and the flat region is a two PEP’s region. There are some fine structures in the plot; a “hint” of a 30 K intrinsic phase and a 30K-plateau around = and a small -jump to 45 K occurred when ortho-II matched with magic doping concentration at 1/9. It is also interesting to note that the intrinsic ’s increase as integer multiples of 30 K in the double-layer OD-Y123 in contrast to that of 15 K in the single-layer La214 system.
The above EPS picture for the 60K-plateau is further collaborated by the observation of a clear plateau of another intrinsic property, the superfluid density (), of a superconductor in the same two phase region. We used estimated from the low temperature muon-spin relaxation (SR) rate (0). In Fig. 2(b), we plotted (0) . san04 ; uem89 ; pum90 ; zim95 While there is a slight scattering in the magnitude among the reported (0), each reported (0) data set have similar -dependence. The linearly increases with doping for 1/16 () 1/8 (2) followed by a clear plateau for 1/8 (2) 3/16 (3). It then linearly increases for 3/16 (3) 1/4 (4) again, and ends with a sharp peak at 1/4 (4). Finally, the rapidly decreases for 1/4 (4). Therefore, in superfluid density plot, there is also a flat two-phase region bounded by =1/8 and 3/16, consistent with the co-existence of two PEP’s of 2 and 3. It is interesting to point out that the famous linear plot, the Uemura plot, failed to reveal the two phase region. uem89 Therefore in order to have a physically meaningful comparison of various physical properties of HTS, it is of critical importance that the physical properties should always be plotted in terms of determined by the universal hole-scale. hon04
In summary, we have examined both the electronic-phase and chemical-phase diagrams of double-layer high temperature superconductors YBa2Cu3O6+δ as a function of the hole content per CuO2 plane and oxygen doping concentration , respectively. The (), irregardless of the sample quality, is a universal curve originating at = 1/16. The 60K-plateau, -jump and 90K-plateau occur at a series hierarchical doping concentration based on such as = 2, 3 and 4. Our analysis suggests that the electronic phase diagram of can be understood, although modified by the chemical phases, in term of the existence and the EPS of PEP’s. We conclude that there are at least two PEP’s with = 60 K at = 2 = 1/8 and = 90 K at = 3 = 3/16. Beyond = 4 =1/4, the superconductivity, such as and , is always suppressed. The observation of superconducting transitions at magic doping levels in the double-layer OD-Y123 and single-layer La-214 strongly suggest that the PEP’s are generic intrinsic properties of all high temperature superconductors.
One of us (T.H.) would like to thank Dr. M. Tanimoto of Asahikawa Medical College for offering convincement for study. This work was supported by the state of Texas through the Texas Center for Superconductivity at the University of Houston.
References
- (1) B. Lorenz, Z.G. Li, T. Honma, P.H. Hor, Phys. Rev. B 65, 144522 (2002).
- (2) Y.H. Kim and P.H. Hor, Mod. Phys. Lett. B 15, 497 (2001).
- (3) P.H. Hor and Y.H. Kim, J. Phys.: Condens. Matter. 14, 10377 (2002).
- (4) X.L. Dong, P.H. Hor, F. Zhou and Z.-X. Zhao, cond-mat/0610864.
- (5) J.D. Jorgensen ., Phys. Rev. B 41, 1863 (1990).
- (6) B.W. Veal ., Phys. Rev. B 42, 6305 (1990).
- (7) N.H. Andersen ., Physica (Amsterdam) 317-318C, 259 (1999).
- (8) H.F. Poulsen , Nature 349, 594 (1991); T. Zeiske , Nature 353, 542 (1991).
- (9) G. Calestani , IL Nuovo Cimento 19, 1075 (1997).
- (10) R. Beyers ., Nature 340, 619 (1989).
- (11) K. Segawa and Y. Ando, Phys. Rev. Lett. 86, 4907 (2001); J. Low Temp. Phys. 131, 821 (2003).
- (12) T.A. Zaleski and T. K. Kopec, Phys. Rev. B 74, 014504 (2006).
- (13) M. Akoshima and Y. Koike, J. Phys. Sos. Jpn. 67, 3653 (1998).
- (14) S.D. Obertelli, J.R. Cooper and J.L. Tallon, Phys. Rev. B 46, 14928 (1992).
- (15) A. Knizhnik ., Physica (Amsterdam) 321C, 199 (1999).
- (16) T. Honma, P.H. Hor, H.H. Hsieh and M. Tanimoto, Phys. Rev. B 70, 214517 (2004).
- (17) T. Honma and P.H. Hor, Supercond. Sci. Technol. 19, 907 (2006)
- (18) S. Sanna, G. Allodi, G. Concas and R.De Renzi, J. Supercond. 18, 769 (2005).
- (19) S. Sanna ., Phys. Rev. Lett. 93, 207001 (2004).
- (20) S. Sanna, G. Allodi, G. Concas and R.De Renzi, Solid State Commun. 126, 85(2003).
- (21) R. Liang, D.A. Bonn and W.N. Hardy, Physica (Amsterdam) 304C, 105 (1998).
- (22) R. Liang ., Physica (Amsterdam) 383C, 1 (2002); R. Liang, D.A. Bonn and W.N. Hardy, Phys. Rev. B 73, 180505(R) (2006).
- (23) B. Fisher ., Phys. Rev. B 47, 6054 (1993).
- (24) I.R. Fisher , Physica (Amsterdam) 235-240C, 1497 (1994).
- (25) S.H. Naqib and A. Semwal, Physica (Amsterdam) 425C, 14 (2005).
- (26) Y. Wang and N.P. Ong, Proc. Nat. Acad. Sci. U.S.A., 98, 11091 (2001); cond-mat/0110215v1.
- (27) Y.S. Lee, K. Segawa, Y. Ando and D.N. Basov, Phys. Rev. Lett. 94, 137004 (2005).
- (28) C.P. Popoviciu and J.L. Cohn, Phys. Rev. B 55, 3155 (1997).
- (29) P.J. Ouseph and M.R. OBryan, Phys. Rev. B 41, 4123 (1990).
- (30) Y.J. Uemura , Phys. Rev. Lett. 62, 2317 (1989); Phys. Rev. B 38, 909 (1988).
- (31) B. Pümpin , Hyperfine Interactions 63, 25 (1990)
- (32) P. Zimmermann , Phys. Rev. B 52, 541 (1995).
- (33) B. Dabrowski , Phys. Rev. Lett. 76, 1348 (1996).
- (34) J.L. Tallon ., Phys. Rev. B 51, 12911 (1995).
- (35) B.W. Veal and A.P. Paulikas, Physica (Amsterdam) 184C, 321 (1991).
- (36) C.K. Subramaniam, H.J. Trodahl, A.B. Kaiser and B.J. Ruck, Phys. Rev. B 51, 3116 (1995).
- (37) K. Takenaka, K. Mizuhashi, H. Takagi and S. Uchida, Phys. Rev. B 50, 6534 (1994).