Present address: ]Chemical Physics Program, Institute for Physical Science and Technology, University of Maryland, College Park, MD 20742.
Phase Relations in the Li2O-V2O3-V2O5 System at 700 ∘C: Correlations with Magnetic Defect Concentration in Heavy Fermion LiV2O4
Abstract
The phase relations in the -- ternary system at 700 ∘C for compositions in equilibrium with are reported. This study clarified the synthesis conditions under which low and high magnetic defect concentrations can be obtained within the spinel structure of . We confirmed that the phase can be obtained containing low (0.006 mol%) to high ( 0.83 mol%) magnetic defect concentrations and with consistently high magnetic defect spin values between 3 and 6.5. The high values were obtained in the phase in equilibrium with , , or and the low values in the phase in equilibrium with . A model is suggested to explain this correlation.
I Introduction
Heavy fermion (HF) behavior has mostly been seen in f-electron metals. Such compounds are called heavy fermions because in these materials the current carriers behave as if they have a large mass ( 102– times the free electron mass). , first synthesized by Reuter and Jaskowsky,reuter is one of the few -electron compounds to show HF behaviour at low temperatures.Kondo1997 ; Johnston2000 has the face-centered-cubic spinel structure with the space group Fdm. The V atoms are coordinated by six O atoms in slightly distorted octahedron. The Li atoms are coordinated with four O atoms in a tetrahedron. The Li atoms are located in the gaps between chains of the edge-sharing octahedra. From NMR measurements done on samples it has been found that for magnetically pure samples the 7Li nuclear spin-lattice relaxation rate is proportional to temperature T at low temperatures (the Korringa law) which is typical for Fermi liquids.Kondo1997 ; Mahajan1998 ; Fujiwara2004 However for samples which contain magnetic defects within the spinel structure, the relaxation rate has a peak at K and also shows other signatures which do not agree with the behavior of Fermi liquids.Johnston2005 The occurrence of magnetic defects is easily seen as a low- Curie-like upturn in the magnetic susceptibility rather than becoming nearly independant of below 10 K as observed for the intrinsic behavior.Kondo1999 The mechanism for the formation of the magnetic defects is not known yet.
Previously, polycrystalline samples of had been prepared from the starting materials , and at 700 ∘C. Typically, the samples contain a concentration of magnetic defects defect within the structure of the spinel phase, ranging from 0.01 to 0.7 mol%.Kondo1999 Magnetization versus applied magnetic field measurements at low were carried out to estimate and the defect spin defect. Low concentrations of defects were found in samples of containing small amounts of impurity phase while high defect concentrations were found in samples containing impurity phase.Kondo1999 Though the reason behind this correlation is not known yet, these results pointed towards a controllable way to vary the magnetic defect concentration within the spinel structure. However, it was not clear that the above-noted and impurity phases were in equilibrium with the spinel phase at 700 ∘C. In addition, it was unknown (in Ref. [7]) how the magnetic defect concentration in the spinel phase varied if other impurity phases were present. To help resolve these questions, we report here the phase relations in the –– system at 700 ∘C, in the vicinity of the composition , and report the magnetic properties of a selection of such compositions.
There have been some studies of the – system which revealed the existence of three phases in the system, namely , and . Reisman et al.Reisman reported the existence of the congruently melting phases (reported as ) and (reported as ) with melting points 616 ∘C and 1152 ∘C, respectively. has been reported to be both congruently melting and incongruently melting.Kohmuller ; Reisman ; Wickham Manthiram et al.manthiram reported that Li1-xVO2 is single phase in the compositional range at 650 ∘C. was reported to exist in equilibrium with the compounds and Li1-xVO2 from room temperature to 1000 ∘C by Goodenough et al.goodenough The lithium vanadium oxide system LixV2O5, also known as the lithium vanadium bronze phase, was reported to exist in a number of single-phase regions for and temperature 500 ∘C.Murphy
The – binary system has been extensively studied and a large number of phases have been reported. Hoschek and KlemmHoschek1939 first studied the system and suggested the presence of the phase , the -phase (–), the -phase (–), and the -phase (–). AnderssonAnderssonG reported phases with general formula VnO2n-1 with 3 . Additional phases reported in this system are and Kuwamoto . The phases with general formula VnO2n-1 with 3 are called the Magnéli phases.Magneli The triclinic structure of the Magnéli phases have been reported.AnderssonG ; AnderssonS ; Horiuchi ; Kuwamoto The other V-O phases existing between and are Aebi ; AnderssonG Wilhelmi and .Tudo ; Kosuge Combined with the work by Kachi and Roykachi , KosugeKosuge proposed a phase diagram of the - system in the temperature-composition plane extending from room temperature to 1200 ∘C showing high melting points ( ∘C) for V-O phases existing between and , low melting points ( ∘C) for V-O phases existing between and and also the homogeneity ranges of all the phases existing between and .
II experimental details
Our samples were prepared by conventional solid state reaction as described by Kondo et al.Kondo1999 The starting materials were (99.995%, Alfa Aesar), (99.995%, M V Laboratories Inc.) and (99.999%, M V Laboratories Inc.). The samples were made in two stages. First a (Li2O)x(V2O5)y precursor was made by thoroughly mixing appropriate amounts of and , pressing into a pellet and then heating in a tube furnace under oxygen flow at 525 ∘C until the expected weight loss occured due to the loss of from . The precursor pellet was then crushed and the appropriate amount of was added and mixed thoroughly inside a helium-filled glove box. The precursor- mixture was then again pressed into a pellet, wrapped in a platinum foil, sealed in a quartz tube under vacuum and then heated at 700 ∘C for about ten days. The samples were taken out of the furnace and air-cooled to room temperature. The different phases present in the samples were identified from X-ray diffraction patterns at room temperature obtained using a Rikagu Geigerflex diffractometer with a curved graphite crystal monochromator. The diffraction patterns were matched with known phases from the JCPDSjcpds database using the JADE 7 program.jade The samples were repeatedly ground and heated until the X-ray patterns did not show any change to ensure that the samples were in thermal equilibrium at 700 ∘C. The magnetization obs measurements were done on the samples using a Quantum Design Superconducting Quantum Interference Device (SQUID) magnetometer over the temperature range 1.8 K – 350 K and applied magnetic field range 0.001 T – 5.5 T.
III results and analysis
III.1 Phase Relations at 700 ∘C
The phase relations for phases in equilibrium with at 700 ∘C are shown in Fig. 1. The black triangles represent the crystalline phases which exist singly in equilibrium at 700 ∘C. The solid dots represent the compositions of our samples from which the phase relations were determined. The solid straight lines connecting the phases are the tie lines. From a large number of samples synthesized at the nominal stoichiometric composition , it has been found that is a “line compound”, i.e, this compound has an extremely small ( 1 at.%) homogeneity range. This situation is very different from the large homogeneity range in the similiar spinel phase Li[LixTi2-x]O4.Johnston According to the study of Li1-xVO2 by Goodenough et al.goodenough mentioned above, there is a tie line between and at 700 ∘C, consistent with our results. However, our results conflict with their finding of a tie line between and . In particular, the observed tie line in Fig. 1 between and precludes a tie line between and because the latter would have to cross the former which is not allowed.

III.2 Magnetic measurements
III.2.1 Magnetic susceptibility measurements
Here we present the magnetic susceptibility versus temperature for some of our samples of containing small amounts ( wt%) of impurity phases. Based on the X-ray diffraction patterns, the impurity phases present in the samples are in sample 5A, in sample 8 , in sample 5B, and in sample S7 as shown in Table I. Sample 6B was the crystallographically purest sample synthesized and the X-ray diffraction pattern did not reveal any impurity phases. Figures 2 and 3 show expanded X-ray diffraction patterns of these samples.


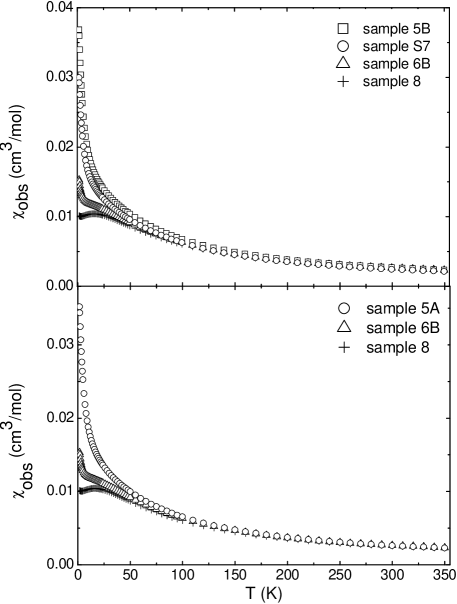
The observed magnetic susceptibility obs versus plots from = 1.8 K to 350 K at magnetic field = 1 T for the five samples are shown in Fig. 4 where obs obs/. It can be clearly seen that the dependence of on for the five samples is similar Curie-Weiss like for 50 K. However for 50 K the dependence is strikingly different. Sample 8 containing impurity phase shows a broad peak at 20 K, which is characteristic of the intrinsic behavior of magnetically pure .Kondo1999 Sample 6B which is crystallographically pure also shows a broad peak but it is masked by a Curie-like upturn at 10 K. For sample 5A containing , S7 containing , and 5B containing as impurity phases, the broad peak is totally masked by Curie contributions.
To interpret the origin of the Curie-like low- contributions to of these samples, it is important to consider the potential contributions of the impurity phases to this term. orders antiferromagnetically with its susceptibility showing a very broad maximum between = 120 K and 130 Knagata ; ueda which is much higher than its Néel temperature K measured by Griffing.griffing The susceptibility for decreases with decreasing , has a value cm3/mol at the lowest temperatures, and shows no evidence for a Curie-like term. has a Curie-Weiss-like behaviour for K where it is also metallic. Below 170 K it orders antiferromagnetically at a metal to insulator transition and the susceptibility remains constant at about cm3/mol down to 80 K. For 80 K, the susceptibility decreases with decreasing with no sign of a Curie-like upturn.ueda ; Kikuchi The susceptibility of V2-yO3 shows a peak at low ( K) as it undergoes antiferromagnetic ordering at around 10 K with no evidence for a Curie-like term at lower .ueda is nonmagnetic since the vanadium atom is in the +5 oxidation state. The only impurity phase exhibiting a low-temperature Curie-like contribution to its susceptibility is Li1-xVO2, which shows a Curie-like upturn at K due to Li deficiency of about 5%.Tian ; Onoda However, the amounts of impurity phases in our samples are small ( 2 wt%). Assuming that = 0.05 in Li1-xVO2 impurity phase,Tian where each Li vacancy induces a V+4 ( = 1/2) defect in that phase, one obtains a Curie constant of cm3 K/mol, which is far smaller than observed ( cm3 K/mol) in our sample 5B having Li1-xVO2 impurity phase. Thus we can conclude that the Curie-like upturn in the susceptibility of nearly single-phase LiV2O4 arises from magnetic defects within the spinel structure of this compound and not from impurity phases, which confirms the previous conclusion of Ref. [7].
III.2.2 Isothermal magnetization measurements
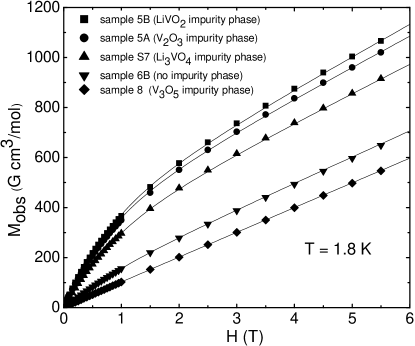
The observed magnetization versus applied magnetic field isothermal measurements were done at different temperatures between 1.8 K and 350 K with varying from 0.001 T to 5.5 T. However, to find only the low (1.8 K, 2.5 K, 3 K and 5 K) isotherms were used. The versus curves for different samples at 1.8 K are shown in Fig. 5. The samples showing a Curie-like upturn in the susceptibility show a negative curvature in their versus curves, whereas the samples having a very small Curie-like upturn in the susceptibility show a hardly observable curvature. This correlation shows that the Curie contribution to the susceptibility is due to field saturable (paramagnetic) defects. The values of the defect concentrations and the values of the defect spins for different samples were determined according to the analysis done by Kondo et al.Kondo1999 The observed molar magnetization obs isotherms at low temperatures ( 5 K) for each sample were simultaneously fitted by
| (1) |
where is the concentration of the magnetic defects, Avogadro’s number, the -factor of the defect spins which was fixed to 2 (the detailed reasoning behind this is given in Ref. [7]), the spin of the defects, the Brillouin function, and the intrinsic susceptibility of spinel phase. The argument of the Brillouin function is = /[kB()] where is the Weiss temperature. The four fitting parameters , , and for each sample are listed in Table I. Since the parameters and are strongly correlated in the fits, the products of these are also listed in Table I.
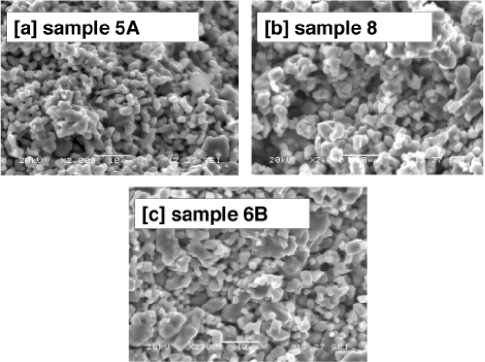
The grain sizes of our samples were studied using a scanning electron microscope (SEM). The SEM pictures of some of our samples are shown in Fig. 6. As seen from the figure, the grain sizes are 1 – 10 m, and from Table I there is no evident correlation between the sample grain sizes and the magnetic defect concentrations.
| Sample no | Impurity | (cm3/mol) | (mol%) | defect | (K) | defect (mol%) |
|---|---|---|---|---|---|---|
| 5A | 0.0123(1) | 0.77(3) | 4.0(1) | 0.70(13) | 3.08(13) | |
| S7 | 0.0115(1) | 0.67(2) | 3.7(1) | 0.59(9) | 2.52(8) | |
| 8 | 0.0098(1) | 0.0067(28) | 6.3(27) | 1.0(10) | 0.04(18) | |
| 5B | 0.0127(2) | 0.83(3) | 3.9(1) | 0.65(12) | 3.29(13) | |
| 6B | no impurity | 0.0104(1) | 0.21(1) | 3.5(2) | 0.75(13) | 0.73(4) |
IV Suggested model
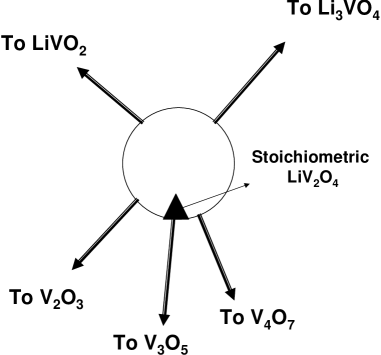
The reason behind the correlation between the presence of the Li-V-O and V-O phases and the variation of the magnetic defect concentration in is not known yet. We speculate that this is due to the formation of vacancies and/or interstitials in the spinel structure due to the variation of the sample composition from the ideal stoichiometry. A possible model is shown in Fig. 7. The black triangle is stoichiometric while the circular region is a small ( at.%) homogeneity range of . Based on this model, the phase in the samples having impurity phase are very close to the ideal stoichiometric , the magnetic susceptibility is the intrinsic susceptibility for the ideal stoichiometric spinel phase and the magnetic defect concentration is very small. The composition of the spinel phase in samples having , or as impurity phases deviates from the ideal stoichiometry as can be seen in the figure. This variation from the ideal stoichiometry would cause the above vacancies and/or interstitial defects to form which in turn cause the formation of paramagnetic defects. The samples having chemical composition different from the black solid triangle (i.e. the ideal stoichiometric composition) but within the circular region will be by definition single phase but not having the ideal stoichiometry. Thus some samples of will have magnetic defects even if there are no impurity phases in them which might be the case for our sample 6B and also samples 3 and 7 studied by Kondo et al.,Kondo1999 where some samples were essentially impurity free but still had a strong Curie contribution in their susceptibility.
V conclusion
In this paper we have reported the phase relations in the -- system at 700 ∘C for compositions in equilibrium with . This study helped us to determine the synthesis conditions under which polycrystalline samples of could be prepared with variable magnetic defect concentrations ranging from defect = 0.006 to 0.83 mol%. High magnetic defect concentrations were found in samples containing , , or impurity phases while the samples containing impurity phase had low defect concentration. We suggested a possible model which might explain this correlation. Our work shows how to systematically and controllably synthesize samples with variable magnetic defect concentrations within the spinel structure. The results should be helpful to other researchers synthesizing samples for study of the physical properties of this system.
Acknowledgements.
Ames Laboratory is operated for the U. S. Department of Energy by Iowa State University under Contract No. W-7405-Eng-82. This work was supported by the Director for Energy Research, Office of Basic Energy Sciences.References
- (1) B. Reuter and J. Jaskowsky, Angew. Chem. 72, 209 (1960).
- (2) S. Kondo, D. C. Johnston, C. A. Swenson, F. Borsa, A. V. Mahajan, L. L. Miller, T. Gu, A. I. Goldman, M. B. Maple, D. A. Gajewski, F. J. Freeman, N. R. Dilley, R. P. Dickey, J. Merrin, K. Kojima, G. M. Luke, Y. J. Uemura, O. Chmaissem, and J. D. Jorgensen, Phys. Rev. Lett. 78, 3729 (1997).
- (3) D. C. Johnston, Physica B (Amsterdam) 281-282, 21 (2000).
- (4) A. V. Mahajan, R. Sala, E. Lee, F. Borsa, S. Kondo, and D. C. Johnston, Phys. Rev. B 57, 8890 (1998).
- (5) K. Fujiwara, K. Miyoshi, J. Takeuchi, Y. Shimaoka, and T. Kobayashi, J. Phys. Condens. Matter 16, S615 (2004).
- (6) D. C. Johnston, S. H. Baek, X. Zong, F. Borsa, J. Schmalian, and S. Kondo, Phys. Rev. Lett. 95, 176408 (2005).
- (7) S. Kondo, D. C. Johnston, and L. L. Miller, Phys. Rev. B 59, 2609 (1999).
- (8) A. Reisman and J. Mineo, J. Phys. Chem. 66, 1181 (1962).
- (9) R. Kohmüller and J. Martin, Bull. Soc. Chim. (France) 4, 748 (1961).
- (10) D. G. Wickham, J. Inorg. Nucl. Chem. 27, 1939 (1965).
- (11) A. Manthiram and J. B. Goodenough, Can. J. Phys. 65, 1309 (1986).
- (12) J. B. Goodenough, G. Dutta, and A. Manthiram, Phys. Rev. B. 43, 10170 (1961).
- (13) D. W. Murphy, P. A. Christian, F. J. DiSalvo, and J. V. Waszczak, Inorg. Chem. 18, 2800 (1979).
- (14) Cited in Ref. [23] as E. Hoschek and W. Klemm, Z. Anorg. Allg. Chem. 242, 63 (1939).
- (15) G. Andersson, Acta Chem. Scand. 8, 1599 (1954).
- (16) H. Kuwamoto, N. Otsuka, and H. Sato, J. Solid State Chem. 36, 133 (1981).
- (17) A. Magnéli, Acta Chem. Scand. 2, 501 (1948).
- (18) S. Andersson and L. Jahnberg, Ark. Kemi 21, 413 (1963).
- (19) H. Horiuchi, N. Morimoto, and M. Tokonami, J. Solid State Chem. 17, 407 (1976).
- (20) F. Aebi, Helv. Chim. Acta 31, 8 (1948).
- (21) K. A. Wilhelmi and K. Waltersson, Acta Chem. Scand. 24, 9 (1970).
- (22) J. Tudo and G. Tridot, Compt. Rend. 261, 2911 (1965).
- (23) K. Kosuge, J. Phys. Chem. Solids 28, 1613 (1966).
- (24) Cited in Ref. [23] as S. Kachi and R. Roy, Second Quarterly Report on Crystal Chemistry Studies, Pennsylvania State University, 4 December (1965).
- (25) International Centre for Crystal Data, 12 Campus Boulevard, Newton Square, Penssylvania 19073-3273 U. S. A. (www.icdd.com).
- (26) Materials Data Inc., 1224 Concannon Blvd., Livermore, California 94550 (www.materialsdata.com)
- (27) D. C. Johnston, J. Low Temp. Phys. 25, 145 (1976).
- (28) S. Nagata, P. H. Keesom, and S. P. Faile, Phys. Rev. B 20, 2886 (1979).
- (29) Y. Ueda, J. Kikuchi, and H. Yasuoka, J. Magn. Magn. Mater. 147, 195 (1995).
- (30) Cited in Ref. [28] as B. F. Griffings (Private communication).
- (31) J. Kikuchi, N. Wada, K. Nara, and K. Motoya, J. Phys. Chem. Solids 63, 969 (2002).
- (32) W. Tian, M. F. Chisholm, P. G. Khalifah, R. Jin, B. C. Sales, S. E. Nagler, and D. Mandrus, Mater. Res. Bull. 39, 1319 (2004).
- (33) M. Onoda, T. Naka, and H. Nagasawa, J. Phys. Soc. Jpn. 60, 2550 (1991).