Charged Particles on Surfaces: Coexistence of Dilute Phases and Periodic Structures on Membranes
Abstract
We consider a mixture of one neutral and two oppositely charged types of molecules confined to a surface. Using analytical techniques and molecular dynamics simulations, we construct the phase diagram of the system and exhibit the coexistence between a patterned solid phase and a charge-dilute phase. The patterns in the solid phase arise from competition between short-range immiscibility and long-range electrostatic attractions between the charged species. The coexistence between phases leads to observations of stable patterned domains immersed in a neutral matrix background.
Mixtures of cationic and anionic amphiphilic molecules can form thermodynamically stable structures such as micelles, membranes and multilamellar systems. These self-assembled structures have been studied as a function of the molar ratio of the oppositely charged molecules, their concentration in solution, and the ionic strength of the environment jokela ; kaler2 ; brasher ; Zemb2 . In addition, the presence of other neutral components leads to a large variety of structures and the possibility of local organization on the surface of membranes and monolayers in emulsions. Such structures are important in diverse applications, such as the design bio-sensing devices biesalski . Moreover, they serve as model systems for the understanding of the properties of cell membranes where structured domains are known to be crucial to cell signaling processes groves . In multicomponent membranes periodic nanostructures can be immersed in a homogenous background. This letter discusses the possibility of this coexistence of periodic nanostructures with dilute phases of immicible cationic and anionic molecules. Besides charges on biological membranes, the competition of short range immiscibility and long range attractions leads to the formation of periodic structures in a large variety of systems including lipid mixtures seul ; keller ; mcconnell ; andelman ; heckl , two dimensional uniaxial ferromagnets garel , reaction controled phase segregating mixtures glotzer , and two dimensional electron gases in MOSFET’s kivelson05 .
Phase separation phenomena at surfaces is well known baumgart ; veatch ; zhang and can be studied through simple models of immiscibility. On the other hand, several recent studies have shown that mixtures of immiscible oppositely charged molecules can form regular periodic nanostructures (or microphases) solis ; ramos ; zasadzinski ; baksh . To study the convergence of these two phenomena we use analytic techniques as well as off-lattice molecular dynamics simulations of a coarse-grained model with two immiscible charged molecular components. We assume that the membrane surface is in equilibrium and that fluctuations perpendicular to the surface are negligible. To begin with, we explore the phase behavior of this model analytically when the domains are well segregated and periodically ordered. We briefly describe the effect of different charge ratios of the molecules, but concentrate on the effects of the presence of the third neutral component and determine the conditions of coexistence between a microstructured solid and a dilute gas of charges. Secondly, we describe the results of molecular dynamics simulations for intermediate segregation regimes. Simulation results exhibit the expected microscopic phase behavior, but also indicate the limits of our theoretical analysis.
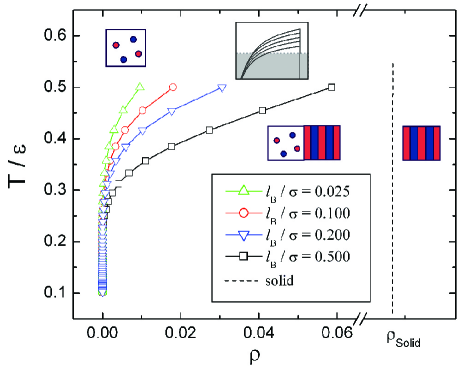
We consider only two possible phases for the system at low temperature. One phase consists of a dense, patterned solid formed by the charged components. Its free energy is computed by assuming the formation of regions of constant particle and charge density. We ignore the fluctuations in the charge density and the shape of the interface. The second phase is homogenous, has a low density of charged particles, and can be treated as a two dimensional charged gas. Its free energy can be calculated at low temperatures using linear response theory by means of the Random Phase Approximation (RPA). The resulting phase diagram is plotted in Fig. 1.
Consider first the calculation of the free energy of the solid phase. The average absolute value of the charge density in this phase is , (in electronic charges per unit area), and the line tension between microdomains is . As shown in previous work, the domains form a lamellar structure for near symmetric charge density ratios, while for highly asymmetric cases we have near-circular domains arranged in a hexagonal lattice. The periodicity of both of these possible structures defines a characteristic length . Then, the free energy contribution per area , due to the microphase formation has the form
| (1) |
Here, the Bjerrum length is , where is the Boltzmann constant and is the temperature, and is the dielectric permittivity of the medium. The coefficients and are dimensionless quantities that depend on specific shape of the microdomains. is the ratio of the microdomain interface length within a unit cell to the size of the cell. is the integral of the dimensionless Coulombic potential over the whole space, averaged over a unit cell. These values are calculated explicitly in Ref.solis for both the lamellar and hexagonal cases. Minimizing the free energy with respect to the size , we obtain an optimal characteristic length , with . Evaluation of the free energy density at that point results on a value of , where solis ; loverde . The net free energy of the solid phase also includes the cohesive energy that arises from segregation of the charged molecules from the neutral component. To be able to compare energies with the more dilute ionic gas, and with results of the molecular dynamics simulations, it is necessary to introduce a model of the individual molecules. In the simulation, their Wan der Waals interactions are described by a classic Lennard Jones potential
| (2) |
where the potential is cut at a radius for oppositely charged molecules and for similarly charged molecules, where is an effective molecular radius. This selection of cut-offs produces a net immiscibility between species of magnitude per contact between oppositely charged particles. In our description of the solid phase, at low temperatures, we simply assume a constant density given by the hcp packing of spherical molecules of radius . For this close packing arrangement we have the constant density . The effective cohesive energy per unit area can then be written in terms of , with 6 favorable contacts with neighbors. Using a similar approximation, the effective line tension is . Inclusion of the cohesive energy, leads the final result for the solid phase as:
| (3) |
Next, consider the free energy of the gas phase. RPA gonzalez2 is used to calculate the free energy as a function of the relative strength of the short range attraction and the electrostatic interactions. The method involves an expansion of the free energy of the system in terms of density fluctuations, neglecting all terms of larger than second order. For a general system of interacting charged monomers, the partition function is written as
| (4) | |||
Here, represents the density of the th component and represents the Fourier transform of the component densities. includes the and self energy terms. is the sum of the interaction energies, consisting of the short range interactions due to the excluded volume and hydrophobic interaction, as well as the long range contributions due to the electrostatic energy. The electrostatic contribution to the internal energy matrix uses the two dimensional Fourier transform of the screened Coulomb interaction, . The free energy is then
| (5) | |||
The first sum (the terms) vanishes due to charge neutrality. The second term is a standard entropic term. The third term is the electrostatic contribution due to density fluctuations, which is calculated by integrating over the possible values of from to , where is the molecular size. We neglect terms arising from excluded volume interactions, as the calculation is dominated by the electrostatic terms. We only consider the limit of no screening due to ions in the surrounding solution (matching the conditions of the calculation for the solid phase and for the molecular dynamics simulations). The electrostatic contribution is found to be,
| (6) | |||
where . The above equations simplify when considering the charge neutrality constraint, The total free energy per unit area for the gas phase, in terms of where , is then
| (7) | |||
where and . The virial terms are where is a hard core potential from and a classic 6-12 Lennard Jones potential from .
To determine the phase coexistence of the solid, patterned phase and the dilute gas, we use the common tangent rule. Since the density of the solid phase is assumed fixed, the equation
| (8) |
is solved for the gas phase density . We plot the two phase coexistence line calculated in this way, for low temperatures, in Fig. 1. The figure refers to the case of equal charge density . The phase diagram shape depends of course on the relative strengths of the Coulomb interaction (through the charge density) and on cohesive/immiscibility parameter . With increasing strength of the electrostatics, the transition points occurs at lower temperatures, while increasing values of the short range interaction increase those temperatures. At higher values of the density, nonlinear corrections to RPA including short range correlations and ion association gonzalez3 ; ermoshkinmacro . Fig. 1 sketches an extrapolation of the results to higher temperatures when the solid phase retains its near constant density.
To explore higher temperatures and the effects of fluctuations, we carried out a set of molecular dynamics simulations. The model systems used are composed, in the symmetric case, of a mix of positively charged and negatively charged units in a simulation box of size , with . In the asymmetric case we used and units with charge (-3). The molecules are confined to a plane perpendicular to the Z axis, with periodic boundary conditions in the X and Y directions. The molecular dynamics simulations, with constant N,V,T were performed using the Espresso simulation code of the MPIP-Mainz group of Polymer Theory and Simulation limbach . We explored regions of the phase diagram at surface densities of . The potential between charges is a Coulomb potential, . Further parameters are as described in detail in previously published work loverde .
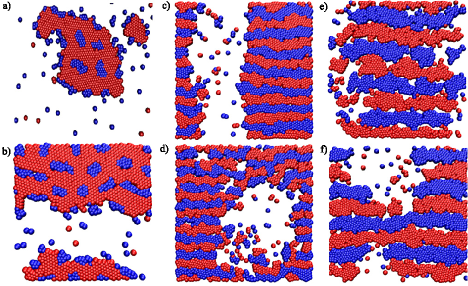
Late-time snapshots of the simulations are shown in Fig. 2. To compare the behavior observed in the simulations to our theoretical results, we point out that the simplest extrapolation of the results from the strong segregation limit to higher temperatures, consist on identifying the characteristic length scale of system (the size of microdomains), up to a constant, with the form . To use this expression for extrapolation, we abandon the assumption of a solid phase density fixed by the molecular radius, but take as the density determined by the simulation at finite temperatures. All our simulations exhibit the same expected basic behavior. At small values of or low Bjerrum lengths (high temperature), positive and negative regions develop on the surface and as the temperature decreases the domains increase in size. In all the simulations, the individual molecular components exhibit a hexagonally close-packed structure (as was assumed in our analytical approach), with density fluctuations dependent on the temperature. For asymmetric charge ratios, , we show in Fig. 2a the formation of a hexagonally patterned ’island’ at . For larger densities, as in Fig. 2b the solid phase occupies a larger fraction of the space, but exhibits more clearly the ordering.
Next, as shown in Fig. 2c-d, for symmetric charge ratios, the preferred microstructure is lamellar. At the values of the parameters used, we observe as well the phase separation between solid patterned and neutral regions. The temperature decrease from snapshot c to d, clearly modifies the fluctuations of both types of interfaces: between charged regions, and between the solid and neutral phases. At lower temperatures (Fig. 2d) the interfaces are much sharper and exhibit lower shape fluctuations. In these simulations, a note and an interesting feature of the solid-gas interface: the orientation of the lamella is perpendicular to the interface. While the charged domains have symmetric interactions with the neutral region, the alignment must be a result of minimization of the local electrostatic energy. To some extent, this feature also appears in the asymmetric case, Fig. 2a-b, where both charged domains appear the at the interface wit the neutral domain.
For symmetric charge ratios, but for weaker electrostatic interactions, Fig. 2e-f show the transition from a solid to a solid-gas coexistence phase. At low values of the cohesive energy the system shows the lamellar patterning but has large voids between the charged domains; the neutral component is attracted to the interfaces where it can reduce the effective line tension between domains. On further increase in the cohesive parameter, the coexistence region is reached, and the neutral regions segregate to form their own phase, as shown in Fig. 2f. The lower values of the Bjerrum length in these cases produce larger lamellar sizes, compared with those of Fig. 2c-d.
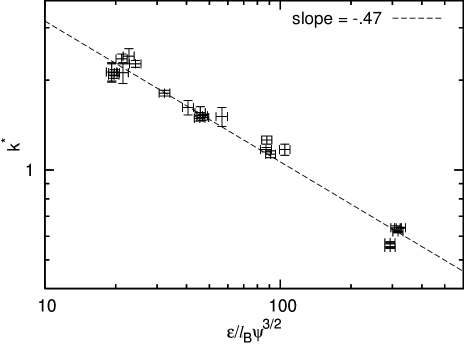
To study the behavior of the domain size (lamellar width) in the symmetric case, we have determined the structure factor , the Fourier transform of the correlation function of the charged components, for the late stages of a number of simulations with different values of the interaction parameters. displays a peak at values corresponding to the inverse lamellar spacing in the direction perpendicular to the lamellas, and thus must scale as . Indeed, in our simulations, we find that the position of the structure factor peak can be fit through a line of slope when plotted against the group ), as shown in Fig. 3.
By use of analytic techniques, combining RPA and strong segregation theory, as well as off-lattice molecular dynamics simulations we have demonstrated the clear possibility of coexistence of structured regions, made of charged components, in a matrix rich in neutral components. The competition between immiscibility tendencies between molecules, against the attractive interactions between oppositely charged species, provides a method to generate well-controlled, self-assembled surface patterns. Furthermore, suitable extensions of the results from the strong segregation limit to higher temperatures provide a clear way to quantitatively address the properties of these materials in practical regimes.
This work was supported by the IGERT-NSF Fellowship awarded to S. Loverde, and by grant numbers DMR-0414446 and EE-0503943. We acknowledge helpful discussions Yury Velichko, Graziano Vernizzi, Christian Holm, including Axel Arnold and Bernward Mann. S. Loverde thanks the hospitality of the group of Christian Holm where this work was initiated.
References
- (1) P. Jokela, B. Jónsson, and A. Khan. J. Phys. Chem., 91:3291, 1987.
- (2) E. W. Kaler, K. L. Herrington, A. K. Murthy, and J. A. N. Zasadzinski. J. Chem. Phys., 96:6698, 1992.
- (3) L. Brasher, K. Herrington, and E. Kaler. Langmuir, 11:4267, 1995.
- (4) T. Zemb, M. Dubois, B. Demé, and T. Gulik-Krzywicki. Science, 283:816, 1999.
- (5) M. Biesalski, R. Tu, and M. Tirrell. Langmuir, 21:5663, 2005.
- (6) J. Groves. Sci. STKE, pe45, 2005.
- (7) M. Seul and M. J. Sammon. PRL, 64:1903–1906, 1990.
- (8) D. J. Keller, J. P. Korb, and H. M. McConnell. J. Phys. Chem., 91:6417–6422, 1987.
- (9) H. M. McConnell. PNAS, 86:3452–3455, 1989.
- (10) D. Andelman, F. Brochard, and J. Joanny. Physical Review Letters, 86:1151–1157, 1987.
- (11) W. M. Heckl, D. A. Cadenhead, and H. Mohwald. Langmuir, 4:1352–1358, 1988.
- (12) T. Garel and S. Doniach. Phys. Rev. B., 26:325–329, 1982.
- (13) S. C. Glotzer, E. A. Di Marzio, and M. Muthukumar. Physical Review Letters, 74:2034–3036, 1995.
- (14) R. Jamei, S. Kivelson, and B. Spivak. Physical Review Letters, 94:056805, 2005.
- (15) T. Baumgaurt, S. T. Hess, and W. W. Webb. Nature, 86:3452–3455, 1989.
- (16) S. L. Veatch and S. L. Keller. Physical Review Letters, 89:268101, 2002.
- (17) D. Zhang, M. A. Carignano, and I. Szleifer. Physical Review Letters, 96:028701, 2006.
- (18) F. J. Solis, S. I. Stupp, and M. Olvera de la Cruz. J. Chem. Phys., 122:054905, 2005.
- (19) L. Ramos, T. C. Lubensky, N. Dan, P. Nelson, and D. A. Weitz. Science, 286:2325, 1999.
- (20) J. A. Zasadzinski, E. Kisak, and C. Evans. Current Opinion in Colloid and Interface Science, 6:85, 2001.
- (21) M. Baksh, M. Jaros, and J. T. Groves. Nature, 427:139, 2004.
- (22) S. M. Loverde, Y. S. Velichko, and M. Olvera de la Cruz. J. Chem. Phys., 124:144702, 2006.
- (23) P. Gonzalez-Mozuelos and M. Olvera de la Cruz. J. Chem. Phys., 100:507–517, 1994.
- (24) P. Gonzalez-Mozuelos and M. Olvera de la Cruz. Journal of Chemical Physics, 118:4684–4691, 2003.
- (25) A. V. Ermoshkin and M. Olvera de la Cruz. Macromolecules, 36:7824–7832, 2003.
- (26) H. Limbach, A. Arnold, B. Mann, and C. Holm. Computer Physics Communications, 174:704, 2006.