Doping dependance of the spin resonance peak in bilayer high- superconductors
Abstract
Motivated by a recent experiment on the bilayer Y1-xCaxBa2Cu3Oy superconductor and based on a bilayer model, we calculate the spin susceptibility at different doping densities in the even and odd channels in a bilayer system. It is found that the intensity of the resonance peak in the even channel is much weaker than that in the odd one, with the resonance position being at a higher frequency. While this difference decreases as the doping increases, and both the position and amplitude of the resonance peaks in the two channels are very similar in the deeply overdoped sample. Moreover, the resonance frequency in the odd channel is found to be linear with the critical temperature , while the resonance frequency increases as doping decreases in the even channel and tends to saturate at the underdoped sample. We elaborate the results based on the Fermi surface topology and the -wave superconductivity.
pacs:
74.25.Ha, 74.20.Mn, 71.10.FdI introduction
Inelastic neutron scattering (INS) experiments have been playing an important role in the studies of the spin dynamics of high- superconductors. They can provide direct information of the momentum and frequency dependence of the dynamical spin susceptibility. Over the past decade, one of the most striking features observed in the INS experiments is the resonant spin excitation. The resonance peak, which has been found in several classes of cuprate materials ross ; fong ; heh ; roso ; step , has attracted much experimental and theoretical attention. This peak is centered at the momentum , with its intensity decreasing rapidly when the frequency moves away from . The resonance frequency is found to be in proportional to the critical temperature roso ; step ; dai . Theoretically, the origin of the spin resonance and its role on superconductivity are still open questions bat ; sei ; and ; lin ; seg ; erem ; morr . It has been proposed that the spin resonance is a collective spin excitation mode morr ; bri ; norman ; jxli ; kao ; li ; jxl ; zhou . Based on this scenario, many properties of spin fluctuations observed in the INS experiments have be explained consistently.
In the YBa2Cu3Oy (YBCO) and Bi2Sr2CaCu2O8+x (Bi-2212) family, one unit cell contains two CuO2 planes. The electronic states in different CuO2 layers belonging to one cell are strongly coupled at all doping levels. Thus, two modes of magnetic excitation are expected to exist in the bilayer systems, i.e., one in the even channel and the other in the odd channel according to the symmetry with respect to the exchange of the layers mil ; taoli ; litao ; esc . In earlier experiments, this expectation was only confirmed in the insulating YBCO samples rezn . In the superconducting state, the spin resonance mode was not observed in the even channel, presumably due to a much weaker intensity in this channel. Recently, the instrumentation advances have made it possible to resolve weaker features in the INS experiments. Two distinct resonance modes were observed in the superconducting state of bilayer (Y,Ca)Ba2Cu3Oy samples pail ; pai . It was found that the resonance peak intensity in the even channel () is much weaker than that in the odd channel (), and the resonance frequency is higher than that of the odd channel. Very recently, the doping evolution of the resonance peak in both the even and odd channels of (Y,Ca)Ba2Cu3Oy was studied in detail by the INS experiments pailh . In the overdoped samples , the resonance position of the odd channel is close to that of the even channel. At this doping level, the two resonance modes have also closer intensities (). When the doping density decreases, the doping evolution of the resonance frequency in the odd channel seems to follow a similar doping dependence as , while the resonance frequency seems to keep increasing in the even channel as the doping decreases and saturates to a constant in the underdoped sample. Moreover, the resonance peak intensity in the odd channel is also much larger than that in the even channel in the underdoped sample. The intensity ratio decreases monotonously as doping decreases and reaches 0.05 in strongly underdoped samples.
Motivated by these experimental observations, we here present a detailed investigation of the doping dependence of the spin resonance mode in the even and odd channels. Following Ref. lijx , we employ a bilayer type Hamiltonian including the interlayer hopping and interlayer exchange coupling. In order to examine the robustness of the doping dependance of the difference between the two resonance modes, we also look into in detail the effect of the interlayer hopping parameters and the interlayer exchange coupling .
The article is organized as follows. In Sec. II, we introduce the model and work out the formalism. In Sec. III, we perform numerical calculations and discuss the obtained results. Finally, we give a brief summary in Sec. IV.
II Hamiltonian and Formalism
We start with a Hamiltonian which describes a system with two layers per unit cell.
| (1) | |||||
where denotes the layer index. In the slave-boson approach, the physical electron operators are expressed by slave bosons carrying the charge and fermions representing the spin, . At the mean-field level, we consider the order parameters , ( depend on if the bond is in the or the direction), . In the superconducting state, bosons condense , where is the hole concentration.
Then, the mean-field Hamiltonian can be written as,
| (2) | |||||
with , , , and . Diagonalizing the Hamiltonian, we can get the antibonding band (A) and bonding band (B) with the dispersion . Here we use the momentum independent interlayer hopping constant , being consistent with the recent angle resolved photoemission experiment on YBCO bori , which reveals an obvious bilayer splitting along the nodal direction.
The bare spin susceptibility can be expressed as,
| (3) | |||||
Here , is the quasiparticle energy, and is the Fermi distribution function.
The bare even and odd channel spin susceptibilities which come respectively from the intraband and interband electronic transitions, are given by
| (4) |
By including the correction of the antiferromagnetic (AF) spin fluctuations to the spin susceptibility in the form of the random-phase approximation (RPA), the renormalized spin susceptibilities for the even and odd channels can be obtained as
| (5) |
where signs represent the spin susceptibility in the even and odd channels, respectively, is the interlayer exchange coupling, is the intralayer exchange. We here also include to set the AF instability at bri . The mean-field order parameters , together with the chemical potential for different doping can be obtained from the self-consistent equations. The other parameters we choose are , .

Before we present our results, we wish to point out that the above formulas represent the spin susceptibility of the fermions. The spin susceptibility for physical electrons should be due to the boson condensation in the superconducting state.
III results and discussion

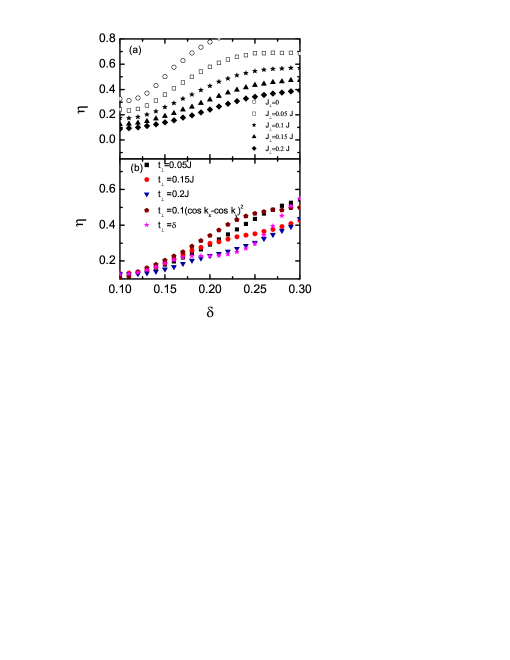
The odd and even channel spin susceptibilities at different doping densities are shown in Figs.1(a) and (b), respectively. As seen, the peak intensity in the odd channel is sensitive to the doping, namely, it increases dramatically as the doping decreases. While in the even channel it increases slowly as the doping decreases. To see the doping evolution more clearly, we plot the peak positions of the even and odd channels as a function of the doping in Fig.1(c), and the ratio of the intensities of the spin resonance between the even and odd channels, versus doping in Fig.1(d). From Fig.1(c), the resonance frequency in the odd channel increases as the doping increases and saturates at the optimal doping, then it decreases slightly in the overdoped regime. While in the even channel, the resonance frequency increases as the doping decreases, so that the peak positions of the even and odd channels are closer and closer as the doping density increases, and the corresponding resonance frequencies are almost the same in the deeply overdoped sample. The difference of the intensities in the even and odd channels increases as the doping density decreases, as seen in Fig.1(d). The intensity ratio is only in the strongly underdoped sample, and around 0.4 in the overdoped region. Our results are qualitatively consistent with the experimental results pailh . We also examine the relationship between the resonance frequency and the critical temperature by using an empirical formula , where is used to ensure the AF instability to occur at . The resonance frequency in the odd and even channels as a function of is plotted in Fig.2 (). The resonance frequency is found to be proportional to in the odd channel, which is in good agreement with the experimental results step ; dai ; roso . While in the even channel, the spin resonance frequency () depends weakly on in the strongly underdoped sample, being also qualitatively consistent with the very recent experiments pailh , in which the resonance frequency in the even channel is observed to increase in the overdoped sample and to saturate to a constant in the underdoped sample.
We now address the dependence of the intensity difference of the spin resonance between the two channels on the parameters and . The intensity ratio as a function of the doping for different is plotted in Fig.3(a). As seen, when increases, the intensity ratio decreases, indicating that the interlayer exchange coupling can strongly affect the even and odd channels and enhance the difference. However, the intensity ratio decreases as the doping decreases for all we considered, indicating that our results presented above are robust against the variation of the interlayer exchange coupling . On the other hand, we can also see from Fig.3(a) that even if , the intensity in the odd channel is still significantly stronger than that in the even channel, suggesting that the interlayer exchange coupling is not the only contribution for the difference between the two channels. In fact, the other contribution comes from the interlayer single-particle hopping. To show this, we plot the ratio versus the doping for different hopping constants in Fig.3(b). As increases, the ratio decreases. So, the interlayer single particle hopping also contributes to enhance the difference between the two channels. Let us also consider the cases that depends on the doping density and momentum . Note that, the bilayer splitting is found to be momentum dependence in Bi-2212 bilayer systems feng , without observing the bilayer splitting in the nodal direction. We also examined that our results are robust for different types of the interlayer hopping constant , as shown in Fig.3(b).
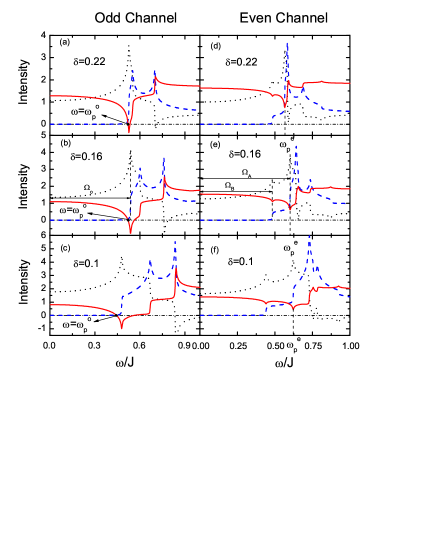
Now we elaborate the origin of the above features based on the Fermi surface topology. In Fig.4 note , we plot the imaginary and real parts of the bare spin susceptibility in the odd and even channels with different doping densities. We first address the spin excitation in the odd channel. As shown in Fig.4(a-c), the imaginary part of the bare spin susceptibility approaches to zero as the frequency is below the spin gap. At the edge of the spin gap, it has a step-like rise which arises from the flat band near (Van Hove singularity). As a result, the real part of the bare spin susceptibility Re develops a sharp structure near the edge. Consequently, a pole occurs when the real part of the RPA factor Re is equal to zero at the frequency (slightly below the gap edge) and in the meantime the imaginary part of the spin susceptibility at approaches to zero due to the spin gap. This suggests the formation of a spin collective mode, which is ascribed to be the spin resonance. We can also see from Fig.4(a-c) that the frequency, at which a step-like rise occurs, increases as the doping decreases starting from the optimal doping, but it decrease slightly in the overdoped regime. This explains the doping dependence of the resonance frequency as presented in Fig.1(c). On the other hand, the real part of the bare spin susceptibility also increases with the decrease of doping. This leads to the pole position to be more and more below the spin gap edge (due to the finite damping , the imaginary part of is not zero slightly below the spin gap) and consequently to an increase in the renormalized spin susceptibility. For the even channel case, an obvious difference is seen from Fig.4(d-f) that there are two step-like rises, instead of one in the odd channel. These two step-like rises come from the particle-hole scattering in the and bands, respectively, because the spin susceptibility in the even channel is contributed by the intra-band and scatterings as shown clearly in Eq.(4). The scattering within the band leads to the step-like rise in at a lower frequency , while that in the band leads to a higher frequency rise at . Since the rise is larger at , the corresponding enhancement of the real part of is larger there. Thus, the spin resonance peak occurs near in this case. We note that, due to a smaller vertex in this channel, the pole condition Re could not be satisfied at a large doping range. In the meantime, the corresponding imaginary part of is of appreciable value because of the scattering in the B band. So, the resonance peak in this case is basically a quasi-resonance peak, with its intensity being much lower than that in the odd channel as shown in Fig.1(b). Also in contrast to the case of the odd channel, the frequency, at which the high-energy step-like rise occurs, increases with the decrease of doping. Therefore, the spin resonance frequency at the even channel increases upon reducing the doping as shown in Fig.1(c). On the other hand, one can see from Fig.4(d-f) that both the real and imaginary parts of in the lower side of do not change much with doping. Considering the appreciable increase of the resonance intensity with the decrease of doping in the odd channel, it is expected that the difference between the spin resonance peak intensities of the two channels increases as the doping decreases.
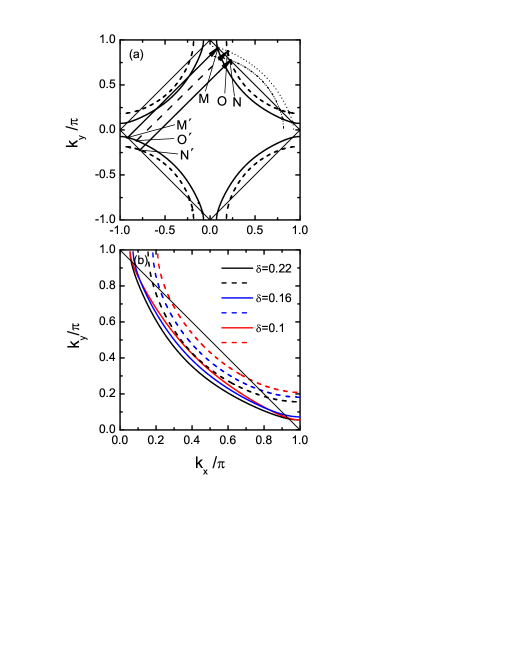
These features can be traced to the evolution of the Fermi surface with doping. We present the normal state Fermi surface in Fig.5. As discussed above, the step-like rise is near the spin gap edge. In the zero temperature limit, the bare spin susceptibility [Eq.(3)] can be rewritten as Im. Here, denotes the energy to break a pair and excite two quasiparticles from the superconducting condensed state, and has a minimum of the exciting energy (MIN) when the wave vector is at where the spin resonance is observed, which is just the spin gap. Because of the -wave symmetry of the superconducting gap and energy band structure, the excitation within the band with the minimum excitation energy is the -to- excitation as shown in Fig.5(a), while that within the band and that of the interband correspond respectively to the -to- and -to- excitations, where are the crossing points (hot spot) of the Fermi surface with the magnetic Brillouin zone boundary, and are the crossing points of the band Fermi surface with the shifted images of the band Fermi surface. From Fig.5(b), we can see that the hot spot of the band moves towards the nodal direction as the doping decreases, and consequently the magnitude of the corresponding superconducting gap decreases. The band depends weakly on the doping density, but the magnitude of the superconducting gap increases with doping, as calculated from the mean-field theory here and observed in experiments shen . Because the spin excitation in the odd channel comes from the -to- excitation, its spin gap decreases with the decrease of doping. While, the high-energy step-like rise in the even channel is contributed by the excitation from to , it increases with the decrease of doping.
IV Summary
In summary, we have examined the doping evolution of the spin susceptibility in the even and odd channels in the bilayer high- superconducting materials based on the bilayer type model. In the bonding and antibonding band representation, there exist two channels of the spin excitation according to the intraband scattering and interband scattering. Each channel has its distinct resonant mode. In the odd channel, i.e., the interband scattering, the spin susceptibility shows a strong doping dependence. As the doping decreases, the intensity increases dramatically and the resonance frequency is linear with . The resonance frequency in the even channel approaches to that in the odd channel and the ratio between the two channels is around 0.4 in the overdoped region. As the doping decreases, the resonance frequency increases and saturates at the strongly underdoped sample. In addition, it has been found that the differences of the resonance positions and intensities between the two channels are enlarged as the doping decreases. Our results are well consistent with the experiments. We have elaborated the results based on the topology of the Fermi surface and the -wave superconductivity.
Acknowledgements.
The work was supported by the RGC grants of Hong Kong(HKU 7050/03P and HKU-3/05C), the NSFC (10174019,10334090,10429401 and 10525415), and the 973 project under the Grant No.2006CB601002.References
- (1) J. Rossat-Mignod , Physica C 185, 86 (1991).
- (2) H. F. Fong , Nature 398, 588 (1999).
- (3) H. He , Science 295, 1045 (2002).
- (4) H. He , Phys. Rev. Lett. 86, 1610 (2001).
- (5) S. D. Wilson , Nature 422, 59 (2006).
- (6) P. Dai, H. A. Mook, R. D. Hunt, and F. Doan, Phys. Rev. B 63, 054525 (2001).
- (7) C. D. Batista, G. Ortiz and A. V. Balatsky, Phys. Rev. B 64, 172508 (2001).
- (8) G. Seibold and J. Lorenzana, Phys. Rev. Lett. 94, 107006 (2005).
- (9) B. M. Andersen and P. Hedegard, Phys. Rev. Lett. 95, 037002 (2005).
- (10) P. A. Lindgard, Phys. Rev. Lett. 95, 217001 (2005).
- (11) I. Sega and P. Prelovek, Phys. Rev. B 73, 092516 (2006).
- (12) I. Eremin ., Phys. Rev. Lett. 94, 147001 (2005).
- (13) D. K. Morr and D. Pines, Phys. Rev. B 61, R6483 (2000).
- (14) J. Brinckmann and P. A. Lee, Phys. Rev. Lett. 82, 2915 (1999).
- (15) M. R. Norman, Phys. Rev. B 61, 14751 (2000).
- (16) J. X. Li and C. D. Gong, Phys. Rev. B 66, 014506 (2002).
- (17) Y. J. Kao, Q. Si, and K. Levin, Phys. Rev. B 61, R11898 (2000).
- (18) J. X. Li, C. Y. Mou, and T. K. Lee, Phys. Rev. B 62, 640 (2000).
- (19) J. X. Li, J. Zhang, and J. Luo, Phys. Rev. B 68, 224503 (2003).
- (20) T. Zhou and J. X. Li, Phys. Rev. B 69, 224514 (2004).
- (21) A. J. Millis and H. Monien, Phys. Rev. B 54, 16172 (1996).
- (22) T. Li and Z. Z. Gan, Phys. Rev. B 60, 3092 (1999).
- (23) T. Li, Phys. Rev. B 64, 012503 (2001).
- (24) M. Eschrig and M. R. Norman, Phys. Rev. Lett. 89, 277005 (2002).
- (25) D. Reznik , Phys. Rev. B 53, R14741 (1996).
- (26) S. Pailhs , Phys. Rev. Lett. 91, 237002 (2003).
- (27) S. Pailhs , Phys. Rev. Lett. 93, 167001 (2004).
- (28) S. Pailhs , Phys. Rev. Lett. 96, 257001 (2006).
- (29) J. X. Li, T. Zhou, and Z. D. Wang, Phys. Rev. B 72, 094515 (2004).
- (30) S. V. Borisenko , Phys. Rev. Lett. 96, 117004 (2006).
- (31) D. L. Feng , Phys. Rev. Lett. 86, 5550 (2001).
- (32) Here we use a much smaller quasiparticle damping to see the characteristic of the bare spin susceptibility more clearly. The main results will not change qualitatively as the quasiparticle damping changes.
- (33) For references see, e.g., A. Damascelli, Z. Hussain and Z. X. Shen, Rev. Mod. Phys. 75, 473 (2003).