Antinodal quasiparticles below and above in the CMR oxide La2-2xSr1+2xMn2O7 with
Abstract
In light of recent conflicting angle resolved photoemission studies on the bilayered colossal magnetoresistant (CMR) manganite La2-2xSr1+2xMn2O7 (), new ARPES data are presented for and 0.40, showing only for the former clear quasiparticle-like features at and around the –point in –space. The electronic states are clearly renormalised, both as regards their dispersion relation and lifetime due to coupling to bosonic degrees of freedom. Importantly, both the existence of quasiparticles and their renormalisation survive well into the paramagnetic state, up to 50 K above . This argues against strong coupling to spin modes and raises questions regarding the nature of the paramagnetic insulating phase.
pacs:
74.25.Jb, 75.47.Lx, 79.60.-iRecently, there has been an upsurge in interest in bilayer manganates (La2-2xSr1+2xMn2O7) with - (abbreviated forthwith LSMO). New experimental data has appeared from STM Renner and angle resolved photoemission (ARPES) studies Shen ; Dessau . In the new photoemission data, ‘quasi-particle-like peaks’ (QP peaks) have been reported at the Fermi level () for doping levels between and . The presence and behavior of QP features are an important clue for resolving the nature of the ferromagnetic metal to paramagnetic insulator transition and the related, but poorly understood CMR effect that are displayed by these compounds.
In one of the published ARPES datasets QP peaks are observed for , but only around the Brillouin zone diagonal (or ‘nodal’ region), while the (or ‘antinodal’) region of the Brillouin zone was peak-less and gapped at Shen . These observations have given rise to the hypothesis that the LSMO family are ‘nodal metals’, in analogy to the high superconductors (HTSC), implying that the (in)famous pseudo-gap phase is a state of matter that is not uniquely reserved for the HTSC Shen . In this context, the bilayer manganates have even been connected recently with ‘latent d-wave superconductivity’ baskaran .
In clear contradiction, other published data do not exhibit any QP features at all for Dessau ; Dessau_science . In addition, the existence of QP peaks was reported in an entirely different region of the Brillouin zone for the doping levels and , namely around the point, which is thus non-gapped Dessau .
Can these seemingly contradicting results be reconciled with one another? One suggestion Dessau has been connected with the canting of the magnetic moments on the Mn sites on going from to , resulting in increased three dimensionality for the latter. Indeed, a subtle interplay between orbital and electronic degrees of freedom causes LSMO to have a complex (magnetic) phase diagram as a function of doping ling ; kimura . However, at present it remains unclear as to whether the gradual structural changes observed on going from to are really able to quantitatively explain the seemingly diametrically opposing paradigms of ‘nodal-metal’ versus an ‘anti-nodal metal’ for the same group of materials.
Important and far reaching statements have been made about the electronic nature of LSMO in connection to the physics of the HTSC, based on a nodal metal picture that has proven not to be generic for the entire range of doped bilayer manganates. Thus, in order to get clarity about the validity of the pictures presented, it is evident that additional high quality experimental data is required. In this letter we present such measurements, carried out on LSMO with and . We show clearly the existence of (renormalised) QP features in the region of -space for and the absence of such features in the same k-space region for . Furthermore, for the first time, we explore the temperature dependence of these antinodal QPs.
Experiments were performed at the U125-PGM1 beamline at BESSY, using an SES100 analyzer. The experimental resolution was 30 meV in energy and 0.01 in at the excitation energies used. High quality single crystals of LSMO were investigated, grown in Amsterdam using the optical floating zone technique. Both doping levels studied are paramagnetic (PM) insulators at high temperatures, but become (poor) ferromagnetic metals below the Curie temperature , which was determined using SQUID magnetometry to be 131 K for and 125 K for . The crystals were cleaved at K, and the base pressure was lower than mbar. Very sharp, tetragonal low energy electron diffraction patterns were obtained from all the measured cleavage surfaces.
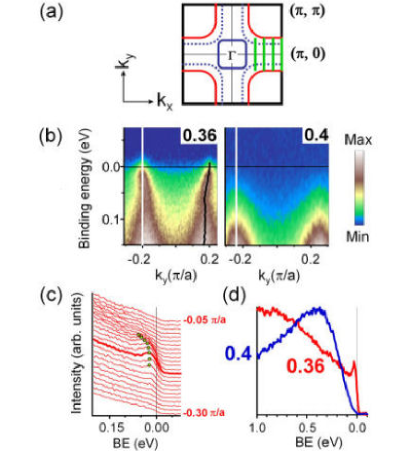
A sketch of the Brillouin zone of LSMO 0.36 is depicted in Fig. 1(a) huang ; dessau2 . In Fig. 1(b) a typical energy distribution map (EDM) is shown as obtained from a zone face cut with for both LSMO and . The former displays a dispersive feature [the Mn anti–bonding (AB) band] crossing at . A stack plot of the relevant energy distribution curves (EDCs) forms panel (c) of Fig. 1, showing a small peak at low binding energy (BE) dispersing towards on top of a background that is increasing to higher BE. Analogously to Refs. [Shen, , Dessau, ], we refer hereafter to the small peak in the EDCs as a ‘quasi-particle peak’, without further discussion, for example, of its width as a function of energy.
The data from LSMO with in Fig. 1(b) show strongly suppressed spectral weight near , when compared to the data from the same -space location. Although we carried out extensive measurements on the doping level utilising different excitation energies and measurement geometries, we never observed a QP peaks such as those seen for . Panel (d) of Fig. 1 brings the differences between the data for and 0.40 sharply into focus. We show -EDCs for both doping levels footnote_kF . The QP peak for is preceded by a broad hump at higher BE, which has its maximum at around 1 eV. This hump has been connected with the incoherent part of the single particle spectral function, resulting from the coupling of bosonic modes to the electron system Dessau . For , the small QP peak is clearly absent and the spectral weight at , though non-zero, is very small.
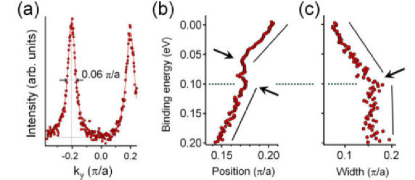
The dispersion of a band can be traced via analysis of the momentum distribution curves (MDCs: horizontal cuts through an EDM). Such an MDC taken at from the data of Fig. 1(b) is depicted in Fig. 2(a). Two well-defined peaks are seen with a width of 0.06 , which corresponds to a mean free path length of about 35 Å, would one assume that the width is entirely due to life-time broadening. It is clear from Fig. 2(b), which shows the positions of the MDC maxima plotted as a function of BE, that the MDC maxima trace a path deviating significantly from the parabola expected for a non-interacting (‘bare’) electron band. In fact, a two-branch dispersion is seen, whereby below 100 meV the velocity alters with respect to the high BE value, and under 50 meV a new, lower velocity is fully established. Such behaviour in the dispersion is a signal for significant structure in the real part of the self energy, due to coupling to one or more bosonic modes kink .
Within a simple analysis, the dimensionless coupling constant for the interaction with the mode(s) , follows from . This yields a coupling strength of the order of unity, which agrees for the value reported for in Ref. [Dessau, ]. The fact that the well-defined MDC feature can be followed over more than 300 meV in BE means that the accepted MDC method - appropriate for a non-gapped region of -space - can and should be used to estimate Bogdanov . If one were to extract the low BE velocity from the EDC peak maxima, an artificially large value of would be arrived at, of order of that quoted in Ref. [Shen, ].
Not only the position, but also the widths of the MDC peaks show a clear ‘kink’ as a function of BE. As can be seen in Fig. 2(c), below 100 meV there is a rapid decrease in the MDC width, which reflects a decrease in the scattering rate. This in turn is evidence of significant structure for this energy and -location in the imaginary part of the self energy, in keeping with the anomaly in the dispersion discussed above.
By fitting a parabolic dispersion through the peaks of the MDCs at and high BE (i.e. excluding the MDCs at energies around the kink), the bottom of the AB band can be placed at about 400 meV BE. On taking an excitation energy of 74 eV, it was also possible to observe a second dispersing feature for LSMO , similar to the one shown in Fig. 1(b), but with and a band bottom at around 700-800 meV BE. This second band can be attributed to the Mn 3d-based bonding band (BB), in keeping with Ref. [Dessau, ]. With this in mind, one can certainly ascribe –at least– part of the observed high BE spectral weight for LSMO (the ‘hump’) in Fig. 1(d) to the bonding band.
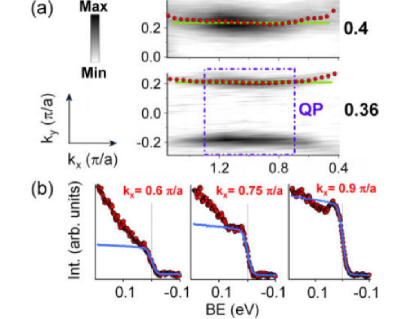
Up until now we have concentrated on the antinodal or zone face states with . Now in Fig. 3(a) we show a constant energy map for for LSMO covering the (,0) point, but also stretching quite some way into the first and second Brillouin zones. The two Fermi surface segments (both AB band), are nested over a significant range of either side of , before they start to deviate significantly from being parallel.
In contrast, the QP peak in the EDCs is resolvable only over a relatively short -range. -EDCs are shown in Fig. 3(b), from which one can see that while at there is still a small peak visible on top of the large incoherent hump, by no peak is observed in the EDCs. Interestingly, despite this, the characteristic two-branch band dispersion is still present at this point in -space (not shown). We note here that the disappearance of the QP peak spectral weight at this -value is not associated with the opening of a gap, as can be seen in Fig. 3(b) from a comparison of the EDCs with the Fermi edge of a polycrystalline gold film. In addition, an analysis of the EDCs by means of symmetrization symmetrize indicates no opening of a gap. For -values closer to than , the statistics of the data are insufficient to make a conclusion regarding the opening of a gap. Thus, the data presented here for show that at least two thirds in length of the side of the -centered Fermi surface barrels is ungapped.
For comparison, we show in Fig. 3(a) a constant energy map for LSMO , in this case for only one side of the -[,0] line. Because of the very low spectral weight at EF for , the map shows data integrated over 60 meV below the Fermi level, which results in a broader band. Although for no QP peaks were found, the map resembles that of LSMO closely; both show a similar shift in as a function of and a relative decrease of spectral weight away from the point.
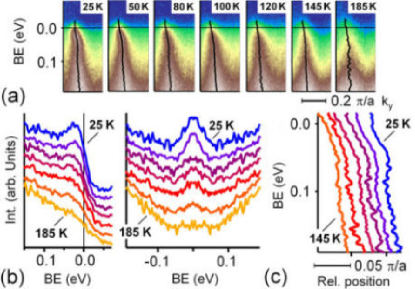
Now moving beyond the question as to the applicability of the epithet ’nodal metal’, for these systems, we present the first data concerning the temperature dependence of the quasiparticle excitations at the zone face of a bilayer manganate (). Fig. 4 shows data from the -point taken at temperatures from 25 K up to 185 K, the latter well above the of 130 K. Panel (a) contains EDMs showing one of the branches of the AB band. It is clear that – apart from thermal broadening – all the EDMs look very similar. The spectral weight of the QP peak does decrease steadily with temperature, as can be seen from the EDCs shown in Fig. 4(b). Nevertheless, even at 185 K some QP spectral weight still remains, causing a plateau in the slope of the incoherent hump seen in the EDC. None of the spectra in Fig. 4 show a gap, as can be seen from the symmetrized -EDCs displayed in panel (b). The fact that QP spectral weight near exists even 50 K into the paramagnetic region of the phase diagram seems at odds with its insulating nature, and deserves further study, both experimentally and theoretically. Additionally, in Fig. 4(c), one sees that the dispersion of the band is essentially independent of the temperature: even at 145 K the effective masses of two dispersion branches remain essentially unaltered.
These data put important constraints on the identity of the boson(s) coupling to the fermionic system in this region of -space. The two-branch behaviour and lifetime renormalisation effects are caused by moderately strong coupling to largely temperature independent collective degrees of freedom. Dealing first with the spin channel, we mention that fluctuations of the ferromagnetic order parameter would be expected to play an increasing role close to : not a trend seen in the two-branch nature of the dispersion data. Magnons can also be ruled out as the culprit: firstly, the coupling for a half-metal with large exchange interaction would be expected to be small SchaeferPRL , and secondly the magnon energies in LSMO HirotaPRB are much lower than the energy scale of the renormalisation seen in the ARPES data. Long-lived antiferromagnetic clusters have been shown to exist in LSMO (x=0.40) in the PM phase PerringPRL , but they disappear quickly for , thus excluding one of the bosonic channels most discussed in the context of the HTSC cuprates. This leaves two possibilities: phonons or orbital degrees of freedom. The former (in particular bond-stretching modes) have been suggested as the cause in Ref. [Dessau, ]. The latter – certainly one of the leitmotifs in the physics of the manganese oxides – have been claimed to lie in an energy range above 100 meV from Raman data SaitohNature , although the interpretation of the Raman data in terms of orbital waves has been strongly contested from optical conductivity data GrueningerNature . From theory vandenBrinkPRL , the elementary excitations are expected to be of mixed phonon/orbiton character, thus if the Raman features in Ref. SaitohNature at around 150 meV are orbitally related, they are orbiton satellites of phonon lines, shifted by 70 meV from the bare phonon lines. Therefore, at this stage the exclusion of orbital or mixed phonon/orbiton excitations from the arena would seem premature. We note that the suppression of the QP spectral weight around the node in our data [e.g. in Fig. 3(a)] - which is where the electron pocket comes closest to the bands - would not be inconsistent with a possible role for orbital fluctuations.
In summary, we use ARPES to show unambiguously that QP-like excitations exist at and near the points in the bilayer manganate La1.28Sr1.72Mn2O7. In contrast, our data for La1.2Sr1.8Mn2O7 is characterised by a strongly suppressed spectral weight at the Fermi level and a lack of QP excitations at all locations in k-space measured. In La1.28Sr1.72Mn2O7, the QP features display clear signs of moderately strong coupling to bosonic degrees of freedom at an energy scale of the order of 50-100 meV. These renormalisation effects at the Brillouin zone face are remarkably temperature independent, being still visible some 50 K above . Either phonon or orbital excitations are possible candidates for the bosonic degrees of freedom involved, whereas AFM or FM spin fluctuations would appear to be much less likely candidates. Finally, the ‘nodal-metal’ picture, though possibly valid for LSMO , is certainly not generically applicable to the bilayer manganates as a family. Any general parallel between the manganates and the HTSC cuprates based on this nodal metal scenario Shen ; baskaran should thus be reconsidered.
Our thanks to the IFW Dresden group for lending us their spectrometer, and to W. Koops and T. J. Gortenmulder for expert technical support. This work is funded by the FOM (ILP and SICM) and the EU (I3).
References
- (1) H. M. Rønnow et al. Nature (London) 440, 1025 (2006).
- (2) N. Mannella et al. Nature (London) 438, 474 (2005).
- (3) Z. Sun et al. Phys. Rev. Lett. 97, 056401 (2006).
- (4) G. Baskaran, cond-mat/0607369.
- (5) Y.-D. Chuang et al. Science 292, 1509 (2001).
- (6) C. D. Ling et al. Phys. Rev. B 62, 15097 (2000).
- (7) T. Kimura and Y. Tokura, Annu. Rev. Mater. Sci. 30, 451 (2000).
- (8) X. Y. Huang et al. Phys. Rev. B 62, 13318 (2000).
- (9) Y.-D. Chuang et al. Science 292, 1509 (2001)
- (10) for the -EDC is taken as that with the greatest intensity close to EF
- (11) M. Hengsberger et al. Phys. Rev. Lett. 83, 592 (1999).
- (12) P. V. Bogdanov et al. Phys. Rev. Lett. 85, 2581 (2000).
- (13) M. R. Norman et al. Nature (London) 392, 157 (1998).
- (14) J. Schäfer et al. Phys. Rev. Lett. 92, 097205 (2004).
- (15) K. Hirota et al. Phys. Rev. B 65, 064414 (2002).
- (16) T.G. Perring et al. Phys. Rev. Lett. 78, 3197 (1997).
- (17) E. Saitoh et al. Nature (London) 410, 3197 (1997).
- (18) M. Grüninger et al. Nature (London) 418, 39 (2002).
- (19) J. van den Brink, Phys. Rev. Lett.,87, 217202 (2001).