Ferromagnetic resonance study of sputtered CoNi multilayers
Abstract
We report on room temperature ferromagnetic resonance (FMR) studies of [ Co Ni]N sputtered films, where nm. Two series of films were investigated: films with same number of CoNi bilayer repeats (N=12), and samples in which the overall magnetic layer thickness is kept constant at 3.6 nm (N=1.2/). The FMR measurements were conducted with a high frequency broadband coplanar waveguide up to 50 GHz using a flip-chip method. The resonance field and the full width at half maximum were measured as a function of frequency for the field in-plane and field normal to the plane, and as a function of angle to the plane for several frequencies. For both sets of films, we find evidence for the presence of first and second order anisotropy constants, and . The anisotropy constants are strongly dependent on the thickness , and to a lesser extent on the total thickness of the magnetic multilayer. The Landé g-factor increases with decreasing and is practically independent of the multilayer thickness. The magnetic damping parameter , estimated from the linear dependence of the linewidth, , on frequency, in the field in-plane geometry, increases with decreasing . This behaviour is attributed to an enhancement of spin-orbit interactions with decreasing and in thinner films, to a spin-pumping contribution to the damping.
pacs:
72.47.-mMagnetotransport phenomena; materials for magnetotransport and 85.70.KhMagnetic recording materials1 Introduction
An understanding of magnetization dynamics in very thin ferromagnetic layers is central to the physics and application of spin-transfer, as devices are typically composed of layers only a few nanometers thick spintronics . For example, the threshold current density for magnetic excitations is proportional to the magnetic damping parameter , which can depend on the layer environment tserkovnyak ; spintronics2 ; beaujour . Further, in most spin-transfer devices, current-induced excitation involves precession of the magnetization out of the thin-film plane. The easy-plane anisotropy associated with the thin film geometry therefore plays a significant role in the resulting precession and reversal. It is also predicted to set the threshold current, since this anisotropy is often much larger than the in-plane anisotropy sun . It is therefore of interest to vary the easy-plane anisotropy and experiment with layers with perpendicular magnetic anisotropy sun ; kent . In fact, very recently CoNi multilayers were incorporated into spin-torque devices mangin . This magnetic multilayer system is interesting because it has a tunable easy-plane anisotropy, and devices which incorporate such layers exhibit a reasonable GMR. Early on, Daalderop et al. showed that evaporated CoNi multilayers exhibit large perpendicular magnetic anisotropy (PMA) and perpendicular magnetization daalderop . In addition, it was shown that by varying the CoNi thickness ratio, it is possible to change the effective demagnetization field. While there has been a great deal of experimental research on CoNi multilayers, study of the ferromagnetic resonance linewidth and the magnetization damping of multilayers has yet to be reported.
In this paper, we present a study of the magnetic properties and the magnetization dynamics of sputtered [ Co Ni]N multilayers. We discuss the sample fabrication, the structural characterization of the films, and the experimental setup. Then the thickness dependence of the effective anisotropy field and the Landée g-factor is presented and analyzed. Finally, the magnetic damping parameter is estimated and its thickness dependence is discussed.
2 Sample fabrication and experimental set-up
Two series of films with the layered structure PtCu[ Co2 Ni]NCuPt were fabricated, where N is the number of bilayer repeats. The CoNi layer thickness ratio was kept constant at 1 to 2, and was varied between 0.1 and 0.6 nm. The Pt and Cu layers are 5 nm and 10 nm thick respectively. For one series of multilayers, the number of CoNi bilayer repeats was kept constant at N with nm. Thus, the total thickness of the magnetic multilayer varied from 7.2 to 21.6 nm. For the other set of samples, N was chosen so that is constant at 3.6 nm with N. Note that nm is in the range of the free layer thicknesses used in spin-transfer devices. The multilayers were prepared by DC magnetron sputtering at room temperature on oxidized Si wafers, with no applied magnetic field. The base pressure in the UHV system was Torr and the Ar pressure was Torr. The stacking of the individual Co and Ni layers was achieved by opening and closing shutters.
2.1 Structural characterization

Non-resonant x-ray diffraction (XRD) was carried out on films with magnetic layer structures of [0.1 Co0.2 Ni], [0.3 Co0.6 Ni], and [0.3 Co0.6 Ni] at 1.6295 Å (7.6084 keV) at NSLS beamline X16B (Figure 1). The wavelength was calibrated using an Al2O3 powder sample, and the intensity was collected with a solid state Bicron detector. In all films the Pt and Cu layers have a face centered cubic (fcc) structure evident from the (111) and (200) reflections present for both elements. In Figure 1a, the measurements were taken with the scattering vector along the sample normal, and here the (111) reflection dominates. In Figure 1b the sample was rotated by 54.74o about the incident beam so that the scattering vector probed along the [200] crystal orientation as defined for the [111] orientation aligned with the sample normal. Although both the (111) and (200) reflections can be seen in this geometry, there is an obvious enhancement of the (200) reflection (second set of peaks at higher q). These results are consistent with a textured film whose (111) orientation aligns along the sample normal. An unexpected finding is that while the (111) and (200) Pt peaks are close to their nominal values at a sampling angle of 54.74o to the sample normal, the (111) peak shifts to lower q (expanded lattice) when measured along the sample perpendicular. This feature is present in all the films and indicates an expanded lattice. It is not expected that the strain could be induced from the Cu with a smaller lattice spacing, but the effect of in-plane strain and of the substrate with which the Pt is also in contact with could also play a role.
In order to quantitatively separate the Co and Ni from the Cu and to determine whether they also have a fcc structure we obtained resonant diffraction data from NSLS beamline X6B at both the Co and Cu K-edges, which minimizes Co and Cu elastic scattering contributions, respectively. For these measurements we studied the thickest sample [0.3 Co0.6 Ni]12 exclusively and focused on the out-of-plane (111) peak region where the scattering was strongest. Figure 2 shows that there appears to be four distinct peaks in this region. Two of these correspond well to nominal Cu (111) at 3.01 Å-1 and to a mix of nominal Co and Ni (111) (which are nearly lattice matched and are assumed to have similar structure and texture) at 3.07 Å-1 to 3.09 Å-1. The peak between them can be explained by a CuCoNi intermediate region centered at Å-1 which forms a peak distinct from the bulk Cu and bulk CoNi. The fact that it is most prominent away from both the Cu and Co absorption edges indicates it contains the scattering from both elements. Finally, the lowest q peak at 2.98 Å-1 clearly decreases at the Cu K-edge (i.e. it involves Cu), does not change relative intensity when the photon energy is tuned to the Pt L3 edge (i.e. does not include Pt), and is unaffected by the total thickness of the Co and Ni layers. Thus, it is likely the result of strain on Cu by the Pt that has a slightly larger fcc lattice structure than bulk fcc Cu.
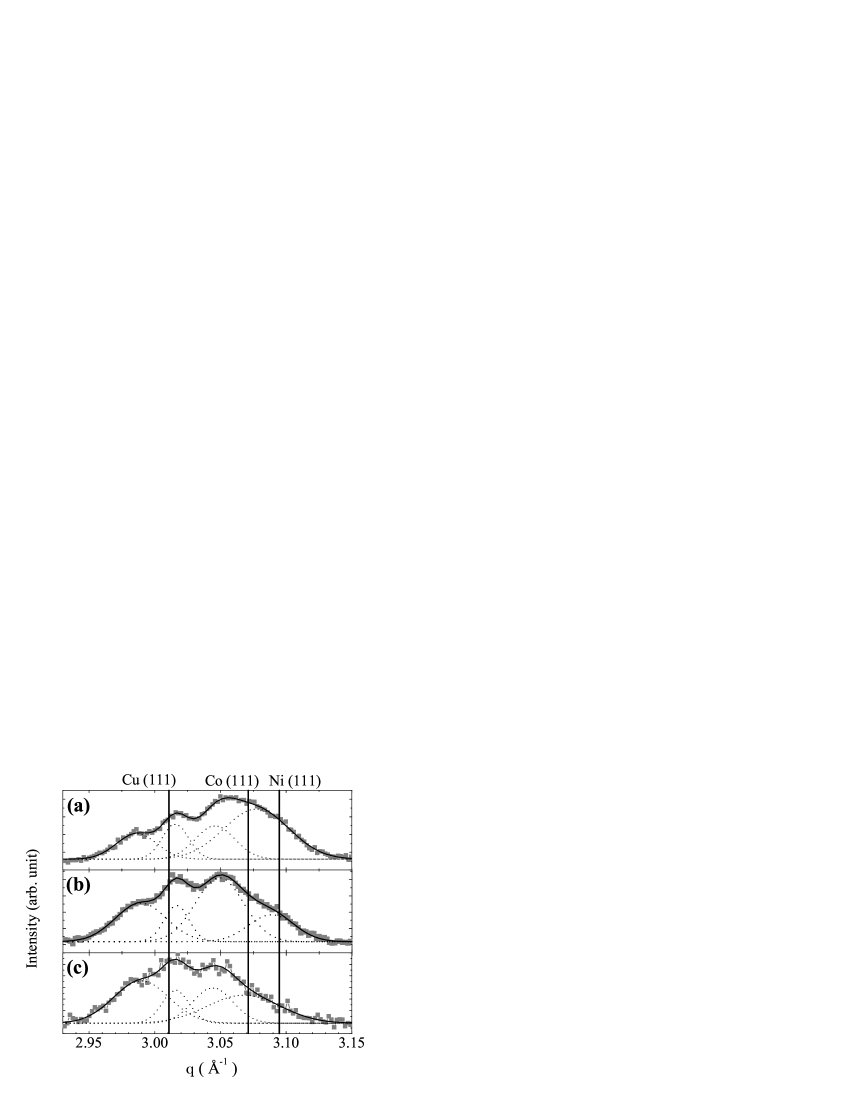
The question remains open as to whether the intermediate CuCoNi peak is indeed a single lattice-matched region, or comprised of yet more overlapping sub-peaks of slightly different lattice spacing. With the present data we cannot say with certainty which case is true. However, the fact that the center of this intermediate peak does not shift in reciprocal space when going from the Co to the Cu K-edge is an indication that both the Co and the Cu could be fully lattice matched here. A new, more analytical method based on resonance scattering has been developed to analyze just such situation, and will be reported in a forthcoming article.
2.2 Experimental technique
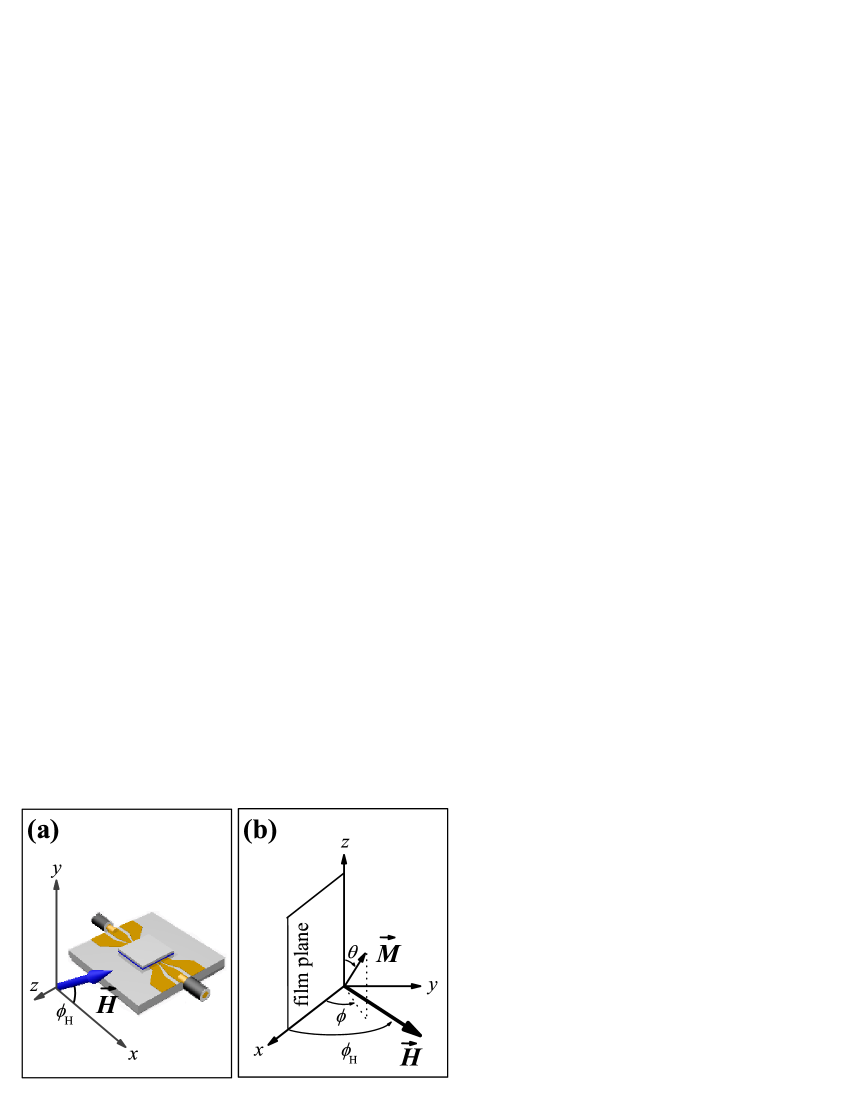
FMR measurements were conducted at room temperature employing a coplanar waveguide (CPW) as an ac magnetic field generator and inductive sensor barry . The CPW is made of a 200 nm thick Au film, deposited on a semi-insulating and polished 350 m thick GaAs wafer. The metallic layer was patterned using a bi-layer photolithographic process. The microwave device was designed to have a characteristic impedance of 50 above 4 GHz: the signal line is 50 m wide and is separated of the ground plate by a gap of 32 m. The CPW was placed into a brass cavity and connected directly to the ports of a Network Analyzer. Care was taken to avoid magnetic components in the cavity and in all contacts to the CPW. FMR spectra were measured by placing the magnetic sample metal face down on the CPW. For a fixed frequency (4 to 50 GHz), the external magnetic field was swept while measuring the S-parameters of the transmission line. The measurements were conducted with dc fields up to 10 kG. Figure 3a shows the geometry of the measurements. The applied field was monitored with a Hall probe sensor, and the calibration of the sensor was verified using electron paramagnetic resonance (EPR) on 2,2-diphenyl-1-picrylhydrazyl (dpph), a spin 1/2 system. The cavity was mounted on a rotating arm that enables FMR measurements in the parallel geometry ( in the film plane), in the perpendicular geometry ( normal to the film plane), and as a function of the angle of the dc field and the film plane. All measurements were performed with the applied field perpendicular to the ac magnetic field.
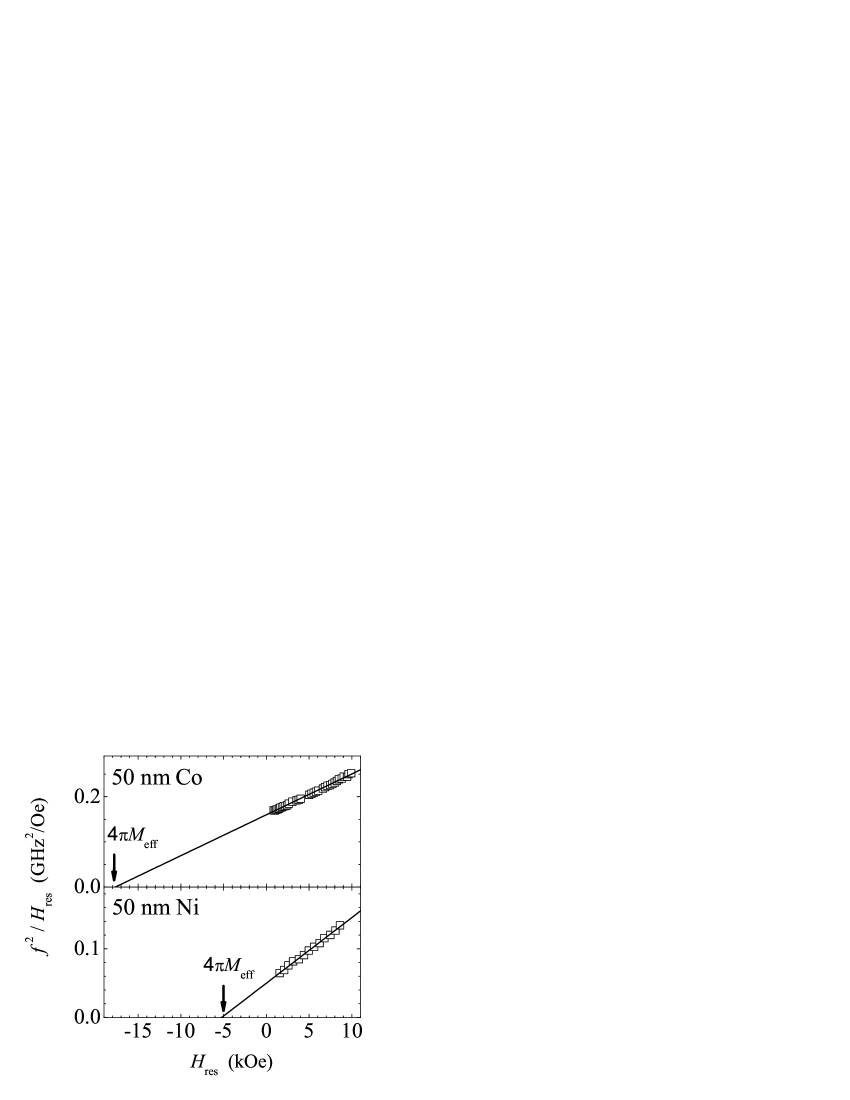
The FMR response of a 50 nm Co and of a 50 nm Ni film sputtered on Si-SiO2 substrates was measured (Figure 4). The magnetic layers have the same layer environment as the CoNi multilayers, with a 5 nm Pt10 nm Cu base layer and a 10 nm Cu5 nm Pt top layer. The frequency dependence of the resonance field in the parallel geometry is fitted to the Kittel formula kittel . For the 50 nm Co film, the estimated value of the magnetization density emu/cm3 and the measured g-factor agrees within 0.5% with the parameters of the bulk material, =1400 emu/cm3 and . For the film with 50 nm Ni, the experimental g-factor value is in good agreement with the literature value (), whereas the estimated magnetization density emu/cm3 is about 15% smaller than that of bulk Ni. Because fcc Co and Ni have about same lattice constant, Å colatticeparam and Å nilatticeparam respectively and same density (8.91 g/cm3), the magnetization density of [ Co Ni]N is determined from the average , hence emu/cm3. Note that the magnetic materials are immiscible at room temperature su . We assume that the magnetization density of the individual Co and Ni layers is thickness independent.
3 Theory
The geometry of the vectors is shown in Figure 3b. is the magnetization, is the applied magnetic field, and , and , are the angles associated with these vectors. The film is in the (x-z) plane. We assume that the Co and Ni layers are strongly ferromagnetically exchange coupled, and as a consequence the magnetization of the multilayer can be approximated as a macrospin. The applied field is chosen to remain in the (x-y) plane. For a polycrystalline film all directions in the film plane are equivalent, so will also remain in the (x-y) plane, hence . The total magnetic energy density of the system is given by the expression chappert :
| (1) |
The first and second term represent the Zeeman energy and the magnetostatic energy respectively. The last two terms are the uniaxial anisotropy energy, where and are the first and second order effective uniaxial anisotropies. and include the surface anisotropy (Néel-type) energy and the magneto-elastic anisotropy energy. The surface anisotropy originates from the broken symmetry at interfaces of the multilayer neel and the strain can be induced by the lattice mismatch between the layers. With our notation, positive values of the anisotropy constants favor magnetization normal to the film plane. For a given direction of the applied magnetic field, the equilibrium position of the magnetization is calculated from and is given by the relation:
| (2) |
where the effective demagnetization field is defined as:
| (3) |
If is not negligible, then is dependent on angle and for and positive is larger than .
3.1 Resonance field
From the Smit and Beljers formula vonsovskii , the resonance condition is:
| (4) |
where:
| (5) |
and
| (6) |
is the gyromagnetic ratio. For the the parallel geometry () and perpendicular geometry (), the resonance conditions are:
| (7) |
and
| (8) |
3.2 Linewidth and damping
It is common to express the frequency dependence of the full width at half maximum in the following form kittel :
| (9) |
describes an inhomogeneous broadening due to sample imperfections and is assumed to be independent of the frequency. The second term, known as the intrinsic linewidth, is proportional to the magnetic damping parameter and scales linearly with the frequency . By measuring the FMR signal at several frequencies, can be extracted from the slope of the curve . The intercept with the zero frequency axis gives .
4 Experimental data and discussion
4.1 Resonance field
Figure 5 presents typical normalized FMR peaks of a [0.2 Co0.4 Ni]12 multilayer for different field directions. The presence of a single resonance for all the three measurements geometries suggests that the multilayer behaves as a single magnetic film and that the macrospin picture is appropriate to describe the FMR response. The absorption lines were normalized by substracting the background signal and dividing by the relative change in transmission at resonance. The lineshape of the FMR curves is typically Lorentzian. We also observed asymmetric lineshapes at some frequencies, which we attribute to the mixing of the absorptive and dispersive components of the susceptibility patton , due to “poor” deembedding of the transmission line.

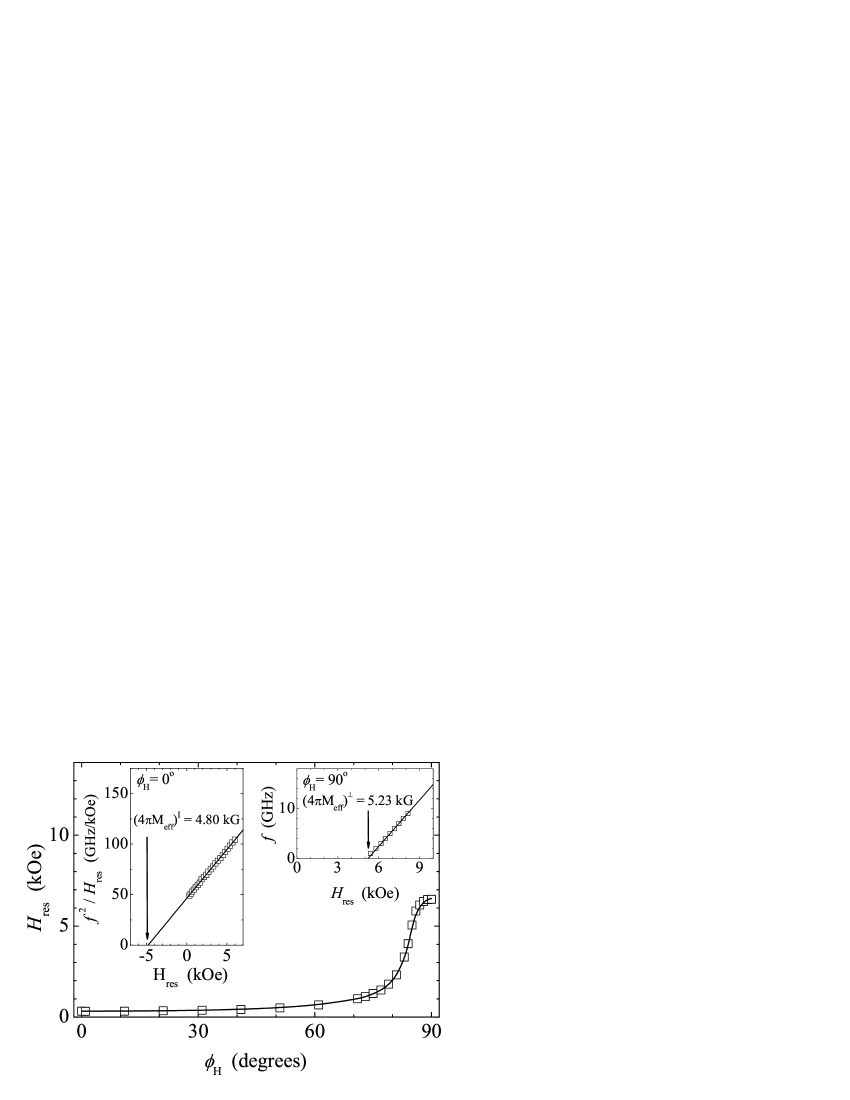
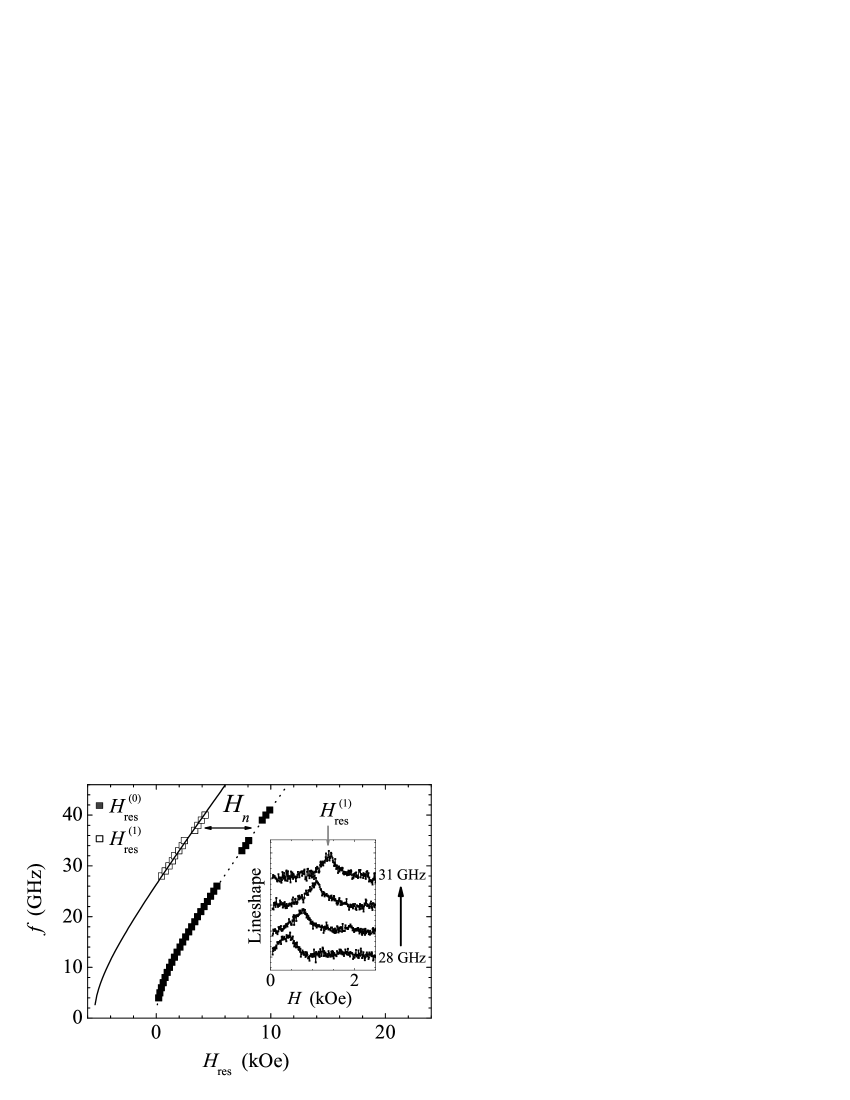
The frequency dependence of versus frequency for in-plane and normal to the plane field directions, and the angular dependence of the resonance field are shown in Figure 6. The effective demagnetization in the parallel geometry G and the g-factor are determined using Eq. 7 and the method described in section 2.2. Eq. 8 is used to fit versus in the perpendicular geometry with as the only fitting parameter, and with the assumption that the g-factor is isotropic. G is about 9% larger than . This provides evidence for a non-negligible second order anisotropy term. Using Eq. 7 and 8, the effective uniaxial anisotropy constants erg/cm3 and erg/cm3 are calculated. The extracted parameters are used to fit the angular dependence of . As shown in Figure 6, the fit (solid line) and the experimental data versus at GHz agree very well. In fact, we also found very good agreement with measurements conducted at 8 and 12 GHz. When comparing the fit and the experimental data, chi-square increases by a factor 2 when is set to zero. and are positive and which means that they favor the magnetization out of the film plane. Nevertheless, it is clear from the shape of the curve , where , that the preferential direction for the magnetization of the multilayer is in the film plane.
For frequencies above 25 GHz, an additional resonance peak is observed in the absorption line of the thickest magnetic multilayer [0.6 Co1.2 Ni] (inset of Figure 7). The frequency dependence of this resonance peak suggests that it is associated with a spin-wave resonance mode. The high-order resonance field and its amplitude are smaller than that of the uniform resonance mode. In a model proposed by Kittel kittel2 , the field splitting with respect to the uniform mode is described by , where is the exchange constant. If there is no pinning of the surface spins at the bottom and top interfaces then , where is the perpendicular standing spin wave number and is the total thickness of the magnetic film. Using a weighted value for the exchange constant of the CoNi multilayer with erg/cm tannenwald and erg/cm martin , we find , which corresponds to the surface spin wave of the 1st order. The Kittel model assumes that the magnetization density is uniform across the film thickness. Such a spin wave mode is therefore not expected to be observed with a uniform ac field since . Using approximations for the conductivity of the magnetic multilayer and its permeability at high field (off resonance), the ac field attenuation through the multilayer [0.6 nm Co1.2 nm Ni] is estimated to be about 3% at 30 GHz. We suspect that inhomogeneity of the ac field and the structural asymmetry of our CoNi multilayer film, with two different outer interfaces, CuCo and NiCu, can lead to , and excitation of spin-wave modes.
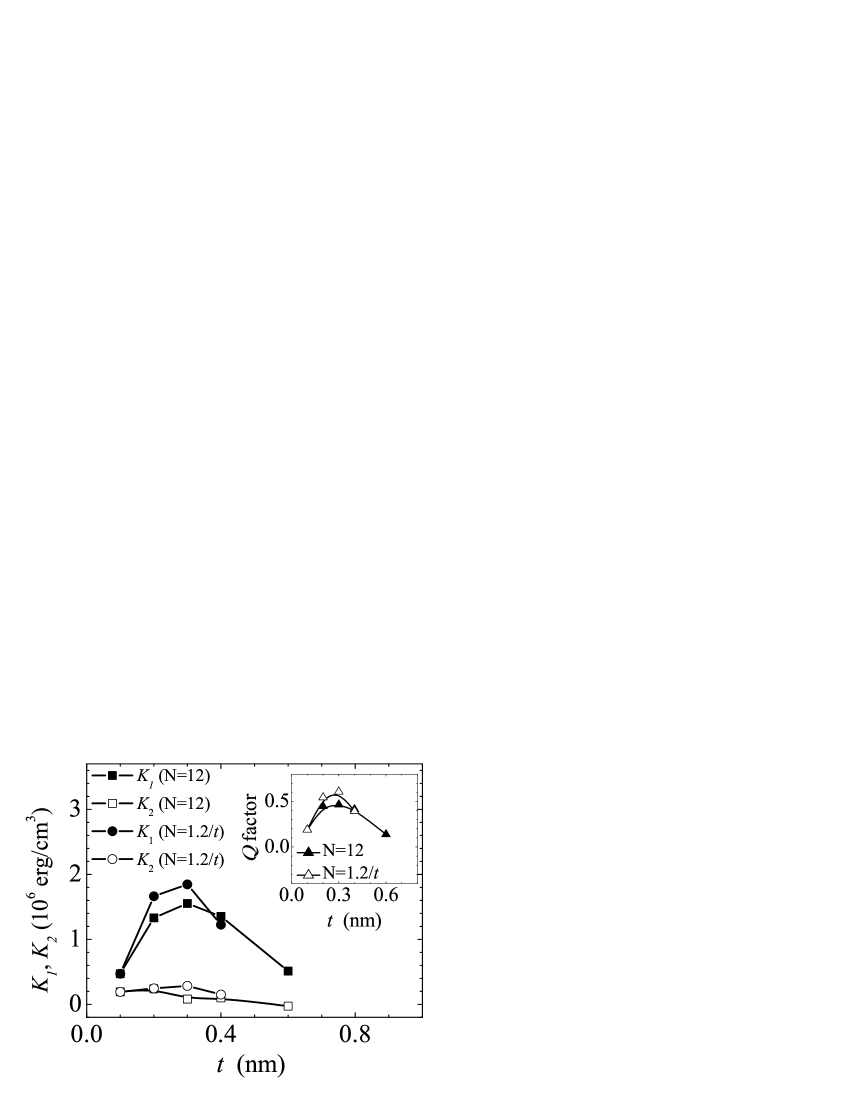
The thickness dependence of the effective anisotropy constants of the multilayers [ Co Ni] with 12 repeats and with 1.2/ repeats is shown in Figure 8. In the thickness range nm, is positive and greater than , and it exhibits a maximum value of about 1.8 erg/cm3. of the multilayers with 12 repeats increases by a factor 3 when decreases from 0.6 nm to 0.3 nm. The second order anisotropy term is negative for nm ( erg/cm3) and changes to positive values for smaller . For nm, and of multilayers of 12 and 1.2/ CoNi repeats have very similar dependence.
In Figure 9 the g-factor as a function of the thickness is presented. The Landé g-factor of the films with same magnetic layer thickness (3.6 nm) varies with in the same way as that of the multilayers with constant number of repeats. This suggests that does not depend on the total thickness of the multilayer, and it is the thickness of the Co and Ni layers that induces the change in . The dashed line in Figure 9 shows the calculated value of the g-factor of the multilayers based on a geometric average wangsness :
| (10) |
Using the values found for the 50 nm Co and 50 nm Ni films, we find .
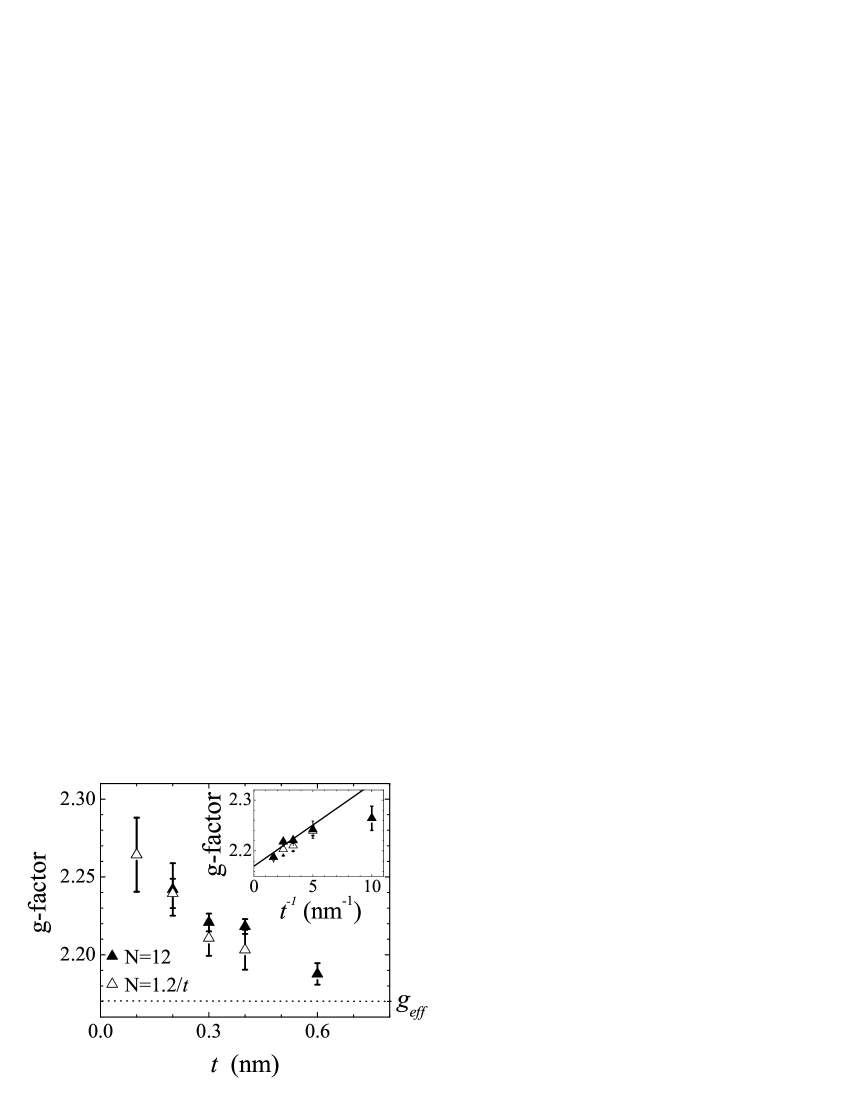
The inset Figure 9 shows versus . The data points fall on a line for nm. The intercept of the linear fit with the =0 axis gives which agrees with the value of . A similar linear fit for the film with N=() gives .
4.2 Discussion of resonance field
In the study of magnetic films with large PMA, the dimensionless quality factor is often used as a figure of merit. is defined by the ratio of the uniaxial anisotropy to the demagnetizing energy. In the limit that the PMA field overcomes the demagnetization field, the normal to the film plane becomes the axis of easy magnetization and . The inset of Figure 8 shows the dependence of as a function of . The quality factor of the CoNi sputtered multilayers does not exceed 0.7. The magnetization of the films remains preferentially in the film plane, in contrast to what has been observed for evaporated multilayers of the same Co:Ni thickness ratio bloemen . The result can be in parts explained by the crystallographic growth direction of the underlayer that does not promote a highly textured (111) film. The diffraction pattern of the multilayers exhibit a (111) Pt peak, but also a peak that corresponds to Pt (200). Zhang conducted XRD and magnetometry measurements on sputtered CoNi grown on Au and Ag base layer zhang . The authors found that only the multilayers grown on Au have the magnetization easy axis normal to the film plane. The XRD study showed that the Ag (111) intensity peak is 10 times smaller than that of Au (111), with the presence of a second peak of intensity corresponding to Ag (200).
The magneto-elastic contribution arises from the strain induced by the lattice mismatch between adjacent layers. The largest strain originates from the lattice mismatch at the CuCo interface where %, compared to 0.6% at the CoNi interface. The anisotropy constants of the films with same multilayer thickness depends strongly on . Therefore, the interfaces CuCo and NiCu do not appear to play a significant role in the dependence of the anisotropy constants. Consequently, the variation of the anisotropies with is associated with the CoNi interfaces, as predicted by Daalderop et al. daalderop . From ab-initio calculations, the authors found that in the multilayers, the interface anisotropy is controlled by d-state occupancy near the Fermi level at the CoNi interface. The presence of an optimum thickness for large value can be understood as follows. With increasing , the number of CoNi interfaces per unit volume decreases and decreases. In the limit of very small , the magnetic layers are not uniform. The multilayer breaks down into an alloy-type structure and decreases.
The g-factor is related to the ratio of the orbital to spin moments by farle , hence one deduces that increases by 3.4% when is decreased from 0.6 nm to 0.1 nm. This enhancement depends on the thickness of the individual Co and Ni layers. Significant increase of the ratio , up to 40% have been reported for ultrathin FM in contact with a NM mulmus . The enhancement was attributed to the breaking of the symmetry at the interface, where the orbital moment of the surface/interface atoms is enhanced compared to that of the bulk atoms.
4.3 Linewidth and magnetic damping
The linewidth was studied as a function of frequency in the parallel and the perpendicular geometry. Figure 10 shows typical data for [0.2 nm Co0.4 nm Ni] multilayer.

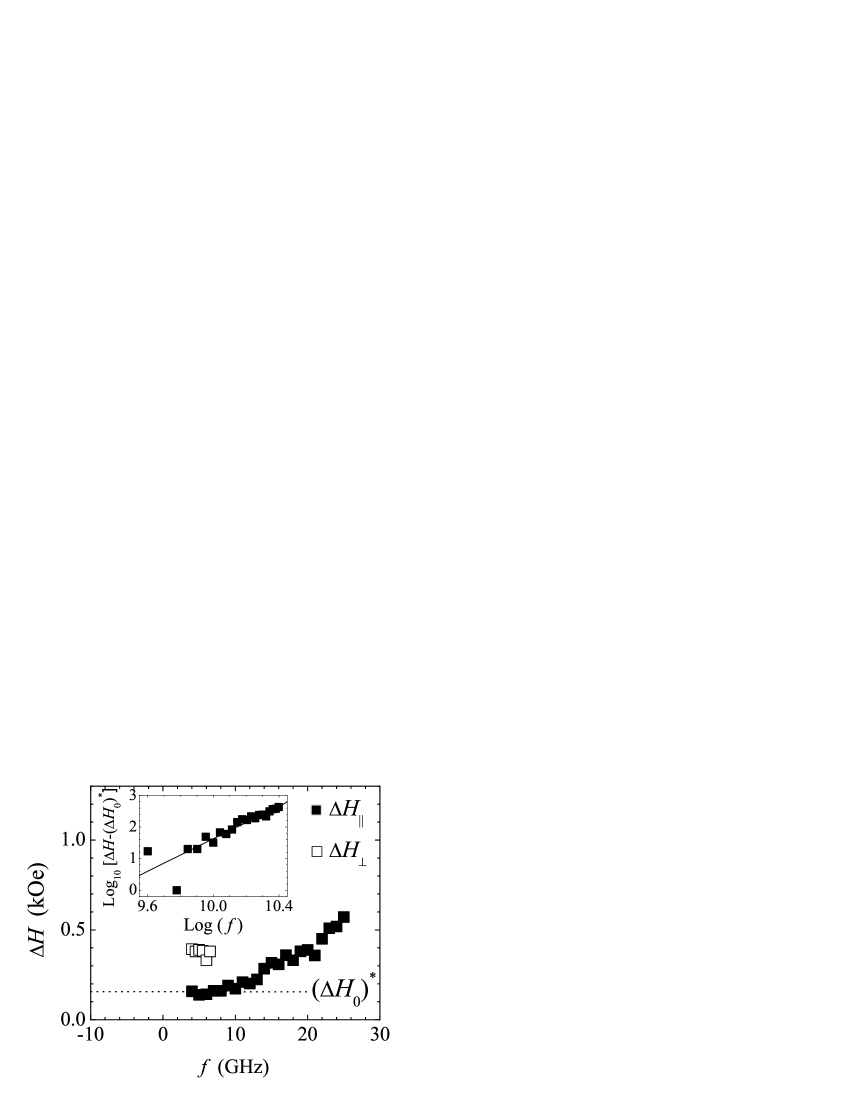
The linewidth in the parallel geometry and in perpendicular geometry follows similar frequency dependence, and increases with frequency. is slightly larger than at low frequencies (4-6 GHz), which we attribute to a small misalignment of the applied field with the normal to the film plane. Exchange narrowing can also lead to hurdequint . in the parallel geometry depends linearly on frequency, with a zero frequency offset. The inhomogeneous broadening Oe and the damping parameter are extracted from the best linear fit (Eq. 9). Note that the inhomogeneous ac field due to the finite width of the transmission line can lead to the broadening of the linewidth counil . The additional linewidth increases with the magnetic film thickness and is inversely proportional to the frequency. For the thickest magnetic multilayer ( nm), we estimate the additional linewidth at 5 GHz to be less than 1 of the measured linewidth. Spin wave contributions to the linewidth from the CPW geometry can therefore be neglected. The dependence of versus frequency is linear for most samples. Only the thinnest film [0.1 nm Co0.2 nm Ni] exhibits a non linear dependence on frequency so that and could not be determined (Figure 11). A linear fit of as a function of frequency in a Log10-Log10 plot scale gives with . The behaviour might originate from two-magnon scattering contribution to the linewidth induced by the film roughness. Indeed, Twisselmann et al. found that a 64 nm Py film grown on a highly oriented roughness shows a non linear in-plane linewidth frequency dependence, when the dc field is applied perpendicular to the scratches twisselmann .
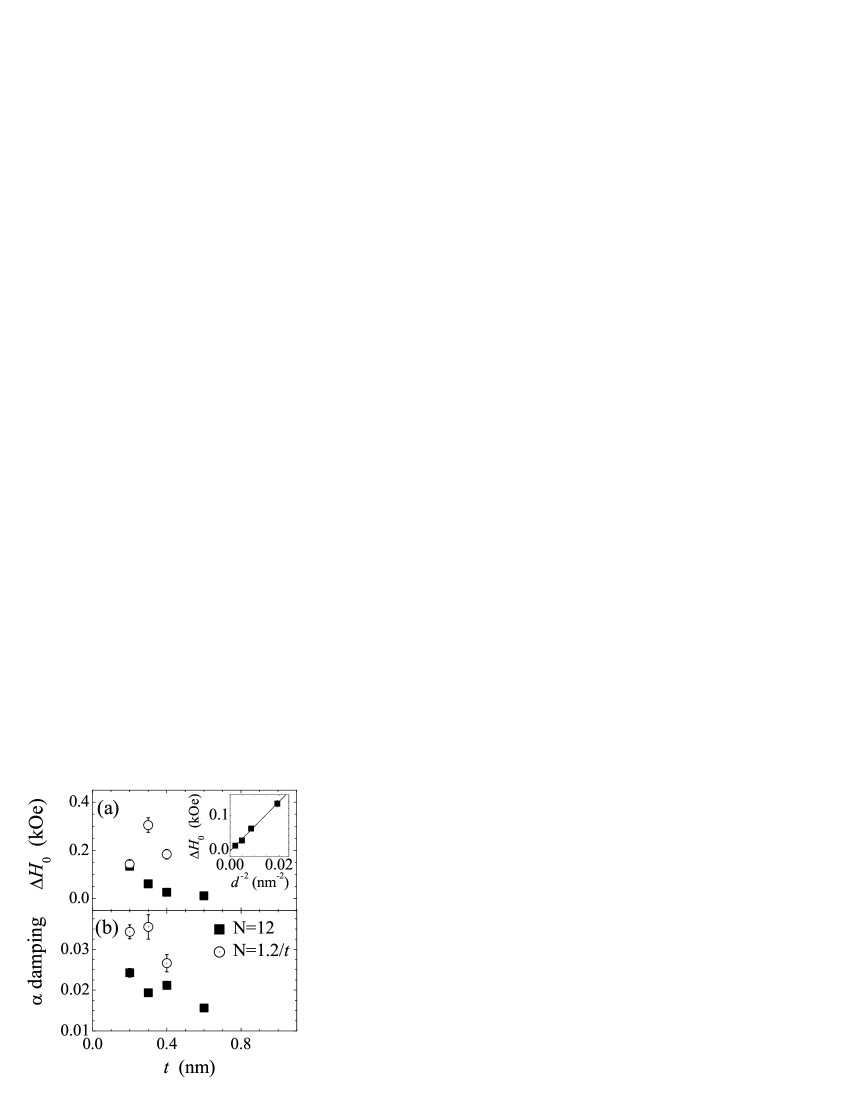
The magnetic damping parameter and the extracted inhomogeneous contribution to the linewidth of the multilayers is shown in Figure 12. and of the films with N=12 increases monotonically with decreasing . The thickness dependence of of the films with is not clear. The inset of Figure 12a shows as a function of , where is the total thickness of the magnetic multilayer. The extrinsic contribution to the linewidth increases linearly with . The damping of the films with and 0.3 nm and thickness 3.6 nm is 40% larger than that of the film with nm. The largest damping values are found for the films 3.6 nm thick, which are the thinnest magnetic multilayers.
4.4 Discussion of Enhanced Damping
The enhancement of the magnetic damping constant in thin magnetic films can originate from several mechanisms. It is generally believed that the spin-orbit interaction in a ferromagnet, which couples the spin to the lattice, plays a dominant role in the damping mechanism. The following expression was theoretically derived elliott :
| (11) |
where is the deviation of the Landé g-factor from the free electron value 2.0023 and G is the Gilbert damping constant defined by G. Figure 13 shows the Gilbert damping constant versus for the two series of multilayers. For a given Landé g-factor value, the damping is largest for the film 3.6 nm thick.
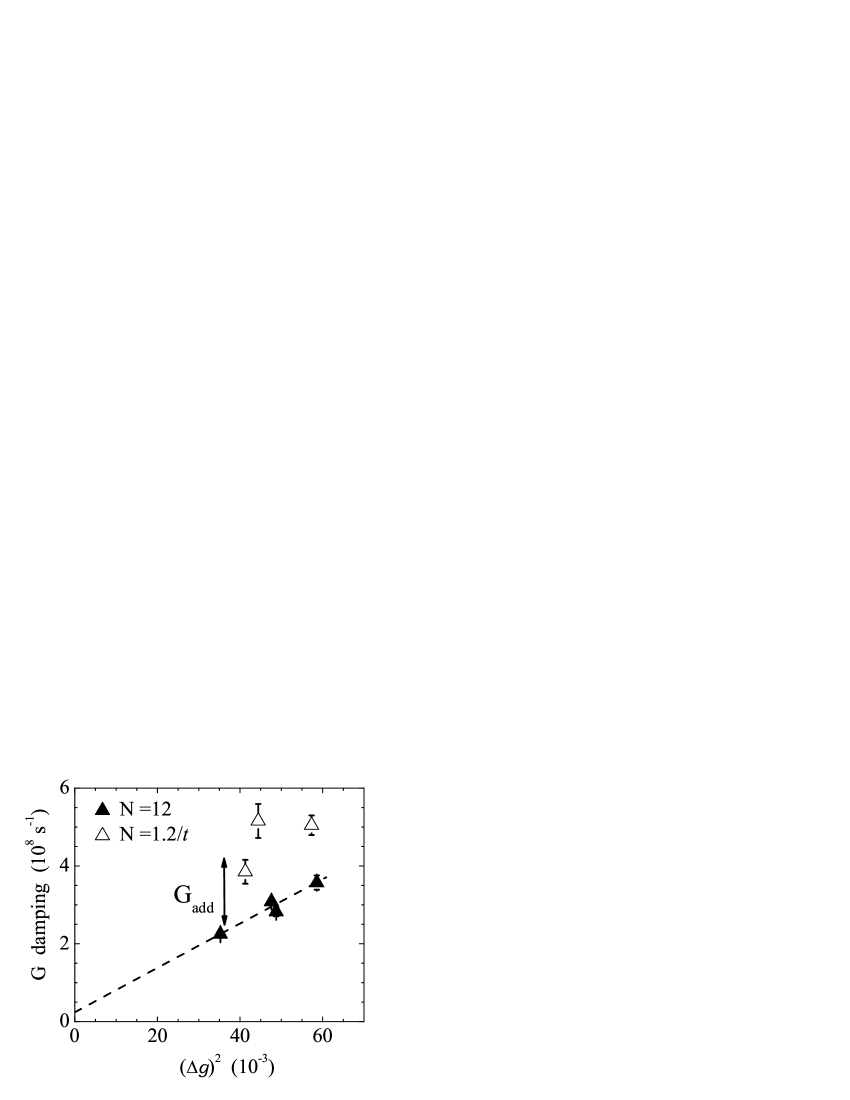
A mechanism that can explain the enhanced Gilbert damping in the 3.6 nm thick multilayer films is the spin-pumping tserkovnyak2 . The precessing magnetization of the CoNi multilayers generates a spin current that flows through the adjacent Cu layers and relaxes in Pt, a strong spin scatterer. As a consequence, the damping is enhanced. For a symmetric structure where the FM is embedded between NM2NM1 bilayers, the enhanced damping is:
| (12) |
is the residual damping (bulk) and the second term represents the additional damping from spin pumping where is the effective spin mixing conductance. Eq. 12 is valid when the NM2 is a perfect spin sink and the thickness of the NM1 is much smaller than the spin diffusion length of the material. Pt is known to act as a perfect spin sink and the Cu layer of 10 nm is much thinner than the spin diffusion length at room temperature nm jedema . The additional damping induced by spin pumping effect in the 3.6 nm film is the difference between G of the thickest multilayer film (21.6 nm) and that of the 3.6 nm films (Figure 13). Using an average value for the g-factor, we obtain . The effective spin mixing conductance of sputtered Co layer embedded between PtCu bilayer was found to be cm-2 beaujour2 . The additional damping computed using Eq. 12 is . This is in the range of the value found using the experimental data.
5 Conclusion
This FMR study on several sputtered Co Ni multilayers shows in-plane preferential orientations, and also perpendicular effective anisotropy as large as erg/cm3. We have provided evidence that to understand the frequency dependence and angular dependence of the resonance field, second order anisotropy terms have to be considered. The Landé factor increases with decreasing and the enhancement depends on the thickness of the individual Co and Ni layers. The thickness dependence of is explained in terms of the lowering of the symmetry at the CoNi interface. The extrinsic and the intrinsic contribution to the FMR linewidth increases with decreasing thickness of the individual layers. follows a 1/ dependence. The enhancement of the magnetic damping is attributed to the increase of spin-orbit interaction and to the spin-pumping. In order to clarify this point it would be interesting to study similar magnetic multilayers without the Pt layers. Indeed, without adjacent layers with strong spin-orbit scattering, the additional damping is expected to be weak.
The possibility to tune the easy plane anisotropy by changing the thickness of the individual magnetic layers makes the CoNi multilayer an interesting magnetic structure to be integrated in spin-transfer devices. In addition, the damping while larger than that of Permalloy is similar to that of Co ultrathin films. It would also be interesting to compare the high frequency dynamics of films grown with different underlayers and deposition methods.
Acknowledgements.
We thank Dr. G. de Loubens for fruitful discussions. This research is supported by NSF-DMR-0405620. Use of the National Synchrotron Light Source, Brookhaven National Laboratory, was supported by the U.S. Department of Energy, Office of Science, Office of Basic Energy Sciences, under Contract No. DE-AC02-98CH10886.References
- (1) see, for example, J. A. Katine, F. J. Albert, and R. A. Buhrman, E. B. Myers, and D. C. Ralph, Phys. Rev. Lett. 84, 3149 (2000) ; B. Öezyilmaz, A. D. Kent, D. Monsma, J. Z. Sun, M. J.Rooks, and R. H. Koch, Phys. Rev. Lett. 91, 067203 (2003).
- (2) Y. Tserkovnyak, A. Brataas, G. E. W. Bauer, Phys. Rev. B 66, 224403 (2002).
- (3) B. Heinrich, Y. Tserkovnyak, G. Woltersdorf, A. Brataas, R. Urban, and G. E. W. Bauer, Phys. Rev. Lett. 90, 187601 (2003) ; J. Z. Sun, B. Öezyilmaz, W. Y. Chen, M. Tsoi, and A. D. Kent, J. Appl. Phys. 97, 10C714 (2005).
- (4) J-M. L. Beaujour, J. H. Lee, A. D. Kent, K. Krycka and C-C. Kao, Phys. Rev. B 74, 214405 (2006).
- (5) J. Z. Sun, Phys. Rev. B 62, 570 (2000).
- (6) A. D. Kent, B. Öezyilmaz, and E. del Barco, Appl. Phys. Lett. 84, 3897 (2004).
- (7) S. Mangin, D. Ravelosona, J. A. Katine, M. J. Carey, B. D. Terris, E. E. Fullerton, Nature Materials 5 (3), 210 (2006).
- (8) G. H. O. Daalderop, P. J. Kelly and F. J. A. de Broeder, Phys. Rev. Lett. 68, 682 (1992).
- (9) W. Barry, I.E.E.E Trans. Micr. Theor. Techn. MTT 34, 80 (1996).
- (10) see, for example, D. L. Mills and S. M. Rezende in Spin Dynamics in Confined Magnetic Structures II (Eds. B. Hillebrands and K. Ounadjela), pp. 27-58, (Springer, Heidelberg 2002).
- (11) E. A. Owen and D. Madoc Jones, Proc. Phys. Soc. B 67, 456 (1954).
- (12) X. D. Liu, H. Y. Zhang, K. Lu and Z. Q. Hu, J. Phys.: Condens. Matter. 6, L497 (1994).
- (13) C. W. Su, Y. D. Yao, C. S. Shern, J. Magn. Magn. Mater. 282, 84 (2004).
- (14) C. Chappert, K. Le Dang, P. Beauvillain, H. Hurdequint, D. Renard, Phys. Rev. B 34 (5), 3192 (1986).
- (15) L. Néel, J. Phys. Radium 15, 225 (1954).
- (16) S. V. Vonsovskii, Ferromagnetic Resonance (Pergamon, Oxford), (1966).
- (17) S. S. Klarickal, P. Krivosik, M. Wu, C. E. Patton, M. L. Schneider, P. Kabos, T. J. Silva, J. P. Nibarger, J. Appl. Phys. 99, 093909 (2006).
- (18) C. Kittel, Phys. Rev. 110, 1295 (1958).
- (19) P. E. Tannenwald, Phys. Rev. 121, 715 (1961).
- (20) D.H. Martin, Magnetism in Solids (Iliffe books, London), (1967) p.67.
- (21) R. K. Wangsness, Phys. Rev. 91, 1085 (1953).
- (22) P. J. H. Bloemen, W. J. M. de Jonge and F. J. A. den Broeder, J. Appl. Phys. 72, 4840 (1992).
- (23) Y. B. Zhang, P. He, J. A. Woollam, J. X. Shen, R. D. Kirby and D. J. Sellmyer, J. Appl. Phys. 75, 6495 (1994).
- (24) M. Farle, Rep. Prog. 61, 755 (1998) and ref. therein.
- (25) M. Tischer, O. Hjortstam, D. Arvanitis, J. H. Dunn, F. May, K. Baberschke, J. Trygg, J. M. Wills, B. Johansson and O. Eriksson, Phys. Rev. Lett. 75 (8), 1602 (1995) ; A. Hahlin, J. H. Dunn, O. Karis, P. Poulopoulos, R. Nüthel, J. Lindner and D. Arvanitis, J. Phys.: Condens. Matter. 15, S573 (2003).
- (26) H. Hurdequint, J. Magn. Magn. Mater. 242-245, 521 (2002).
- (27) G. Counil, J-V. Kim, T. Devolder, C. Chappert, K. Shiegeto and Y. Otani, J. Appl. Phys. 95 (10), 5646 (2004).
- (28) D. J. Twisselmann and R. D. McMichael, J. Appl. Phys. 93, 6902 (2003).
- (29) R. Elliott, Phys. Rev. 96, 266 (1954).
- (30) Y. Tserkovnyak, A. Brataas, G. E. W. Bauer, B. I. Halperin, Rev. Mod. Phys. 77, 1375 (2005).
- (31) F. J. Jedema, A. T. Filip, and B. J. van Wees, Nature (London) 410, 345 (2001).
- (32) J.-M. L. Beaujour, W. Chen, A. D. Kent, and J. Z. Sun, J. Appl. Phys. 99, 08N503 (2006).