Properties of the multicritical point of Ising spin glasses on the square lattice
Abstract
We use numerical transfer-matrix methods to investigate properties of the multicritical point of binary Ising spin glasses on a square lattice, whose location we assume to be given exactly by a conjecture advanced by Nishimori and Nemoto. We calculate the two largest Lyapunov exponents, as well as linear and non-linear zero-field uniform susceptibilities, on strip of widths sites, from which we estimate the conformal anomaly , the decay-of-correlations exponent , and the linear and non-linear susceptibility exponents and , with the help of finite-size scaling and conformal invariance concepts. Our results are: ; ; ; . A direct evaluation of correlation functions on the strip geometry, and of the statistics of the zeroth moment of the associated probability distribution, gives , consistent with the calculation via Lyapunov exponents. Overall, these values tend to be inconsistent with the universality class of percolation, though by small amounts. The scaling relation (with space dimensionality ) is obeyed to rather good accuracy, thus showing no evidence of multiscaling behavior of the susceptibilities.
pacs:
75.50.Lk,05.50.+qI INTRODUCTION
The critical behavior of Ising spin glasses has been the subject of intensive investigation in the recent past nish01 . A number of results have been derived, both analytically and numerically; however, many aspects of interest have not been fully elucidated so far. Among these are the properties of the multicritical point which is known to exist for suitably low concentrations of antiferromagnetic interactions, even for two-dimensional lattices in which a spin glass phase is not expected to occur at non-zero temperatures.
Here we consider binary () spin glasses, i.e., we assume that Ising spin- magnetic moments interact via nearest-neighbor couplings of equal strength, and whose signs are given by the quenched probability distribution:
| (1) |
In this case, the phase diagram on the temperature-concentration () plane exhibits a critical line which, for low concentrations of antiferromagnetic bonds, separates ferro- and paramagnetic phases nish01 ; prl87_047201 . As decreases, so does the transition temperature. Below a critical concentration , ferromagnetic order disappears, and a spin glass phase emerges at . For space dimensionality , the spin glass phase extends to finite temperatures as well. The Nishimori line (NL) is a special line on the plane, defined by:
| (2) |
On this line, several exact results have been obtained nish01 . In particular, the configurationally averaged internal energy is an analytical function of , even at the multicritical point (the Nishimori point, NP) where the NL crosses the ferro-paramagnetic phase boundary prl61_625 . Furthermore, the NL is invariant under renormalization-group transformations, so the NP corresponds to a fixed point. Numerical work in two-dimensional systems jpa35_8171 shows that internal-energy fluctuations along the NL go through a maximum at the NP, thus indicating that the latter indeed marks a change in the behavior of the distribution of frustrated plaquettes. This, in turn, is consistent with the picture that the phase transition at the NP is of geometry-induced nature jpa35_8171 (though not necessarily in the same universality class of random percolation).
Recently it was predicted jpsp71_1198 ; jpa36_9799 that, on a square lattice, the NP should belong to a subspace of the plane which is invariant under certain duality transformations. For Ising systems the invariant subspace is given by jpsp71_1198 ; jpa36_9799
| (3) |
The intersection of Eqs. (2) and (3) gives the conjectured exact location of the NP, namely , , to be referred to as CNP. In previous work prl87_047201 ; prb60_6740 ; pre65_026113 , approximate estimates for the location of the NP were used in the calculation of the associated critical exponents, with the overall conclusion that the transition there does not belong to the universality class of random percolation. A numerical study of correlation-function statistics at the CNP dqrbs03 points to a similar picture.
Extensions of the conjecture to triangular and honeycomb lattices have been proposed jpa38_3751 ; jpsp75_034004 , and verified by numerical studies to a fairly good degree of accuracy prb73_064410 . Evidence thus far available indicates that the critical properties of the NP in two-dimensional Ising systems are universal in the expected (i.e., lattice-independent) sense prb73_064410 , though they belong to a distinct universality class from that of percolation.
Here we use numerical transfer-matrix methods, together with finite-size scaling and conformal invariance concepts, to investigate critical properties of the NP of Ising spin glasses, on long strips of a square lattice. We shall assume the location of the multicritical point to be that of the CNP given above. Indeed, previous work (see Ref. dqrbs03, and references therein) strongly indicates that, even though the conjecture may turn out not to be exact, it is certainly a very good approximation to the actual position of the NP.
In Section II we evaluate the central charge, or conformal anomaly prl56_742 . As this is given by the coefficient of the finite-size correction to a bulk quantity (the critical free energy) which is itself not known exactly for the present case, one has many sources of uncertainty to contend with, not to mention those intrinsic to the sampling of quenched disorder configurations. By working at the CNP, we attempt to eliminate one such source which is the location of the critical point. In the absence of further exact results, whether or not such choice in fact introduces systematic distortions can only be found by comparative analysis of numerical data pertaining to the problem. In Section III we calculate the decay-of-correlations exponent related to the zeroth moment of the correlation-function probability distribution, both via the difference between the two largest Lyapunov exponents, and by direct evaluation of correlation functions as done in earlier work prl87_047201 ; prb60_6740 ; dqrbs03 . This, together with the use of pertinent conformal-invariance relationships, yields further independent evidence related to the universality properties of correlations at the NP. In Section IV, both linear and non-linear zero-field susceptibilities are investigated. While the former have been evaluated previously for square prb60_6740 , as well as triangular and honeycomb prb73_064410 , lattices, no results for the latter appear to be available. As explained below, the scaling of non-linear susceptibilities may give indications of multiscaling behavior. Finally in Section V, concluding remarks are made.
II Free energy and central charge
We consider strips of width sites and periodic boundary conditions across. For consistency with earlier work prb60_6740 , we used only even widths, in order to accommodate possibly occurring unfrustrated antiferromagnetic ground states (though later results showed in practice that, at least for the relatively low concentrations of antiferromagnetic bonds around the NP, no noticeable distortions arise when odd values of are considered as well prl87_047201 ; prb73_064410 ). Appropriate sampling of quenched disorder is produced by using strip lengths , along which bond configurations are drawn from the distribution Eq. (1). The configurationally-averaged (negative) free energy (in units of ) is given by
| (4) |
where is the largest Lyapunov characteristic exponent prmsp , extracted from the product of transfer matrices which connect site columns and , i.e.,
| (5) |
where is an arbitrary initial vector of unit modulus. Higher-order exponents may be obtained through iteration of a set of initial vectors , orthogonal both mutually and to , with adequate reorthogonalization every few steps, to avoid contamination prmsp .
In our calculations we have used . The uncertainty related to the finite number of terms in Eq. (5) is estimated as follows. In order to avoid transient effects, the first iterations are discarded. Accumulated averages are evaluated and stored, for each subsequent iterations. From this set of averages, one then calculates global averages and their corresponding fluctuations. In our study, we have always made use of a canonical distribution of disorder, that is, the and couplings are randomly extracted from a reservoir which initially contains exactly as many of each as given by Eq. (1), with the value of corresponding, e.g., to the CNP. This way, sample-to-sample fluctuations are considerably reduced. Final estimates of the free energy and other quantities of interest have been extracted from arithmetic averages for distinct disorder realizations.
The conformal anomaly, or central charge , which characterizes the universality class of a conformally-invariant model at the critical point, can be evaluated via the finite-size scaling of the free energy on a strip with periodic boundary conditions across prl56_742 ,
| (6) |
where is a regular term which corresponds to the bulk system free energy. For disordered systems, Eq. (6) is expected to hold, with the (configurationally-averaged) free energy given by Eq. (4), and taking the meaning of an effective conformal anomaly npb285_687 .
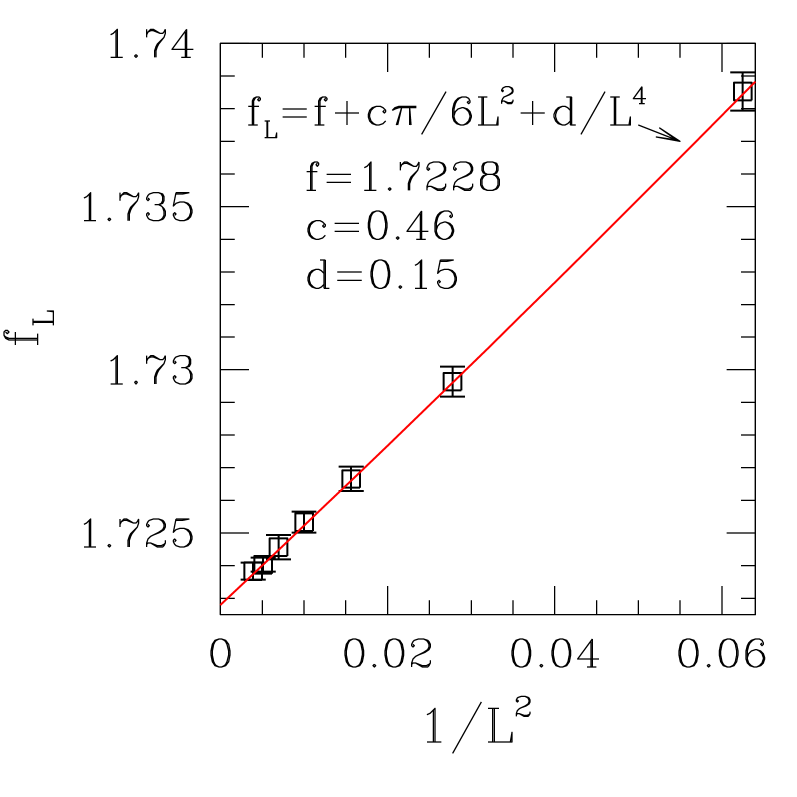
For our estimates of the effective central charge, we set and corresponding to the CNP, and took averages of the free energy over three independent realizations. Figure 1 shows the free energy at the CNP for , against . A linear least-squares fit of the data gives . This is close to, but some off, the result given in Ref. prl87_047201, , , which presumably was taken at those authors’ own estimate of the location of the NP, . On the other hand, the above result is compatible with the value corresponding to percolation in the Ising model, namely npb515_701 .
Incorporating curvature via the correction, as suggested by Eq. (6), results in the same (to within ) as in the linear extrapolation. However, the conformal anomaly estimate is changed to , which encompasses the result quoted in Ref. prl87_047201, but appears incompatible with Ising-model percolation. Earlier work in pure dq00 and unfrustrated random-bond npb515_701 ; dq95 Ising systems indicates that, for a square lattice, the term provides a important contribution towards stability and accuracy of free-energy extrapolations (note, however, that here the curvature effect is imperceptible to the naked eye, see Figure 1). Should the same trend hold in the present case, would appear to be the most reliable of the two estimates produced here.
III The exponent
As a consequence of the preservation of conformal invariance at a second-order phase transition, the correlation length on a strip geometry with periodic boundary conditions across (calculated at the critical point of the corresponding bulk two-dimensional system) is connected to the decay-of-correlations exponent , by the relationship jpa17_L385
| (7) |
For strips of homogeneous spin systems, the inverse of the dominant correlation length (related to the slowest-decaying critical correlations) is given by the first spectral gap of the transfer matrix nig90 . A straightforward adaptation for disordered cases can be devised through the replacement of pure-system eigenvalues by their counterparts in a disordered environment, namely the Lyapunov characteristic exponents prmsp ; npb515_701 ; nig90 . One can then calculate the correlation length (and thus the exponent from Eq. (7)), via
| (8) |
where , are, respectively, the largest and second-largest Lyapunov exponents.
In the present case, the dominant correlations are ferromagnetic, and the Hamiltonian is invariant under global spin inversion. Therefore, in order to calculate (), it is sufficient to iterate () which is even (odd) under that same symmetry nig90 ; glaus87 , with no need for decontamination of the iterates of .
Before going further, one must recall that correlation functions at the NP are multifractal prl87_047201 ; pre65_026113 ; dqrbs03 ; prb73_064410 ; mc02a ; mc02b . In other words, the rate of decay (against distance ) of the moments of assorted orders, , of the correlation-function distribution is regulated by a set of exponents , which are not connected by a single gap exponent, as is the case for pure systems where . The exponent estimated via Eqs. (7) and (8) is in fact , which characterizes the zeroth–order moment of the correlation-function distribution, i.e. it gives the typical, or most probable, value of this quantity (see, e.g., Ref. dq97, and references therein). One has, in the bulk,
| (9) |
By evaluating estimates of for the range of strip widths within reach of our computational facilities, we can, in principle, extrapolate the sequence to , this way presumably accounting for higher-order finite-size corrections to Eq. (7). Earlier results for pure systems dq00 again indicate that is a convenient variable against which to set up an extrapolation scheme.
We can also calculate correlation functions directly on a strip, as done in Refs. prl87_047201, ; dqrbs03, ; prb73_064410, , and examine the behavior of their zeroth-order moment against distance, from which the appropriate correlation length can be extracted and plugged back into Eq. (7). Note that negative values of the correlation function will be present upon sampling; this is not an unsurmountable obstacle for the calculation of logarithmic averages here, as it is known that the distribution at the NP is sharply peaked close to unity dqrbs03 . Consequently, one can deal instead with absolute values, as can seen by recalling that a logarithmic average is the same as the logarithm of a geometric mean: as long as the overall sign of the product of all terms is positive (which we have reason to believe here), it does not matter that some (few) are negative.
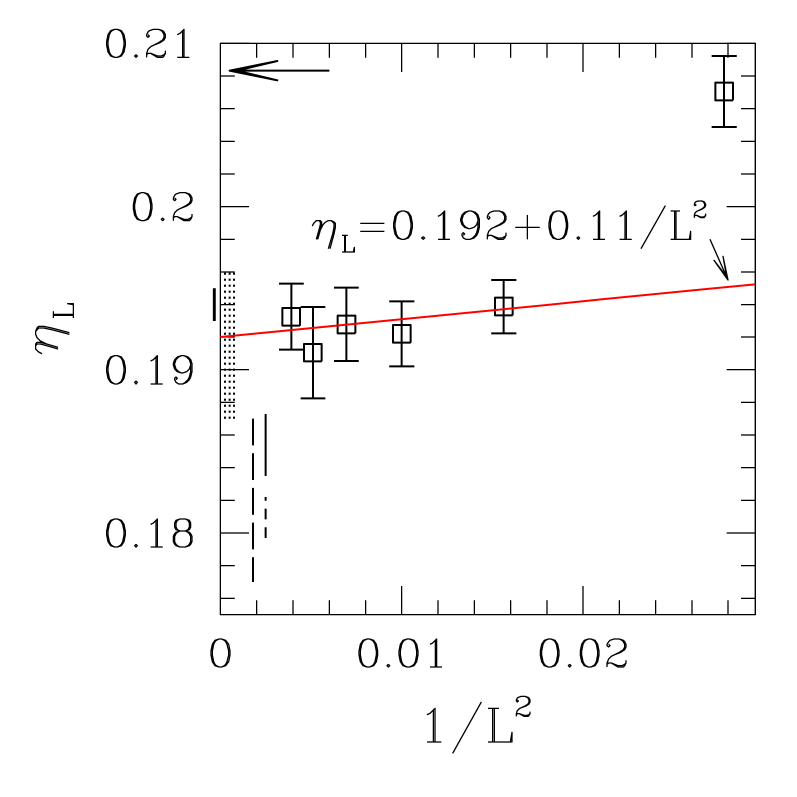
In Figure 2, we present calculated via Eqs. (7) and (8), against . On increasing from (not shown) to , there is a decreasing trend in which appears to halt, and turn to a roughly independent behavior, when values corresponding to larger are considered. Given the circumstances, the safest course of action is (i) to assume that the approximately constant behavior will not change significantly for larger outside our computational capability range, and (ii) to extrapolate the data at hand in as simple a manner as possible, treating the results with a large dose of skepticism.
From a linear least-squares fit of data against , shown in Figure 2, we get a central extrapolated estimate . By considering the error bars associated to finite-size estimates, it appears that any value in the range (the extent of the shaded area in the Figure) would be plausible.
We also evaluated correlation functions directly, and estimated the zeroth moment of their probability distribution. Following Ref. dqrbs03, , we used , and strip length columns; we found that the best set of results was for correlations calculated along the strip, for distances ; when plotted on a semi-logarithmic scale, our data show slight curvature for , and set in to a very good straight line for , from which one gets (shown in the Figure, as a thick bar immediately to the left of the vertical axis) via Eq. (7) . This is consistent with, and more accurate than, the extrapolation of the Lyapunov-exponent data given above.
Comparison against data from previous work is as follows. Numerical estimates from direct evaluation of the first moment of the probability distribution of spin-spin correlation functions give (square lattice, approximate location of the NP at ) prb60_6740 ; (square lattice, approximate location of the NP at ) prl87_047201 ; (square lattice, CNP) dqrbs03 ; (triangular and honeycomb lattices) prb73_064410 . All are displayed in Figure 2, for ease of visualization. While overlap between these and the error bars of the present result is not better than marginal, it is clear that all estimates, for and , exclude the percolation value, stauffer94 (shown in the Figure by an arrow) by a safe gap.
We sum up the situation as follows. Using Eq. (8) as a definition of the correlation length for random systems is well justified in theory prmsp ; npb515_701 ; nig90 , and gives the inverse decay rate of the zeroth moment of the correlation-function distribution. As seen above, in the present case the associated exponent appears to differ slightly from which relates to the first moment. This is probably the rule rather than the exception; indeed, it has been shown that, for unfrustrated Ising systems, the finite-size scaling of numerical estimates of derived in the context of Eqs. (7) and (8) differs from that of results obtained directly from the spatial decay of correlation functions dq95 ; dq97 . Though in that case the origin of the discrepancy was traced to effects of the marginal disorder operator dq97 known to arise in the absence of frustration, the analogous operator structure at the NP is not known so far. However, it seems plausible to ascribe the small differences between the same two groups of results here, to similar causes.
IV Susceptibilities
The uniform zero-field magnetic susceptibility on a strip is given by the second derivative of the free energy, relative to a uniform field :
| (10) |
As usual in the numerical calculation of derivatives, care must be taken to avoid introduction of spurious errors. We have considered an infinitesimal field (in units of ), for the finite differences used in the differentiation denoted in Eq. (10). We have also used the same configuration of bonds (that is, the same sequence of pseudorandom numbers) for the comparison of free energies at different field values: free energies of the same bond geometry have to be subtracted. Thus, fluctuations in the finite differences used in the calculation of derivatives are much smaller than those for the free energies themselves prb60_6740 . For the calculations reported in this Section, we typically used strip lengths .
Finite-size scaling arguments suggest the following behavior for at the critical point :
| (11) |
where and are, respectively, the exponents characterizing the singularities of bulk uniform susceptibility and correlation length.
Another quantity of interest is the non-linear susceptibility , given in terms of the power-law expansion of the magnetization :
| (12) |
where
| (13) |
The nonlinear susceptibility at criticality obeys a finite-size scaling relationship similar to Eq. (11), with the replacement bd85 . This quantity has been investigated in the context of critical phenomena in both pure bd85 ; yuri97 and (quantum) spin-glass magnets gbh94 . The numerical procedures described above, for the calculation of derivatives, are followed here as well.
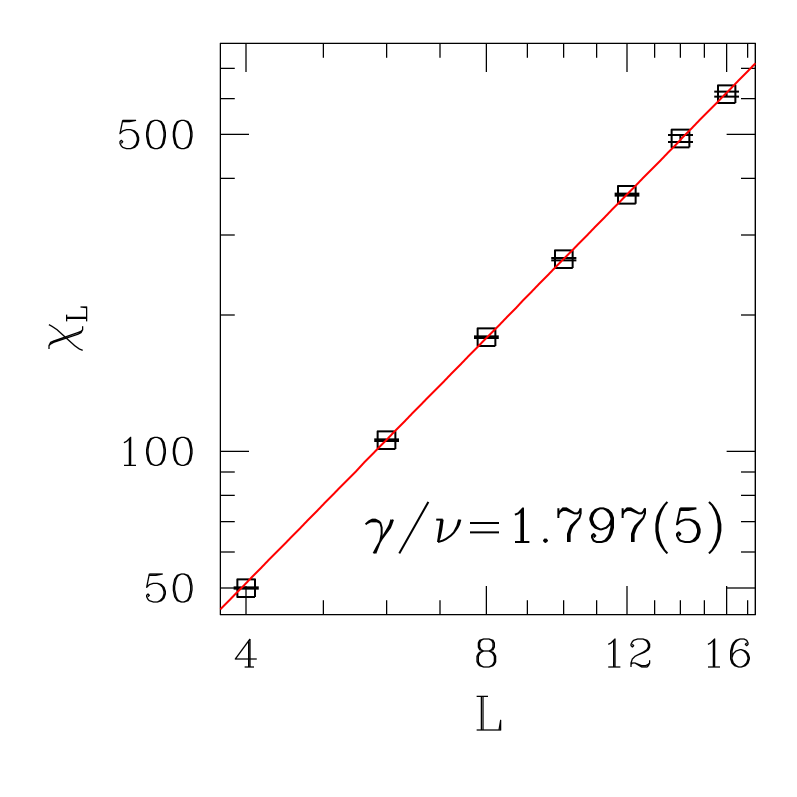
In Figure 3 we show data for the linear susceptibility , evaluated at the CNP, which have been fitted to the single power-law form, Eq. (11). We noticed that the per degree of freedom decreases from , for a fit including data (from which the estimate is extracted), to for a fit of data only, thus pointing to a clear improvement in the quality of fit. The latter procedure gives , which, for the reasons just mentioned, we assume to be the best result to be extracted from the present data set. This is just consistent, at the margin, with the percolation value stauffer94 .
In previous work, the following results have been found: prb60_6740 (square lattice, approximate location of the NP at ), prb73_064410 (triangular lattice). Both are consistent with the present estimate.
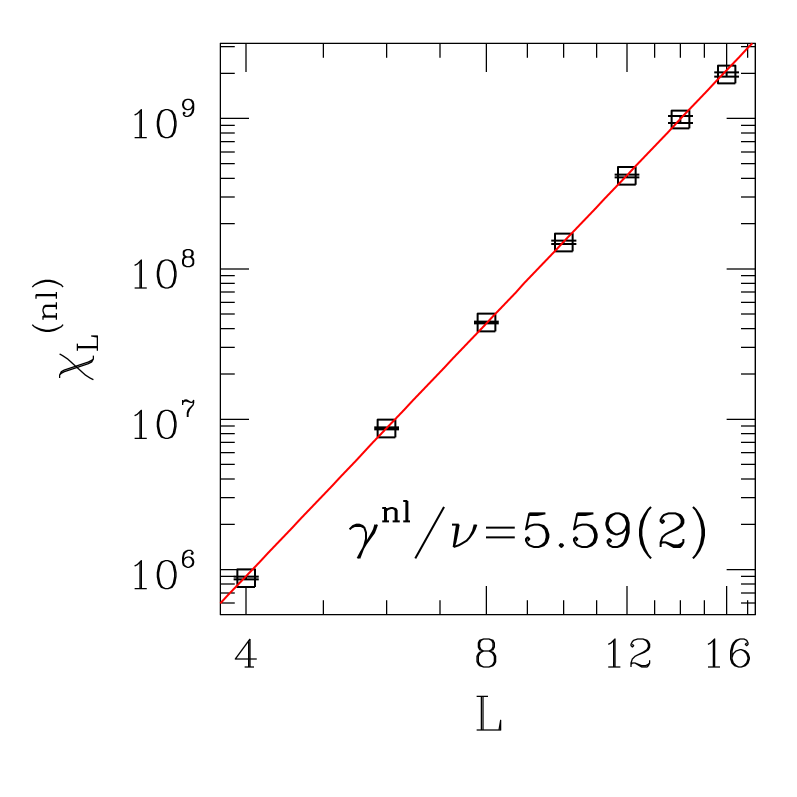
Non-linear zero field susceptibility data (), evaluated at the CNP, are exhibited in Figure 4. A fitting procedure, similar to that used to extract the linear susceptibility exponent, leads to when data for are used, and to when data are discarded. However, the per degree of freedom decreases only from to between the former and latter fits. Bearing in mind that we are dealing with a small number of finite-size estimates, such a variation does not warrant discarding data on grounds of a significant improvement in the quality of fit. The value is consistent with the scaling relation (using obtained above, and for the space dimensionality).
V Conclusions
We have calculated assorted critical quantities at the conjectured exact location of the Nishimori point (CNP) for square-lattice Ising spin glasses, namely , . By working at this fixed location, we attempt to eliminate one among many sources of uncertainty with which one has to deal in the study of disordered systems. Of course, whether or not such choice in fact introduces systematic distortions can only be found by comparison of a body of results pertaining to the problem under scrutiny.
Our extrapolation of finite-size free-energy data, in order to produce an estimate of the effective central charge, has been careful by accounting for curvature effects which are known to be relevant in such circumstances npb515_701 ; dq95 ; dq00 . Our final estimate, , is consistent with an earlier result prl87_047201 , , calculated at , and appears to exclude the percolation value npb515_701 , . Had we not included curvature effects, we would have reached which would lead to the opposite conclusion.
We conclude that whatever differences may exist between free energies evaluated at the CNP, and those calculated at nearby locations such as that given in Ref. prl87_047201, , their effect upon subsequent estimates of the central charge is not detectable amidst the noise associated to other sources of uncertainty. Prominent among these is the current upper limit on strip widths, , imposed by practical considerations.
We have evaluated finite-size correlation lengths via the difference between the two largest Lyapunov exponents. With the help of conformal-invariance concepts, these were used to produce a sequence of estimates of the decay-of-correlations exponent , related to the decay of the zeroth moment of the correlation-function probability distribution. Though such a sequence does not behave as smoothly as its free-energy counterpart, it seems safe to state that it points to . We have also directly calculated correlation functions on a strip, thus assessing the statistics of the above-mentioned zeroth moment. The corresponding result, is consistent with, and more accurate than, that derived from the Lyapunov exponents. Both estimates slightly differ from , related to the first moment of the same distribution, for which available estimates prb60_6740 ; prl87_047201 ; dqrbs03 ; prb73_064410 fall in the range . In all cases, for as well as , the random-percolation value stauffer94 , is definitely excluded.
From zero-field susceptibility data we obtain , which falls within the range of previous results prb60_6740 ; prb73_064410 , and just about touches the percolation value stauffer94 , at the lower end of the error bar. Similarly to the case discussed in Ref. prb73_064410, , it appears that from alone it is hard to get conclusive evidence, either for or against the behavior at the NP being in the percolation universality class.
As regards non-linear susceptibilities, our study has been motivated by the well-known manifestations of multiscaling behavior of correlation functions at the NP prl87_047201 ; pre65_026113 ; dqrbs03 ; prb73_064410 ; mc02a ; mc02b . The connection between linear susceptibility and the first moment of the correlation-function distribution is given through the fluctuation-dissipation theorem, which (upon invoking standard scaling arguments stan71 ) implies the scaling relation . The non-linear susceptibility , on the other hand, can be expressed in terms of four-point correlations and products of two-point ones bd85 . Thus it is not obvious a priori whether any of the multiscaling properties, observed for the assorted moments of the two-point function, will influence . Whatever guidance we have on the subject is given by the standard finite-size scaling relation between the exponents associated to and , namely . This is established upon consideration of finite-size scaling properties of the free energy bd85 , therefore bypassing any explicit connection to correlation functions. Should multiscaling behavior of magnetization-like quantities occur (via their connections to aggregated correlation functions), one would expect to see something similar to the non-constant gap exponents observed for correlation function statistics (i.e., non-constant magnetization gap exponents stan71 ), which would imply breakdown of the relationship just mentioned. As seen above, we have found that the relationship is in fact obeyed, to very good numerical accuracy. Thus, no evidence has been detected for multiscaling behavior of magnetic susceptibilities.
NOTE ADDED. After initial submission of this paper, new work came up php06 in which the results of Ref. prl87_047201, are extended and reanalysed. The estimates of the location of the NP, and of the central charge, remain unchanged at and , respectively.
Acknowledgements.
J.C.L. thanks the Brazilian agency CAPES for partial financial support, Departamento de Física de Sólidos, UFRJ, for making its research infrastructure available, and Universidade Estadual de Feira de Santana. The research of S.L.A.d.Q. was partially supported by the Brazilian agencies CNPq (Grant No. 30.0003/2003-0), FAPERJ (Grant No. E26–152.195/2002), FUJB-UFRJ, and Instituto do Milênio de Nanociências–CNPq.References
- (1) H. Nishimori, Statistical Physics of Spin Glasses and Information Processing: An Introduction (Oxford University Press, Oxford, 2001).
- (2) A. Honecker, M. Picco, and P. Pujol, Phys. Rev. Lett. 87, 047201 (2001).
- (3) P. Le Doussal and A. B. Harris, Phys. Rev. Lett. 61, 625 (1988).
- (4) H. Nishimori, C. Falvo, and Y. Ozeki, J. Phys. A 35, 8171 (2002).
- (5) H. Nishimori and K. Nemoto, J. Phys. Soc. Jpn. 71, 1198 (2002).
- (6) J. M. Maillard, K. Nemoto, and H. Nishimori, J. Phys. A 36, 9799 (2003).
- (7) F. D. A. Aarão Reis, S. L. A. de Queiroz, and R. R. dos Santos, Phys. Rev. B60, 6740 (1999).
- (8) J. L. Jacobsen and M.Picco, Phys. Rev. E65, 026113 (2002).
- (9) S. L. A. de Queiroz and R. B. Stinchcombe, Phys. Rev. B68, 144414 (2003).
- (10) K. Takeda, T. Sasamoto, and H. Nishimori, J. Phys. A 38, 3751 (2005).
- (11) H. Nishimori and M. Ohzeki, J. Phys. Soc. Jpn. 75, 034004 (2006).
- (12) S. L. A. de Queiroz, Phys. Rev. B73, 064410 (2006).
- (13) H. W. J. Blöte, J. L. Cardy, and M. P. Nightingale, Phys. Rev. Lett. 56, 742 (1986).
- (14) A Crisanti, G. Paladin, and A. Vulpiani, in Products of Random Matrices in Statistical Physics, edited by H. K. Lotsch, Springer Series in Solid State Sciences Vol. 104 (Springer, Berlin, 1993).
- (15) A. W. W. Ludwig and J. L. Cardy, Nucl. Phys. B 285, 687 (1987).
- (16) J. L. Jacobsen and J. L. Cardy, Nucl. Phys. B 515, 701 (1998).
- (17) S. L. A. de Queiroz, J. Phys. A 33, 721 (2000).
- (18) S. L. A. de Queiroz, Phys. Rev. E51, 1030 (1995).
- (19) J. L. Cardy, J. Phys. A 17, L385 (1984).
- (20) M. P. Nightingale, in Finite Size Scaling and Numerical Simulations of Statistical Systems, edited by V. Privman (World Scientific, Singapore, 1990).
- (21) U. Glaus, J. Phys. A 20, L595 (1987).
- (22) F. Merz and J. T. Chalker, Phys. Rev. B65, 054425 (2002).
- (23) F. Merz and J. T. Chalker, Phys. Rev. B66, 054413 (2002).
- (24) S. L. A. de Queiroz, J. Phys. A 30, L447 (1997).
- (25) D. Stauffer and A. Aharony, Introduction to Percolation Theory, 2nd ed. (Taylor & Francis, London, 1994).
- (26) T. W. Burkhardt and B. Derrida, Phys. Rev. B32, 7273 (1985).
- (27) M. A. Yurishchev, Phys. Rev. E55, 3915 (1997).
- (28) M. Guo, R. N. Bhatt, and D. A. Huse, Phys. Rev. Lett. 72, 4137 (1994).
- (29) H. E. Stanley, Introduction to Phase Transitions and Critical Phenomena, (Oxford University Press, Oxford, 1971).
- (30) M. Picco, A. Honecker, and P. Pujol, cond-mat/0606312.