Centro Atómico Bariloche and Instituto Balseiro, 8400 Bariloche, Argentina
Synchronization and structure in an adaptive oscillator network
Abstract
We analyze the interplay of synchronization and structure evolution in an evolving network of phase oscillators. An initially random network is adaptively rewired according to the dynamical coherence of the oscillators, in order to enhance their mutual synchronization. We show that the evolving network reaches a small-world structure. Its clustering coefficient attains a maximum for an intermediate intensity of the coupling between oscillators, where a rich diversity of synchronized oscillator groups is observed. In the stationary state, these synchronized groups are directly associated with network clusters.
pacs:
05.45.XtSynchronization; coupled oscillators and 05.65.+bSelf-organized systems1 Introduction
The emergence of coherent dynamics in ensembles of interacting active elements is one of the basic manifestations of self-organization in complex systems. A large number of natural phenomena can be ascribed to the organized action of individual agents, whose joint function gives rise to collective signals. Specifically, periodic dynamics in living organisms at many levels (molecular, cellular, social) have early been suggested to originate in the synchronization of many elementary oscillations Wiener ; Winfree .
The most significant instances of synchronization in natural systems are found in the realm of life sciences. Synchronized dynamics is essential to the function of cellular tissues such as in the brain Gray and in the heart Strogatz , and is known to characterize certain forms of behaviour in social animals, from insects to humans Buck ; Buck2 ; Strogatz2 . The observation that synchronization is ubiquitous in the functioning of biological systems immediately rises the question on the evolutionary mechanisms that may have given origin to this form of self-organization. Several models have been explored where dynamical parameters are modified in response to “selection pressure” in the form of learning algorithms, in such a way that the function of the system evolves towards a specified goal Moyano ; Ipsen .
In particular, Gong and Van Leeuwen have considered an ensemble of attractively coupled chaotic maps whose interaction pattern, described by means of a network, evolves in such a way that the mutual synchronization of individual motions is enhanced Gong . The algorithm favours the interaction between elements whose internal states are similar. In the present paper, we consider a similar form of adaptive evolution in a network of coupled non-identical phase oscillators Kuramoto . In this kind of system, the heterogeneity of the ensemble competes with coupling against the emergence of coherent dynamics Manrubia . We show that the evolution of the interaction network makes it possible to partially synchronize groups of oscillators, for coupling intensities well below the synchronization threshold of globally coupled ensembles. Correspondingly, the network evolves towards a structure with relatively high clustering, approaching a pattern with small-world properties –as also found to occur for networks of chaotic maps Gong . In contrast with the latter system, however, in oscillator ensembles clustering turns out to be maximal for an intermediate value of the interaction strength. We characterize the emerging dynamical and structural properties of the ensemble as functions of the coupling intensity.
2 The model
Our model consists of an ensemble of coupled phase oscillators, whose individual evolution is given by
| (1) |
, where is the natural frequency of oscillator and is the coupling strength. The weights define the adjacency matrix of the interaction network: if oscillator interacts with oscillator , and otherwise. The number of neighbours of oscillator is . Interactions are symmetric, so that and the network is a non-directed graph. It is assumed that this network is not disconnected. As explained in the following, in our model the interaction network changes with time.
During the evolution, the network is quenched over time intervals of length . Along each one of these intervals we calculate the average oscillation frequency of each oscillator,
| (2) |
It is well known that, if the coupling constant is sufficiently large, two oscillators and whose natural frequencies are close enough will asymptotically oscillate with the same average frequency, for . The collective manifestation of this long-term correlation between the dynamics of oscillator pairs belongs, precisely, to the class of synchronization phenomena addressed to in the Introduction.
In our model, after each interval of length has elapsed, the following adaptive mechanism is applied to make the network structure evolve. An oscillator is chosen at random, and the values are calculated for all . We detect the oscillator for which is minimum amongst all the . We also detect, amongst the neighbours of , the oscillator for which is maximal. If is one of the neighbours of oscillator , the network is not changed. Otherwise, the network link between and is replaced by a link between an . After this update, a new interval of length begins, and the process is successively repeated until some kind of stationary state is reached.
To avoid the unnatural situation where the average frequencies are compared with too high (machine) precision, we apply the above update mechanism only when the involved quantities and are larger than a certain threshold . In particular, if the maximal difference between the average frequencies of oscillator and all its neighbours is below , no changes are made.
The mechanism by which the interaction network is rewired has been designed as to favour the connection between oscillators with similar average frequencies. In other words, for a given coupling intensity, its main effect on the collective dynamics of the oscillator ensemble is to enhance the possibility of synchronization. This aspect is studied in Section 3.1. Now, what is the effect on the structure of the interaction network? Which topological features in the connection pattern emerge from such mechanism? To answer these questions we analyze statistical properties of the network connectivity, as described in Section 3.2.
3 Numerical results
In the numerical calculations, we consider an oscillator ensemble of size . The natural frequencies are chosen at random from a Gaussian distribution with zero mean and unitary variance, . Average frequencies are discerned with a threshold . Initially, the neighbours of each oscillator are chosen at random from the whole ensemble, establishing a link between each oscillator pair with probability . For , this implies that each oscillator has some neighbours on the average, which insures that essentially in all realizations of the initial condition the interaction network is not disconnected. As the same time, the connections are rather sparse. The initial phases are drawn from a uniform distribution in . The evolution equations are integrated using a standard Euler scheme, with time step . A rewiring of the network is attempted every time steps, so that .
3.1 Synchronization properties
As a first step to characterize the interplay between the collective dynamics of the oscillators and the evolution of their interaction network, we study the synchronization properties of the ensemble. We begin our analysis considering the synchronization order parameter Kuramoto
| (3) |
The time average of ,
| (4) |
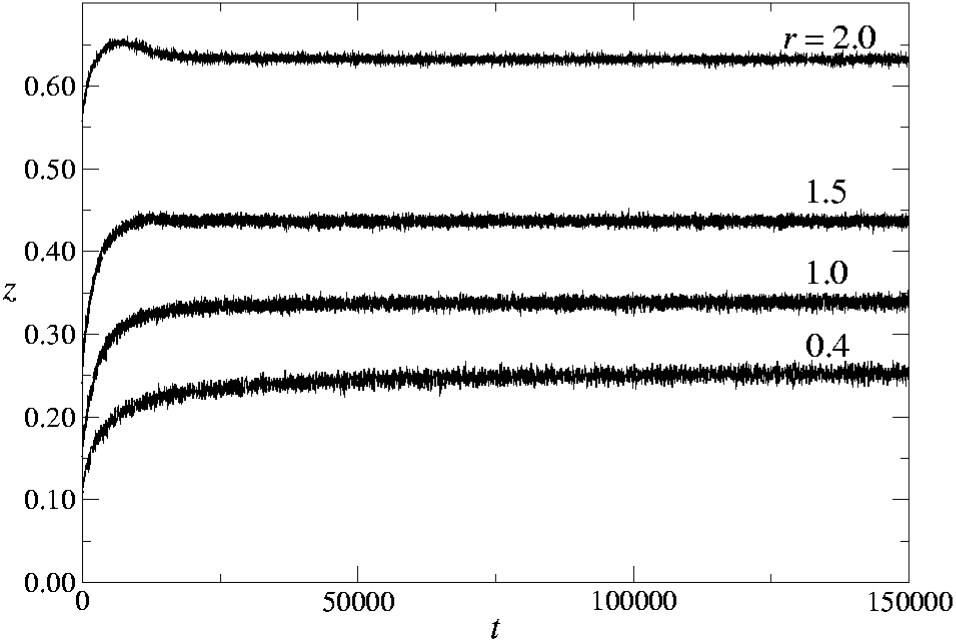
is calculated over intervals of length , when the network is quenched, in the same way as the average oscillation frequencies, Eq. (2). The order parameter ranges from for unsynchronized motion, to when the oscillators become fully synchronized. In Fig. 1 we show the time evolution of for four different values of the coupling strength, , , and , averaged over initial conditions. In all cases, the order parameter reaches a stationary value which grows as the coupling strength increases.
The analysis of reveals the existence of partially synchronized states, even for very small values of the coupling strength. In order to obtain further information on these states we compare the distribution of the average frequencies with that of the natural frequencies for representative single realizations. Figure 2 shows snapshots of the average frequency of each oscillator as a function of its natural frequency for three values of the coupling strength, , , and . For comparison, we recall that in a globally coupled ensemble –where for all and , and – the synchronization threshold with the same distribution of natural frequencies is placed at . The three snapshots are taken at time , when has practically reached its stationary level. At this time, on the average, each oscillator has been chosen times at the updates of the network structure.

In the plots of versus , synchronization is revealed by the presence of horizontal arrays of dots, corresponding to oscillators with different natural frequencies which, through the effect of coupling, have attained the same average frequency. Already for , we note the formation of many small groups of synchronized oscillators, all over the frequency distribution. A number of oscillators, however, do not belong to any group. For several groups have mutually collapsed, and the resulting aggregates are larger. Finally, just a few groups remain for , containing essentially all the oscillators.
In our system, thus, synchronized groups are already observed for coupling intensities well below the synchronization threshold of a globally coupled ensemble, quoted above. This is an indication that the evolution of the network structure succeeds at creating and maintaining connections between oscillators which are more likely to become synchronized, even for low coupling intensities. In a globally coupled ensemble –and, more generally, in a randomly connected ensemble with moderate to high connectivity– synchronization would first involve those oscillators in the centre of the Gaussian distribution of natural frequencies, where their number is larger Kuramoto ; Manrubia . This would typically give rise to a single synchronized aggregate around the mean natural frequency, surrounded by a “cloud” of non-synchronized oscillators. Increasing the coupling strength, the aggregate would grow in size at the expense of the “cloud”. In our system, on the other hand, the appearance of small synchronized groups for low interaction strength reveals a non-trivial structure in the underlying network. Due to the presence of several groups, we may expect that the collective behaviour of the ensemble is dynamically richer than in the cases where a single aggregate forms.
3.2 Network structure
The synchronization properties discussed above –in particular, the formation of synchronized groups for low coupling intensities– suggests that a reasonable choice to quantitatively characterize the structure of the interaction network is the clustering coefficient Watts . We recall that the clustering coefficient is a topological property of a network which measures the average number of neighbours of a given node which are in turn mutual neighbours. It is defined as the ratio of the total number of triangles to the total number of connected triples in the network. In a recent work McGraw , it was found that both in random and in scale-free networks, an increase in the clustering coefficient favors the formation of oscillator subpopulations synchronized at different frequencies.

In our model, as the network evolves, changes with time. Figure 3 shows the time evolution of the clustering coefficient for several values of the coupling strength. Each curve is an average over realizations. Even for , in the absence of interaction, shows a small (but fast) growth from its initial level (). In this case, the rewiring mechanism tends to cluster those oscillators whose natural frequencies are close to each other. For , however, the effect is much stronger. The clustering coefficient attains a long-time asymptotic value which depends on the coupling strength , and can reach up to seven times the initial value.
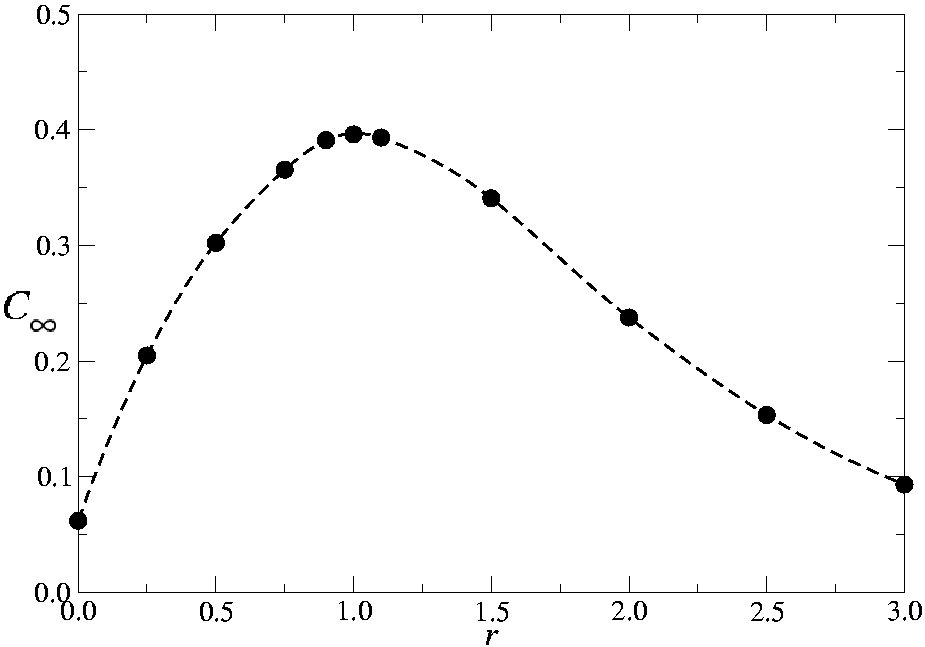
The asymptotic clustering coefficient as a function of the coupling strength is shown in Fig. 4. Interestingly enough, it exhibits a maximum at , where it reaches the value . For , declines, and seems to approach the value observed for for sufficiently large coupling intensities. The presence of a maximum in for an intermediate value of indicates that, as the result of the rewiring process, the resulting network acquires a more complex (less random) structure when interactions between oscillators are neither too weak nor too strong. When is small, after a few rewiring events which connect oscillators with similar natural frequencies –thus slightly increasing the clustering coefficient– the network evolution ceases. Due to the modest effect of synchronization at such low interaction intensities, there is no much advantage, with respect to the adaptive rewiring mechanism, in further increasing . On the other hand, for large coupling intensities, a high synchronization level is rapidly attained even for random interaction patterns. Again, consequently, rewiring has little effect on the network structure. The complexity of the resulting structure is therefore maximal for moderate interaction strengths, where the emergence of coherent synchronized oscillations is already significant, but such that the collective dynamics is not too much organized as to make the network evolution unnecessary.
As a next step in the analysis of the network structure, we consider the mean distance between all oscillator pairs. The distance between two oscillators is defined as the number of network links along the path of minimal length joining them. Figure 5 shows the time evolution of for three different values of the coupling strength, , and . The three curves are averages over different initial conditions. While, in the considered time span, grows monotonically for , the evolution is manifestly non-monotonic for larger coupling strengths. At short times, exhibits a fast growth, reaches a maximum, and then decays slowly. As increases, the maximum is reached at shorter times, and the peak becomes sharper. Together with the observation that asymptotic clustering is large, the small values of for long times indicate that the network has evolved, from its initial random structure, to a small-world pattern.

Why is it that the mean distance reaches a maximum for intermediate times? In order to suggest an answer to this question, in Fig. 6 we present snapshots of the network structure, together with the corresponding plots of the average frequency versus natural frequency , for at three different times. Networks were drawn using the Pajek software, optimized for display with the Kamada-Kawai algorithm Pajek . Initially, the network is random and for all . For , the network is clearly divided into clusters, which naturally leads to a larger value of the mean distance . In fact, at this time, reaches its maximum (see Fig. 5). The plot of average frequencies shows the presence of well-defined synchronized groups. Inspection of the state of individual oscillators reveals that there is a direct correspondence between the groups and network clusters. The largest cluster is formed by mutually synchronized oscillators with , while oscillators with frequencies far from zero form smaller clusters. When the system has reached its stationary state, at , six groups of mutually synchronized oscillators can be clearly distinguished in the plot of average frequencies. The network structure shows that clusters are now better interconnected, showing a more compact overall structure. This implies that the mean distance must have decreased to a value close to that corresponding to the initial random network.
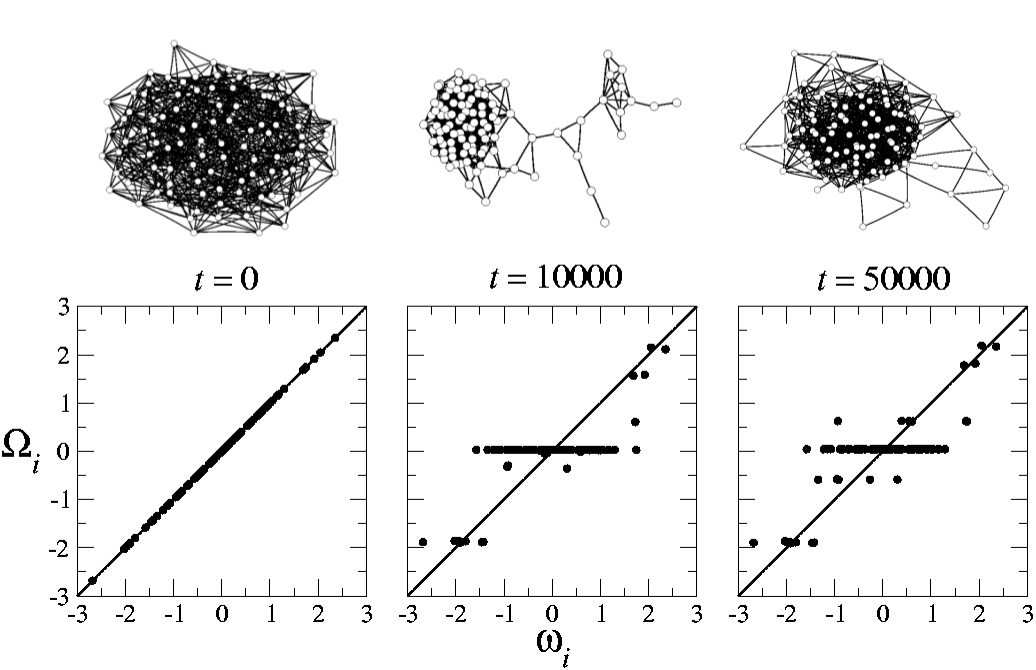
Thus, the maximum at intermediate times in the mean distance must be ascribed to a transient effect in the structural organization of the network, as groups of synchronized oscillators develop and segregate from each other. At those times, the network is divided into poorly interconnected clusters and the mean distance is relatively large. Later on, further collapse of synchronized groups increases their interconnection, and drops. Note that, although counterintuitive at first sight, this behaviour is not incompatible with the monotonous time growth of the clustering coefficient.
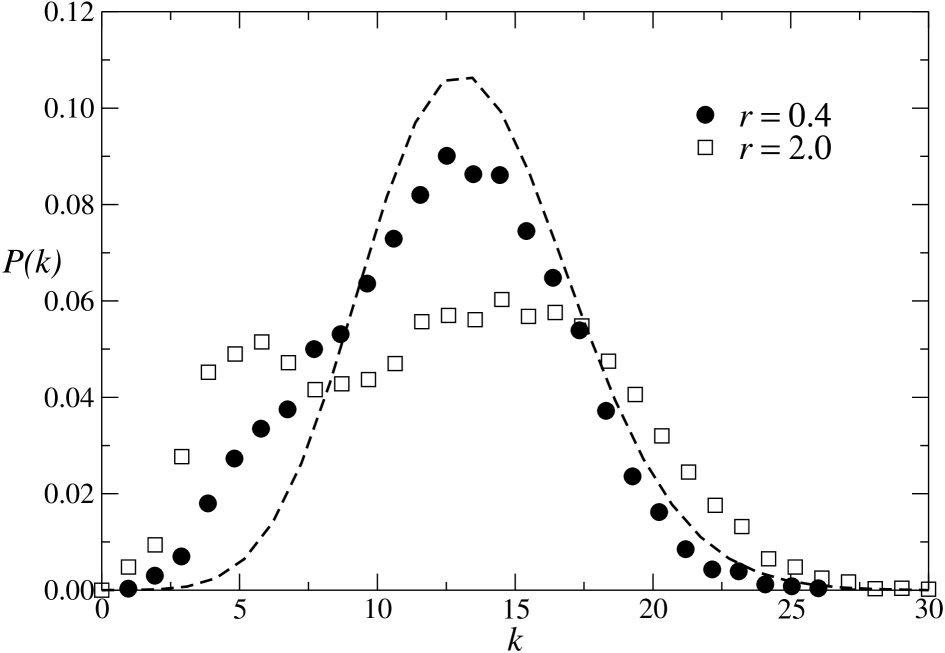
Additional characterization of the resulting network structure is provided by the degree distribution , which gives the frequency of nodes with exactly neighbours. We have analyzed the stationary distribution for various coupling strengths and, in Fig. 7, we show results for two representative values of . For comparison, the Poisson distribution of the random initial network , with , is shown as a dashed curve. As grows, the distribution deviates from the Poissonian shape. Its maximum flattens and shifts to the right, while the small- range becomes more populated. Eventually, the distribution acquires a bimodal shape, with a secondary peak at small , as shown in Fig. 7 for . Individual analysis of connectivities reveals that this peak represent the contribution of oscillators in small synchronized groups, whose frequencies are relatively far from zero. Large connectivities, on the other hand, belong to oscillators in the largest group.
4 Conclusions
We have presented a model of adaptive evolution in a system formed by coupled non-identical oscillators. The attractive interaction between oscillators is described by means of a dynamic network, that evolves by favouring the interactions between elements whose average frequencies are similar. We have analyzed in detail the synchronization properties of the model, the underlying network structure, and the relation between synchronization and structure.
We have begun our study by considering the synchronization order parameter . The analysis of the time evolution of shows that it reaches a stationary value that grows as the coupling strength between oscillators increases. This reveals the existence of partially synchronized states. In order to obtain more information on these states, we have inspected snapshots of the mean frequency versus the natural frequency, for different values of the coupling strength. This revealed the presence of groups of oscillators which had become synchronized even for very small values of the coupling strength.
The presence of several synchronized groups signals to a non-trivial structure in the underlying network. In order to analyze the network structure we consider first the clustering coefficient . The time evolution of shows that it reaches a stationary value that strongly depends on the coupling strength . In fact, presents a maximum at . This indicates that, as a result of the rewiring process, the network reaches a more complex structure when the interactions between the oscillators are neither too weak nor too strong.
It is interesting to compare the behavior of the stationary value of the clustering with the results obtained with a very similar model for chaotic maps Gong . In that case the stationary value of was either zero for small coupling strength, or saturated close to for larger values of the coupling strength.
As a next step in the analysis of the network structure, we have considered the mean distance . The observation that is small for long times, together with the fact that the stationary clustering is large, show that the network evolves from a random initial structure to a small-world network. Through an inspection of individual oscillators we have established a direct connection between synchronized groups and clusters in the network structure. This makes it possible to explain the non-monotonic transient behavior of the mean distance, and the bimodal shape of the degree distribution for large values of the coupling strength.
It is worth recalling the synchronization phenomenon of flashing fireflies, as described by J. and E. Buck. They observed that fireflies brought to their hotel room in Bangkok “…first flew about…then settled down in small groups” and finally “…the flashing within each group became mutually synchronous” Buck2 . The similarity with the behavior observed in our model suggests that the mechanism of enhancing interactions between dynamical elements whose internal states are similar plays a key role in the adaptive emergence of coherent dynamics.
5 Acknowledgments
P.M.G. acknowledges financial support from Consejo Nacional de Investigaciones Científicas y Técnicas CONICET (Argentina), Fundación Antorchas (Argentina), ANPCYT PICT2003 (Argentina) and ICTP grant NET-61 (Italy).
References
- (1) N. Wiener, Cybernetics, or Control and Communication in the Animal and the Machine (MIT Press, Cambridge, 1948).
- (2) A. T. Winfree, J. Theor. Biol. 16 (1967) 15.
- (3) C. M. Gray, P. König, A. Engel and W. Singer, Nature 338 (1989) 334.
- (4) S. H. Strogatz, Sync. The Emerging Science of Spontaneous Order (Hyperion, New York, 2003).
- (5) J. Buck and E. Buck, Science 159 (1968) 1319.
- (6) J. Buck and E. Buck, Sci. Am. 234 (1976) 74.
- (7) S. H. Strogatz, D. M. Abrams, A. McRobie, B. Eckhardt and E. Ott, Nature 438 (2005) 43.
- (8) L. G. Moyano, G. Abramson, and D. H. Zanette, Eur. Phys. J. B 22 (2001) 223.
- (9) M. Ipsen and A. S. Mikhailov, Phys. Rev. E 66 (2002) 046109.
- (10) P. Gong and C. Van Leeuwen, Europhys. Lett. 67 (2004) 328.
- (11) Y. Kuramoto, Chemical Oscillations, Waves and Turbulence (Springer, Berlin, 1984).
- (12) S. C. Manrubia, A. S. Mikhailov, and D. H. Zanette, Emergence of Dynamical Order. Synchronization Phenomena in Complex Systems (World Scientific, Singapore, 2004).
- (13) D. J. Watts and S. H. Strogatz, Nature 393 (1998) 440.
- (14) P. N. McGraw and M. Menzinger, Phys. Rev. E 72, 015101 (2005).
- (15) M. Girvan and M. E. J. Newman, Proc. Natl. Acad. Sci. USA 99 (2002) 7821.
- (16) B. Bollobás, Random Graphs (Cambridge University Press, UK, 2001).
- (17) http://vlado.fmf.uni-lj.si/pub/networks/pajek/