Cluster interactions for fcc-based structures in the Al-Mg-Si system
Abstract
A class of proposed coherent precipitate structures (Guinier-Preston zones) in the Al-Mg-Si alloy are investigated using first-principles density functional theory methods. The cluster expansion method is used to extract effective interaction parameters, providing the means for large scale energy calculations of alloy structures. The Mg1Si1 L structure and structures related to the Mg5Si6 phase are studied in more detail, and e.g., precipitate/matrix interface energies are presented. Using direct first-principles calculations we show that the former phase is dynamically unstable and thus must be stabilized by the surrounding Al matrix. Monte Carlo simulations and free-energy techniques are used to study the Al rich side of the phase diagram with the current CE parameters, and kinetic Monte Carlo simulations are used to study clustering in the disordered phase. The implications of our findings are discussed in the framework of classical nucleation theories, and we outline possible nucleation mechanisms.
I Introduction
The formation of solute-rich precipitates in a super-saturated solid solution is a process of great technological importance because it gives raise to precipitation hardening in a wide class of alloys. Among the precipitation hardened Al alloys, the Al-Mg-Si (6xxx) alloys belong to the most studied with regards to their precipitation sequences, see Ref. ZandAnde_sci97, ; EdwaStil98, ; MariAnde05, and references therein. They often display a complex sequence of metastable phases forming under different conditions (time, temperature and composition). The structures of almost all of these phases are known in detail from transmission electron microscopy (TEM) studies. However, such techniques give no direct information about the energetics of the phases of interest. First-principles calculations can provide vital new information in this respect, as has recently been demonstrated in the case of the Al-Mg-Si system, see work by Derlet et alDerlet02 and Ravi and Wolverton.RaviWolv04 Thus, by means of solving the Schrödinger equation within the density functional theory (DFT), one can obtain enthalpies, and study relaxation and binding, in phases which are meta-stable and only exist as nano-sized particles within the host matrix. A limitation of direct first-principles calculations is that, in practice, the structure has to be specified in advance. A central and unresolved question in the case of the Al-Mg-Si system is the structure of the first precipitates that form from solid solution, i.e., the Guinier-Preston (GP) zones.MariAnde05
In order to be able to study coherent precipitate phases within the Al matrix, and to model the disordered phase and the nucleation process, we have utilized a ternary cluster expansion (CE) description of the Al-Mg-Si system. In this model, a set of atoms within a lattice structure is denoted by , and the total energy of such a configuration can be written as a sum of “cluster functions”, ;
| (1) |
We derive the cluster interaction parameters from a set of first-principles calculations using an approach based on the structure inversion method (SIM).ConnWill83 Once these parameters have been obtained, it is a relatively inexpensive operation to sum up the total energy. A complication that arises is that the effective cluster interactions are in principle volume dependent,LaksFerr92 but since the concentration of Mg and Si in typical Al-Mg-Si alloys is %, we have done all calculations at volumes corresponding to the Al equilibrium lattice constant.
We have focused on the two main candidates for early precipitate structures, or GP-zones, in the Al-Mg-Si system. These are, the Mg1Si1 L structure proposed by Matsuda et al,Matsuda98 here referred to as the Matsuda structure, and the so called pre--phase which was proposed by Marioara et al.MariAnde01 By testing a large number of structures related to the pre- structure, we conclude that the Matsuda-phase is the energetically most stable precipitate phase. We then proceed with studying the stability of the Matsuda and pre- structures and find that the former structure is dynamically unstable, so that the vibrational free energy is undefined. This implies that it can only exist within a surrounding stabilizing lattice, the Al lattice in this case. That this system exhibits instabilities is not surprising since fcc Si is dynamically unstable.EkmaPers00 For certain local concentrations of Si we therefore expect the lattice to be significantly softened, which lowers the Gibbs free energy, and may lead to structural transformations.
The CE method also allows for large-scale Monte Carlo (MC) simulations to be performed, either for finding ground-state structures (using, e.g., simulated annealing) or to study finite-temperature thermodynamic properties of an alloy. Our MC calculations using the present CE parameters show that decomposition typically occurs in the form of spherical precipitates with the Matsuda structure. MC simulations in combination with thermodynamic integration are used to calculate the solvus phase boundary in the Al rich end of the phase diagram. We also use kinetic Monte Carlo (kMC) simulations to study clustering in the disordered phase. Such studies are of current interest because modern experimental techniques, i.e., high- resolution transmision electron microscopy and 3D atom probe tomography, are capable of studying small, coherent clusters at an atomic scale.MariAnde05 ; ShaCere05 Therefore, increased understanding of atomic level processes that preceed nucleation can be expected and a much more detailed comparison with modelling and simulation is possible.ShaCere05
The paper is disposed as follows. In Sec. II we describe the two GP-zone models considered in this work. In Sec. III we review the theory of ternary CE, and we also detail the first-principles calculations that form the basis for the present work. The results of the fitting procedure, and of the CE calculations for different GP-zone structures are presented in section IV. The calculation of the solvus boundary for Mg1Si1 and simulations of the early stage of clustering are presented in the same section. In Sec. V we discuss the present results in the light of what is experimentally known about GP-zone formation in Al-Mg-Si, and conclusions follow in Sec. VI.
II GP-zone models in the Al-Mg-Si alloys
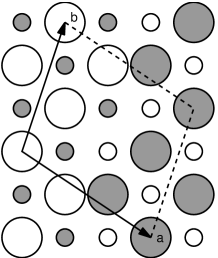
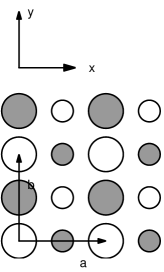
Currently there are two generally accepted models of the early precipitate phases, or GP-zones, in the Al-Mg-Si alloys. The first structure, an Mg1Si1 L phase (see Fig 1b) was observed by Matsuda and co-workers Matsuda98 in samples with a solute concentration of 1.55 at.% and with a Mg:Si ratio of 2:1. The samples had been aged and then heat-treated at 343 K. This phase will be referred to as the Matsuda phase. The other structure, the pre- in Fig. 1a was proposed by Marioara et al. MariAnde01 based on TEM observations of samples that had been homogenized at 843 K and heat treated at 450 K. The Mg:Si ratio in these samples was 5:6.
The structure is the most efficient hardening phase in the 6xxx alloys. The fact that GP-zones have been observed to have the same symmetry as the phase, motivated the structural model of GP-zones shown in Fig. 1a.MariAnde01 Its structural relationship with the phase can be understood in the following way. If the Mg atom in Fig. 1a is displaced in the normal () direction, one obtains a structural model of the phase. The latter phase is in turn needle-shaped, and often observed to be coherent in the plane and semi-coherent in the (needle) direction.
III Methods
III.1 Cluster expansion and the structure inversion method
The general theory for multicomponent CE was developed by Sanches, Ducastelle and Gratias.SancDuca84 In the present work we use the following notations. A lattice site can be occupied by an atom of type , , or , indicated by an occupation variable, , taking the value , 0, or , respectively. Hence, given an underlying lattice, the alloy structure can be defined by a set of occupation variables, . Linearly independent basis vectors describing the occupation are then
| (2) | |||||
A cluster is defined as a set of lattice sites . Given a cluster , a cluster function is defined as the the product of the basis vectors,
| (3) |
where the sequence is called “decoration”, which in the ternary case will consist of 1:s and 2:s. The total energy is given by (1), and by considering the average of cluster functions for symmetry-equivalent cluster-decoration pairs, , the total energy can be re-written as
| (4) |
where is a reference energy and is an average, defined as
| (5) |
The sum goes over all pairs related to through lattice symmetry operations. is the number of such cluster functions per lattice site, and is the total number of lattice sites.
In the structure inversion method one calculates the :s by minimizing
| (6) |
where denotes a list of input structures and their corresponding total energies. The choice of input structures is arbitrary as long as they contain information about all cluster functions, and an advantage with the SIM is that the :s can consist of small unit cells in a super-cell approach, for which the total energy, may be efficiently calculated using DFT methods.
In order to select cluster functions to be used in the fitting, we used cross-validation,WallCede02 with the intention to obtain an optimal fit, while at the same time avoid over-fitting. It is applied to CE by defining a hierarchy of clusters, were a cluster is included only if all its sub-clusters are included, and short range clusters are prioritized over long-range clusters. Then, by choosing clusters in this way, the aim is to minimize the cross-validation score
| (7) |
Here, denotes the predicted energy of structure , using parameters obtained without structure included in the fit. Thus, the cv-score measures the ability of the CE, with a given set of cluster functions, to predict the energy of new structures. We note that all structures are included in the fit in Eq. (6).
III.2 Electronic structure calculations
We have used the Vienna ab-initio simulation package (VASP),VASP a plane-wave pseudo potential implementation of the DFT method, in the present electronic structure calculations. For the exchange-correlation approximation we used the Perdew-Wang implementation of the generalized gradient approximation (GGA).PW91 The built-in ultra-soft pseudo potentials by Vanderbilt et al. were used.PP -points were chosen according to the Monkhorst-Pack scheme in meshes corresponding to points for the conventional fcc unit cell, or denser. Tests showed that using a mesh corresponding to -points changed the energy with typically 1-2 meV/atom. The atomic structure was relaxed at constant volume using a conjugate gradient technique, or in some cases a damped molecular dynamics algorithm. We found that both methods led to the same relaxed state. We note that during the relaxation, the symmetry is preserved. This means that if the relaxation starts at a saddle point in the potential energy landscape, the system may stay at this saddle point due to symmetry restrictions. In particular, pure Si in the fcc structure is unstable with respect to tetragonal shear,EkmaPers00 but this relaxation mode is not taken into account in our calculations.
III.3 Monte Carlo and kinetic Monte Carlo simulations
The computational study of the thermodynamic properties of the Al-Mg-Si system requires to take configurational space properly into account. To this end we use the standard Metropolismetropolis53 Monte Carlo sampling technique, generating a sequence of configurations being Boltzmann-distributed with respect to the system temperature and configurational energy. We have held the alloy constituent concentrations unchanged during the simulations. Hence, as the trial-changes we simply choose a random pair of atoms to be exchanged with each-other. One MC step is defined as one such trial-echange per atom. A technical aspect of our implementation is that the cluster functions are defined in the so called canonical basis rather than the orthogonal basis (Eq:s (III.1)). That means that the cluster functions are products of integers rather than real numbers, and their evaluation becomes more efficient.
In order to simulate kinetic processes (e.g., nucleation) we have utilized a kinetic Monte Carlo (kMC) algorithm. The important additional constraint added to a kMC algorithm, as compared to the ordinary MC dito, is that the (trial-) changes made to the system are selected in a way correspondig to the effect of some physical process occurring. The physical process being most important during aging or phase transformations in our Al-Mg-Si alloy system, is the mass transport via atomic diffusion. The atomic diffusion process was modelled by attempted interchange of two randomly choosen nearest neighbor atoms, and accepting the interchange according to the Metropolis algorithm. This model is also known as Kawasaki-dynamics.kawasaki72
To provide an estimate of the time-scale of the simulated diffusion process, we use an experimental value of the aluminum self diffusion coefficienthatch84 as input. The experimental input which implicitly contain information about diffusion hop-rates and vacancy concentrations, will relate the Monte Carlo steps to physical time as
| (8) |
where is the physical time scale of giving all the atoms in the system a chance to diffuse, being the Al lattice contant, and is the experimentally determined diffusion coefficient. The factor accounts for the supersaturation of vacancies that is present, e.g., after a quench.
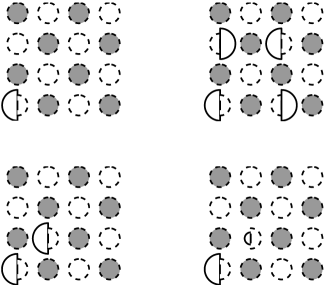
We used the kMC method to study the early stage of clustering in Al-Mg-Si. Our definition of a cluster is then that each solute atom (Mg or Si) belonging to a given cluster is nearest neighbour to at least one more solute atom in the same cluster.
III.4 Free energy integration
The phase diagram, and the underlying free-energy differences between various phases determine the driving force, e.g., for precipitate formation. In order to calculate the phase boundary between disoerdered and a two-phase region, one must know the free energy of the disordered phase. In the present work, it was calculated in the following way. The energy as a function of temperature was determined for a set of compositions in standard MC simulations. This was done by slowly decreasing the temperature and the system was then kept in the disorderd state. A corresponding simulation where the temperature is increased from a low temperature shows a clear hysteresis and the point where the two curves meet can be taken as a rough estimate of the phase boundary. The entropy in the disordered state was determined using thermodynamic integration of the relation
| (9) |
The remaining constant of intgration was taken from the expression for the entropy of a ternary system in the ideal solution model
| (10) |
where , and are the respective atomic concentrations. This expression is which is valid at sufficiently high temperature. In the present work, we integrated from .
IV Results
IV.1 Fitting of the CE parameters
To choose input structures for the SIM, we started with 8 binary structures and 34 ternary structures in Refs. Ducastel91, and CedeGarb94, , respectively. Those structures have been shown to be the only distinct structures that can be obtained if one assumes only up to next-nearest neighbor pair interactions. (In the ternary case, this has not been strictly proven, but it seems plausible.) Taking into account the structures obtained when the occupation of A, B or C atoms in the ’generic’ structures are permuted, one ends up with 148 symmetrically distinct structures. In addition, we used some low-concentration structures, e.g., an isolated impurity in a 32 LP cell, see Appendix A. Further, we excluded some structures, e.g., pure Mg, that had a large static (positive or negative) internal pressure. In total, we ended up with 154 structures.
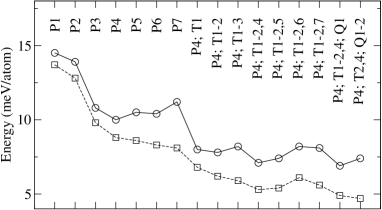
These structures were used as input to the fitting of the cluster interaction parameters in Eq. (6). When selecting clusters, we minimized the cross-validation score given by Eq. (7). In the procedure we included pairs, triplets and quadruplets in a hierarchical order, see Fig. 2 and Table 1 for an explanation of the clusters used. We found that a good fit was obtained if we included pairs up to fourth nearest neighbor, and the triplets T1, T2 and T4 (see Table 1). This gives a total of parameters that were minimized. The resulting cv-score is 7.1 meV/atom.
IV.2 Static energies of suggested GP-zone structures
We have investigated the energetics of two models of the GP-zones in Al-Mg-Si; the Matsuda phase and the pre- phase (see Sec. II and Fig. 1).
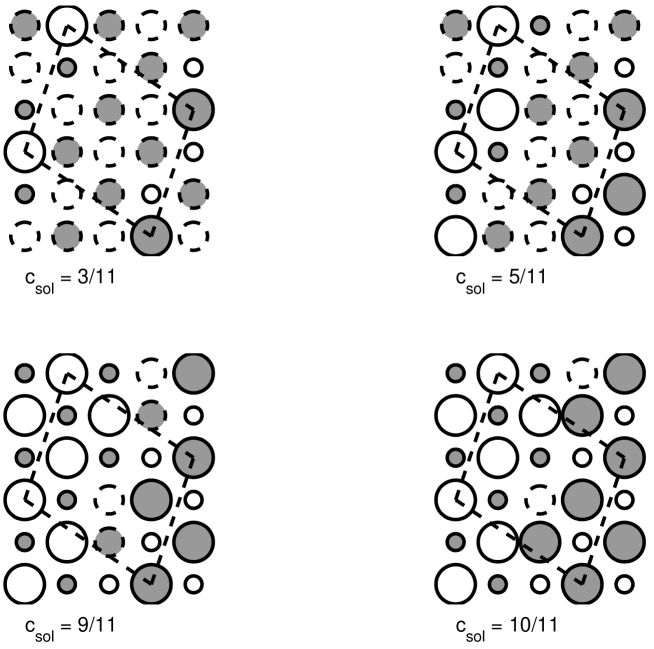
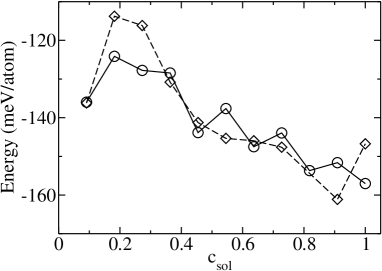
Because the latter structure has not actually been solved, we proceed along the lines in Ref. RaviWolv04, : starting with the 11 atom unit cell in Fig. 1a, we exchanged Mg/Si atoms with Al atoms in all possible ways. For each structure (of which some will be identical by symmetry) we calculated the total energy using Eq. (1). In Fig. 3 we have plotted, for each composition , the energy of the most stable structure. An even less restrictive procedure is to generate all structures that arise if each lattice point is occupied by a Al, Mg or Si atom. The most stable structures in this case are essentially the same as those in Fig. 3.

Ravi and WolvertonRaviWolv04 did a set of calculations for pre- structures, using first-principles methods. We have used the same convention as they used in plotting the energies, i.e., we plot the formation energies per solute atom with respect to the pure constituents in the fcc structure. Therefore, the the two sets of energies can be directly compared.
Fig. 3 shows that structures with an Mg:Si composition close to 1:1 are energetically favoured. This is in line with most experimental data on clusters and early precipitates in Al-Mg-Si alloys.Matsuda98 For this composition, the Matsuda phase is lowest in energy, as found also in Ref. RaviWolv04, . In order to picture how “pre--like” structures may be build up, we also extracted the energetically most stable structures contained in the pre- cell as a function of solute concentration . Selecting the structures from the or the possible structures resulted in the same ground state structures. The energies are plotted in Fig. 4 together with directly calculated energies for the same structures. Thus, by comparing the two sets of energies, one gets an estimate of the predictive power of the CE method used. We note the the relaxation of the structure at did not finish during the simulation. This could indicate that the structure is unstable. Some representative lowest-energy structures in Fig. 4 are shown in Appendix B.
The interface energies between secondary phase particles and a parent phase are important parameters in various theories of nucleation and phase stability that are usually hard to estimate. We calculated the pre-/Al and Matsuda/Al interface energies (at ) using Eq. (1), see Table 2. The finding that the pre-/Al interface is negative was confirmed in a direct DFT calculation in a 44 atom super-cell. The result indicates that this phase may contain Al.
The energy of Eq. (4) is the static energy at constant volume. To this comes a lowering of elastic energy, , due to volume and cell-shape relaxation of these phases. For the structures that were used in the fitting of the CE parameters, this term can be estimated in the following way. Assuming that the phase relaxes centro-symmetrically within an matrix, which is assumed to be elastically isotropic, is given byChristian02
| (11) |
Here, is the shear modulus of the phase and is the bulk modulus of the phase, where in this estimate we used . is the volume of phase and is the initial linear misfit of the phase relative to the phase. is in turn calculated from the internal pressure of the different structures using . The results for some structures in Fig. 4 are given in Table 3.
IV.3 Dynamical stability of the Matsuda and pre- phases
The dynamic stability of the Matsuda phase and the pre- phase was tested by displacing the atoms from their relaxed positions in the internally relaxed structures. For the Matsuda phase, starting with a 32 atom cell, we displaced the atoms in random directions of a nearest-neighbor distance. A subsequent relaxation showed that the forces were non-conservative (i.e., directed away from the initial positions) for the Si atoms within the Si plane.
A similar analysis of the pre- structure shows that it is most likely metastable. In a separate calculation, we displaced the Mg atom in Fig. 1a by a small distance in the z-direction. Also in this case, the force on the Mg atom was conservative.
In the case if the Matsuda phase, we note that, according to the findings in Ref. Matsuda98, , the structure exists in thin (one or a few atomic) slabs in the Al lattice (see Fig. 1b). For such morphologies, the Matsuda phase will be stabilized by the surrounding Al lattice.
IV.4 Free energy of precipitation and kinetics of clustering
In order to study precipitation and clustering it is necessary to know the solubility limit of the alloying elements. In this sub-section we first describe the calculation of the solvus boundary in the Al rich end of the phase diagram, and then we present kMC simulations of clustering in the disordered phase.
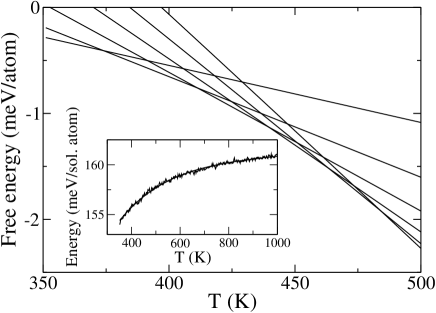
We have focused on the subset of the phase diagram where the Mg:Si ratio is 1:1 and varies between and . The energy per atom as a function of was calculated for a range of concentrations, while staying in the disorderes phase. In these simulations, an atom system was cooled at a rate of kMC step. Based on a polynomial fit to the energy, we then used thermodynamic integration to calculate the entropy by use of Eqs. (9) and (10). The corresponding free energies are plotted in Fig. 5. The free energies are given with respect to the normal state, which corresponds to separated Al and L phases at K. The solubility limit at each temperature corresponds to the lowest lying free-energy curve. We have implicitly assumed that the ordered phase, the L, is completely ordered, i.e., does not contain anti-defects or Al atoms. We checked the validity of this assumption, again using the regular solution model. It turns out that defects (typically 1-2% below 500 K), can be neglected in the calculation of the solubility limit at the Al rich end of the phase diagram. The resulting solvus-line is plotted in Fig. 6.

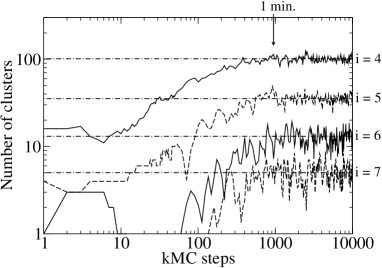
Clustering in Al-Mg-Si was studied by kMC. The atoms were initially randomly distributed, corresponding to a previous homogenisation at a high temperature. In Fig. 7 we have displayed the cluster size distributions as a function of annealing time for a 2% solution at 400 K. The time-scale was calculated by assuming the Al self-diffusion rate and a -fold increase in the number of vacancies, corresponding to a homogenisation at 750 K. We believe that the latter factor is the dominant source of error in estimating the time-scale in this type of simulations. It is seen that the initial stage of clustering is fast ( min.). In practice, since the kinetics is even faster at higher , part of the initial clustering is expected to take place already during the quench.
Since the system is not within the two-phase region, there are no nucleation and growth stages. After the initial clustering, the cluster sizes fluctuate in accordance withSoisMart00
| (12) |
where is the excess free energy required to form a cluster of size , and is the number of such clusters in a system containing atoms. can be written as
| (13) |
where is the volume free energy per atom of a cluster, is the cluster/matrix interface free energy and is a geometrical factor.
A longer kMC simulation ( kMC steps for atoms) showed that the cluster sizes were distributed in accordance with Eq. (12) for clusters from up to , with an effective volume energy close to and an interface energy , i.e., considerably lower than the mean interface energy of the Matsuda phase at (Table 2).
V Discussion
The main purpose of this paper was to apply the CE-SIM method to model clusters and GP-zones in the Al-Mg-Si system. The interaction parameters were fitted to reproduce the static energy of fcc based structures in the low solute-concentration regime. By use of cross-validation and by selecting clusters of increasing range, we ensure that an ’optimal’ set of clusters is selected in the fitting procedure. Explicit calculations on 10 predicted ground-state structures derived from the pre- structure reveal that the method holds its promise; the mean square deviation between predicted and directly calculated energies is meV/atom, to be compared with the cv-score meV/atom in the fitting procedure.
However, the energy of interest for a given is the Gibbs free energy . The term can be handled within the CE formalism,LaksFerr92 but it is much more difficult to treat the term in a completely general manner. Our explicit calculations for the Matsuda phase show that it is dynamically unstable, i.e., the term is undefined. In general, one expects that when the local configuration approaches an unstable structure, the vibrational frequencies are lowered (phonon softening), so that the structure is stabilized. Thus, this is an effect that we expect to be important in the early stages of precipitation in Al-Mg-Si. We note that in Al-Sc, the inclusion of the term changes the phase diagram significantly.OzolAsta01 This is related to phonon softening but not to instabilities. Instabilities in substitutional alloys have been studied previously, e.g. in W-Re.EkmaPers00_2
We now discuss the implications of our findings in relation to what is known from experiments on the nucleation of GP-zones and the -phase. In our simulations, we have only found one stable precipitate structure; the Mg1Si1 L structure. It forms in approximately spherical precipitates below for the composition . Matsuda et al. report the formation of Mg1Si1 L precipitates at for an alloy containing mass % Mg2Si. These precipitates are in the form of planes. The morphology can be related to the internal stress of the Matsuda structure, which favours platelets in the plane. Because the platelets extend only one or a few planes in the normal direction, the Matsuda phase will be stabilized by the surrounding Al matrix.
The pre- and phases are found experimentally to form at in alloys containing about 1.25 at.% Al and Mg.MariAnde05 Fig. 6 shows the calculated phase boundary for forming Matsuda particles. One finds that neither the Matsuda phase nor the pre- phase would form with the current atomic interaction parameters, at the temperatures and solute concentration where forms. Elastic relaxations would lower the energies of both the impurities and the ordered phases, and are not expected to change this conclusion (see further Ref. RaviWolv04, ). It is seen in Fig. 6 that the regular solution model describes the solvus phase boundary well up to . For a Mg:Si composition of 1:1, the expression for the solvus line according to this model is , in the low concentration limit. is the ordering energy which can be found in Fig. 3 by comparing the energy of, e.g., the Matsuda phase with a line connecting the impurity energies of Mg and Si. Thus, one finds that the ordering energy required to stabilize a structure at the temperature and concentration where GP-zones form ( and repectively), is at least . This is larger than any of the ordering energies in the current study or in Ref. RaviWolv04, .
Therefore, in order to explain the nucleation mechanism of GP-zones and the phase, we suggest the following possibilities. Either, vibrational entropy effects or vacancies stabilize an ordered pre- based structure, which then transforms into the structure, or the structural transition takes place in the disordered phase, in a Mg-Si rich cluster with the right local configuration. Recent TEM observations clearly indicate that the GP-zones are ordered, fcc-based, structures.MariAnde05 Thus, the former explanation seems more likely. In either case, there is a substantial gain in energy connected to the transition to the structure.
Finally, we remark that it is likely that quenched-in vacancies play a direct role in the nucleation of the phase. As pointed out in Ref. Derlet02, , vacancies may faciliate a structural transition from the pre- to the phase simply by providing the extra space needed for the (0,0,0) Mg atom to move lattice vector in the -direction. Including vacancies in the CE description is formally straight-forward, however, in practice it would increase the complexity in the CE and lead to other technical complications.
VI Conclusions
We have investigated the formation of GP-zones in the Al-Mg-Si system using a CE of the total energy. DFT pseudo-potential calculations of 154 fcc-based pure, binary and ternary structures were used to parameterize the energy by the SIM. Which cluster functions to include was chosen according to the cross-validation criterion, with the intension to avoid over-fitting. The method successfully reproduces the total energy of 10 structures based on the suggested pre- structure. Regarding the formation of GP-zones, the CE calculations shows that the Mg1Si1 L structure suggested by Matsuda et al. is the most energetically stable phase. This is also confirmed in direct DFT calculations. Our results are in fair agreement with the DFT calculations presented by Ravi and Wolverton,RaviWolv04 where one should compare with their constrained GGA results for pre- structures. Regarding the formation of the pre- and structures, we outline two possible nucleation mechanisms. Either, the vibrational entropy () term, or the presence of vacancies serve to stabilize the structures preceding the phase, which then transforms to the meta-stable phase.
VII Acknowledgments
We thank M. Ekman and C. Wolverton for helpful discussions. M. Ekman also kindly provided us with geometrical data for the CE. C. D. Marioara and S. J. Andersen contributed with their valuable knowledge about precipitation in the Al-Mg-Si system. This work was funded through the Norwegian high performance computing programme and the Norwegian reseach Council through contract nr. 140553/I30.
References
- (1) H. W. Zandbergen, S. J. Andersen, and J. Jansen, Science 277, 1221 (1997).
- (2) G. A. Edwards, K. Stiller, G. L. Dunlop, and M. J. Cooper, Acta Mater. 46, 3893 (1998).
- (3) C. D. Marioara, S. Andersen, H. Zandbergen, and R. Holmestad, Met. Mater. Trans. A 36A, 691 (2005).
- (4) P. M. Derlet, S. J. Andersen, C. D. Marioara, and A. Frøseth, J. Phys.: Condens. Matter 14, 4011 (2002).
- (5) C. Ravi and C. Wolverton, Acta Mat. 52, 4213 (2004).
- (6) J. W. D. Connolly and A. R. Williams, Phys. Rev. B 27, 5169 (1983).
- (7) D. B. Laks, L. G. Ferreira, S. Froyen, and A. Zunger, Phys. Rev. B 46, 12587 (1992).
- (8) K. Matsuda et al., Metall. Mat. Trans. A 29, 1161 (1998).
- (9) C. D. Marioara, S. Andersen, J. Jansen, and H. Zandbergen, Acta Mater. 49, 321 (2001).
- (10) M. Ekman, K. Persson, and G. Grimvall, Phys. Rev. B 62, 14784 (2000).
- (11) G. Sha and A. Cereso, Acta Mater. 53, 907 (2005).
- (12) J. M. Sanchez, F. Ducastelle, and D. Gratias, Physica A 128, 334 (1984).
- (13) A. V. de Walle and G. Ceder, J. Phase Equil. 23, 348 (2002).
- (14) G. Kresse and J. Hafner, Phys. Rev. B 47, 558 (1993); 49, 14251 (1994); G. Kresse and J. Furthmüller, Phys. Rev. B 54, 11169 (1996).
- (15) J. P. Perdew et al. Phys. Rev. B 46, 6671 (1992); Phys. Rev. B 48, 4978 (1993).
- (16) D. Vanderbilt, Phys. Rev. B 41, 7892 (1990); G. Kresse and J. Hafner, J. Phys.: Condens. Matter 6, 8245 (1994).
- (17) N. Metropolis et al., Journal of Chemical Physics 21, 1087 (1953).
- (18) K. Kawasaki, in Phase Transistions and Critical Phenomena, edited by C. Domb and M. S. Green (Academic Press, New York, 1972), Vol. 2.
- (19) Aluminum: Properties and Physical Metallurgy, edited by J. E. Hatch (American Society for Metals, Metals Park, Ohio, 1984).
- (20) F. Ducastelle, in Order and phase stability in alloys, Vol. 3 of Cohesion and structure, edited by F. R. de Boer and D. G. Pettifor (North-Holland, Amsterdam, 1991).
- (21) G. Ceder, G. Garbulsky, D. Avis, and F. Fukuda, Phys. Rev. B 49, 1 (1994).
- (22) J. W. Christian, The theory of transformations in metals and alloys (Pergamon, Amsterdam, 2002).
- (23) F. Soisson and G. Martin, Phys. Rev. B 62, 203 (2000).
- (24) V. Ozolins and M. Astra, Phys. Rev. Lett. 86, 448 (2001).
- (25) M. Ekman, K. Persson, and G. Grimvall, J. Nucl. Mater. 278, 273 (2000).
| Cluster, | Decorations, | |
|---|---|---|
| units of () | ||
| Empty | ||
| Point | (000) | 1; 2 |
| P1 | (000) (110) | 11; 12; 22 |
| P2 | (000) (200) | 11; 12; 22 |
| … | … | |
| P7 | (000) (321) | 11; 12; 22 |
| T1 | (000) (110) (101) | 111; 211; 222 |
| T2 | (000) (011) (01) | 111; 211; 121; 221; 122; 222 |
| T3 | (000) (110) (01) | 111; 211; 121; 221; 122; 222 |
| T4 | (000) (121) (21) | 111; 211; 221; 222 |
| T5 | (000) (211) (112) | 111; 211; 121; 221; 122; 222 |
| T6 | (000) (020) (112) | 111; 211; 221; 112; 212; 222 |
| T7 | (000) (110) (112) | 111; 211; 121; 221; |
| 112; 212; 122; 222 | ||
| Q1 | (000) (110) (101) (011) | 1111; 2111; 2211; 2221; 2222 |
| Q2 | (000) (101) (011) (01) | 1111; 2111; 2211; 1121; 2121; |
| 2221; 1122; 2122; 2222 |
| Al/pre- | ||
| () | ||
| Al/Matsuda | ||
| Structure | pressure (meV/Å3) | Elastic energy |
|---|---|---|
| (meV/Å3) | (meV/B-phase atom) | |
| 4e (AlMgSi2) | -2.5777 | 0.0488 |
| 8c1 (AlMg3Si4) | 8.9378 | 0.5863 |
| L10 (MgSi) | 19.4610 | 2.7798 |
| 8c1 (AlMg4Si3) | 28.1928 | 5.8340 |
| 4a (AlMg2Si) | 35.4267 | 9.2119 |
| L12 (Al3Mg) | 32.1312 | 7.5778 |
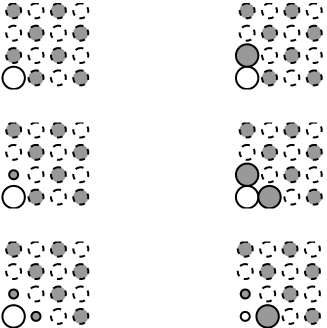
Appendix A Input structures
Appendix B pre--based structures