Excitation mechanisms of individual CdTe/ZnTe quantum dots studied by photon correlation spectroscopy
Abstract
Systematic measurements of auto- and cross-correlations of photons emitted from individual CdTe/ZnTe quantum dots under pulsed excitation were used to elucidate non-resonant excitation mechanisms in this self-assembled system. Memory effects extending over a few excitation pulses have been detected in agreement with previous reports and quantitatively described by a rate equation model, fitting a complete set of correlation and PL intensity results. The important role of single carrier trapping in the quantum dot was established. An explanation was suggested for the unusually wide antibunching dip observed previously in X-X autocorrelation experiments on quantum dots under cw excitation.
pacs:
78.55.Et, 73.21.La, 78.67.-n, 78.47.+p, 42.50.DvI Introduction
The emerging field of quantum information has given rise to an interest for sources of photons-on-demand. Semiconductor light sources offer important advantages, such as low power consumption and possibilities of integration with existing electronics. Precise knowledge of quantum dot (QD) excitation mechanisms is of primary importance for the creation of semiconductor sources of photons-on-demand. In CdTe/ZnTe QDs, some aspects of non-resonant excitation are not yet fully understood, e.g., long components of photoluminescence (PL) decayPiechal05 and the unusually wide antibunching dip in autocorrelation of photons from exciton recombinationCouteau05 (excitonic photons). For the prototypical InAs/GaAs system, it has been established by Santori et al.SantoriSubm that among the many memory processes in QD optical excitation, medium time scale (subs) blinking leads to the enhancement or suppression of excitonic photon autocorrelation for resonant or non-resonant QD excitation respectively. The QD charge state variation was suggested as the source of these effects. We present here a systematic study of non-resonant excitation mechanisms by photon correlation spectroscopy of CdTe/ZnTe single quantum dots.
II Sample and characterization
The sample was grown by molecular beam epitaxy on a (001) oriented GaAs substrate, as described in Ref. Karcz99, . A 4 m CdTe buffer layer was followed by a 100 nm ZnTe barrier. Then two monolayers of CdTe were grown, forming fluctuation-type quantum dots. The QD layer was overgrown by a ZnTe barrier of 50 nm thickness. Transmission electron microscopy measurements performed on such samples revealed quantum dots with a typical lateral size of 3 nm and a density of cm-2 (Ref. Karcz99, ).
The basic characterization was performed by standard CW photoluminescence (PL) excited with an Ar-ion laser and by time-resolved photoluminescence excited at eV by frequency-doubled 150 fs pulses from a Ti:sapphire laser. In the time resolved characterization a streak camera (resolution of about 10 ps) was used to record spectral and temporal distribution of PL. A typical PL spectrum is presented in Fig. 1(a). Three major components can be distinguished. The set of three lines at the highest energy ( eV) is related to the exciton emission from the barrier material (ZnTe). The middle energy component ( eV) is due to the wetting layer, and the one at the lowest energy ( eV) is related to the emission from quantum dots. This natural assignment is consistent with the results of further experiments.
The typical temporal profiles of the barrier and QD lines are presented in Fig. 1(b). The ZnTe emission consists of a fast-decaying ( ps) free exciton line at eV and long-lived lines of acceptor-bound and donor-bound excitons. The fast decay provides information on the decay of free excitons and was used as an approximate measure of the characteristic time of quantum dot excitation.
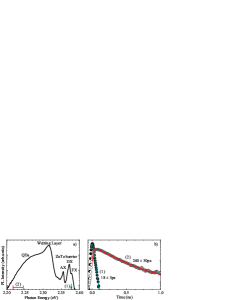
The decays of the QD PL lasted much longer. The dominant decay time was about ps, but longer components were also observed. The decay is not straightforward in interpretation. The macro-PL signal is composed of many different lines related to different quantum dots. In particular, lines due to neutral excitons (X), biexcitons (XX) and trions (CX) may decay with different characteristic times. Thus, the measurements on single quantum dots were used to determine decay times of particular lines (see Sec. III.3). However, the rise times of the QD PL ( ps) were significantly longer than the resolution-limited rise times of the ZnTe PL ( about 10 ps) and close to the decay time of the FX line (Fig. 1(b)). This shows that the QDs are not excited directly by light pulses and points to the transfer of carriers (excitons) from barriers as a source of QD excitation. The characteristic time of this transfer will be used in the rate equation model presented in Sec. IV.1. The same values have been determined by Viale et al.Viale03 in a PL dynamics study of a similar CdTe/ZnTe QD system, and attributed to relaxation processes from excited to the ground QD exciton state. As we will see in Sec. IV.2, such an interpretation cannot be maintained in our case.
III Single quantum dot spectroscopy
In order to achieve a better insight in QD excitation and recombination processes, several different experiments on single QDs were performed such as precise determination of excitonic line energy positions, measurement of QD in-plane anisotropy (not shown), and dependence of QD PL intensity on excitation power (Sec. III.2). In order to obtain excitonic radiative lifetimes we measured the decays of individual QD emission lines (Sec. III.3). Preliminary Excitation Correlation Spectroscopy (CES) experiments on individual quantum dots were performed (Sec. III.4) to estimate the temporal scale of the QD excitation processes. Correlated photon counting with femtosecond pulsed excitation was also performed (Sec. III.5). Both autocorrelation and cross-correlation were measured, providing information on QD excitation mechanisms.
III.1 Experiment
For studies of individual quantum dots, a micro-photoluminescence (-PL) setup was used, assuring a spatial resolution better than m. The sample was fixed directly on the front surface of a mirror type microscope objectiveJasny (N.A.) inside a pumped helium cryostat and cooled down to K. An Argon ion laser (488 nm or multi-line UV) was used for cw excitation. For time-resolved measurements, frequency-doubled pulses of a mode-locked Ti:Sapphire laser were used (repetition frequency of 76 MHz, spectral and temporal width 2.6 nm and less than 1 ps respectively). Averaged excitation power was varied in a range from 10 nW to 4 W by use of neutral density filters.
In Excitation Correlation Spectroscopy the PL was excited by pairs of pulses obtained by splitting of the pulsed laser beam. Temporal separation between the two pulses of each pair, controlled by an optical delay line, ranged from 0 to 1.5 ns. Time-integrated spectra were recorded with a CCD camera. Single photon correlation measurements were performed in a Hanbury-Brown and Twiss setup with spectral filtering by grating monochromators (spectral resolution 200 eV). Each monochromator was equipped with a CCD camera and an avalanche photodiode (APD) serving as a single photon detector (temporal resolution 750 ps, quantum efficiency 55% at 560 nm, dark counts 200/s). For PL decay measurements one of the APDs was replaced by a microchannel plate (MCP) photomultiplier tube (temporal resolution of 40 ps). A correlation card with a multichannel analyzer (4096 time bins, 146 ps width each) was used to generate histograms of correlated photon detection events versus delay, equivalent to an unnormalized second order correlation function.
The same card was used to record PL decay curves by measuring time distance between photon detection and laser pulse reference signal. The channel width was set to 37 ps in that case.
Certain experiments were performed at doubled pulse repetition frequency. This was achieved by dividing the laser beam in a nonpolarizing beamsplitter and delaying one of the components by half (6.6 ns) of the initial repetition period, before combining both components in a single beam.
III.2 Identification of single QD PL lines
Because of the high dot density, individual dot lines could be well resolved only in the long-wavelength tail of the spectrum. In a previous study on the same sampleKudelski05 we found that a typical spectrum of an individual QD contains a neutral exciton line, accompanied by biexciton and charged exciton lines, at about 13 meV and 11 meV below respectively. The identification was evidenced by a series of experiments, including synchronized line energy jumps, in-plane optical anisotropy, and Zeeman effect measurements. We selected for further measurements a quantum dot emitting a group of PL lines presented in Fig. 2.
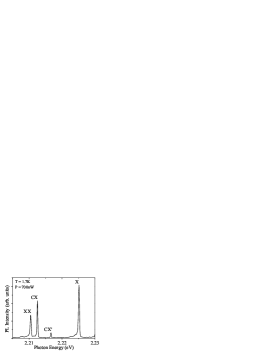
The excellent mechanical stability of our experimental setup allowed us to follow the microphotoluminescence of this quantum dot during weeks of measurements. The main results of the paper were confirmed for several other quantum dots. Besides the lines corresponding to those identified in Ref. Kudelski05, , a weak line CX’ appears in the spectrum. Its relative energy position corresponds to a negatively charged exciton line, identified by Besombes et al.Besombes02 in photoluminescence of a similar system of self assembled CdTe/ZnTe QDs. We assume therefore a tentative identification of CX and CX’ lines as due to positively and negatively charged excitons respectively, recombining in the same quantum dot.
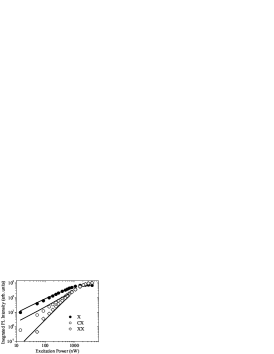
By measuring in-plane optical anisotropy, we confirmed equal absolute values and opposite signs of the anisotropic exchange splittings for X and XX lines and no measurable anisotropy for CX and CX’ lines, as expected for the assumed identification Kudelski05 . In further experiments we focused our attention on the three strongest lines of the spectrum: X, CX, and XX. We measured the PL spectra at different excitation powers. Figure 3 shows the power dependence of the integrated intensity of each of the three lines. The observed superlinear behavior of XX line and approximately linear one of X and CX lines support the assumed identification.
Final proof of this identification is provided by single photon correlation measurements presented below.
III.3 Measurements of PL decay on individual QD
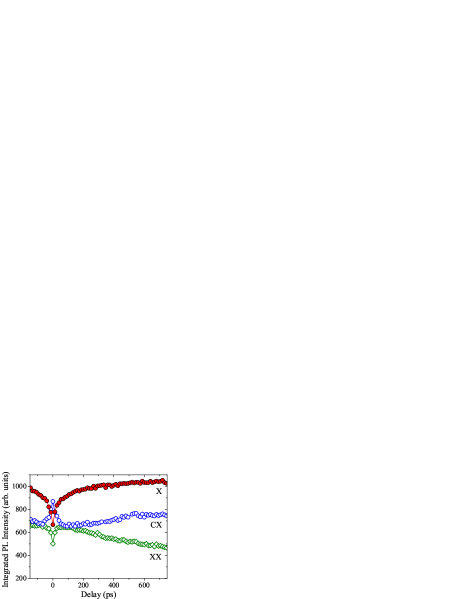
The time-dependent intensities of PL emission from X, CX, and XX states under pulsed excitation are presented in Fig. 4.
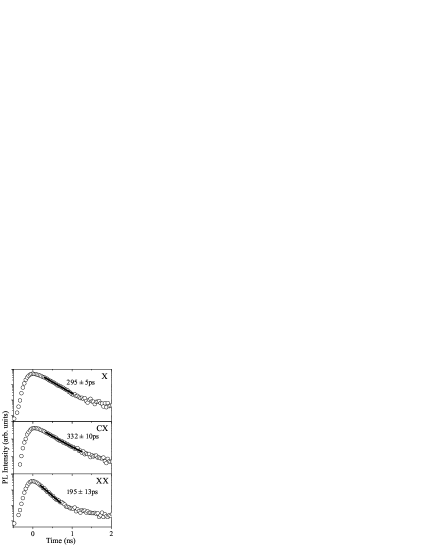
Two components, a fast and a slow one, are present in all the recorded decays, in agreement with previous observations on CdTe/ZnTe QDs.Couteau05 ; Piechal05 The fast component represents excitonic radiative lifetime, while the (much weaker) slow component, usually in II-VI systems attributed to dark exciton contribution,Labeau03 ; Patton03 is probably due to excitation delayed by some trapping processes.Piechal05 The data was fitted with monoexponential decay applied to the ’fast’ part of the decay curve (as indicated in Fig. 4), producing radiative lifetime values ps, ps, ps, for exciton, charged exciton and biexciton respectively. The ratio of the exciton decay time to the biexciton decay time is equal to 1.5, which is consistent with previous results obtained on CdTe/ZnTeCouteau05 and InAs/GaAsSantori02 QDs. The decay time values obtained were used in the analysis of subsequent experiments.
III.4 Excitation Correlation Spectroscopy
The ECS technique, used mainly for studies of quantum wells, Yamada95 has previously been applied to QDs to study coherent processes.Besombes03 ; Young02 It provides an excellent temporal resolution, limited principally by the width of the exciting laser pulse. We performed preliminary ECS experiments to check the time scale of QD excitation processes, inaccessible in our single QD PL decay measurements. Figure 5 shows integrated intensity of the three PL lines from a selected QD as a function of the delay between the two excitation pulses. Besides the effects on the scale of the radiative recombination times (hundreds of ps), pronounced sharp structures are visible on a scale of order of tens of ps. We attribute them to trapping of carriers and excitons by the QD, in agreement with the discussion of time resolved measurements on the QD ensemble in Sec. II. A detailed discussion of ECS measurements will be presented elsewhere.
III.5 Single photon correlation measurements
The results of correlation measurements involving X, CX, and XX states from the chosen QD are presented in Fig. 6.
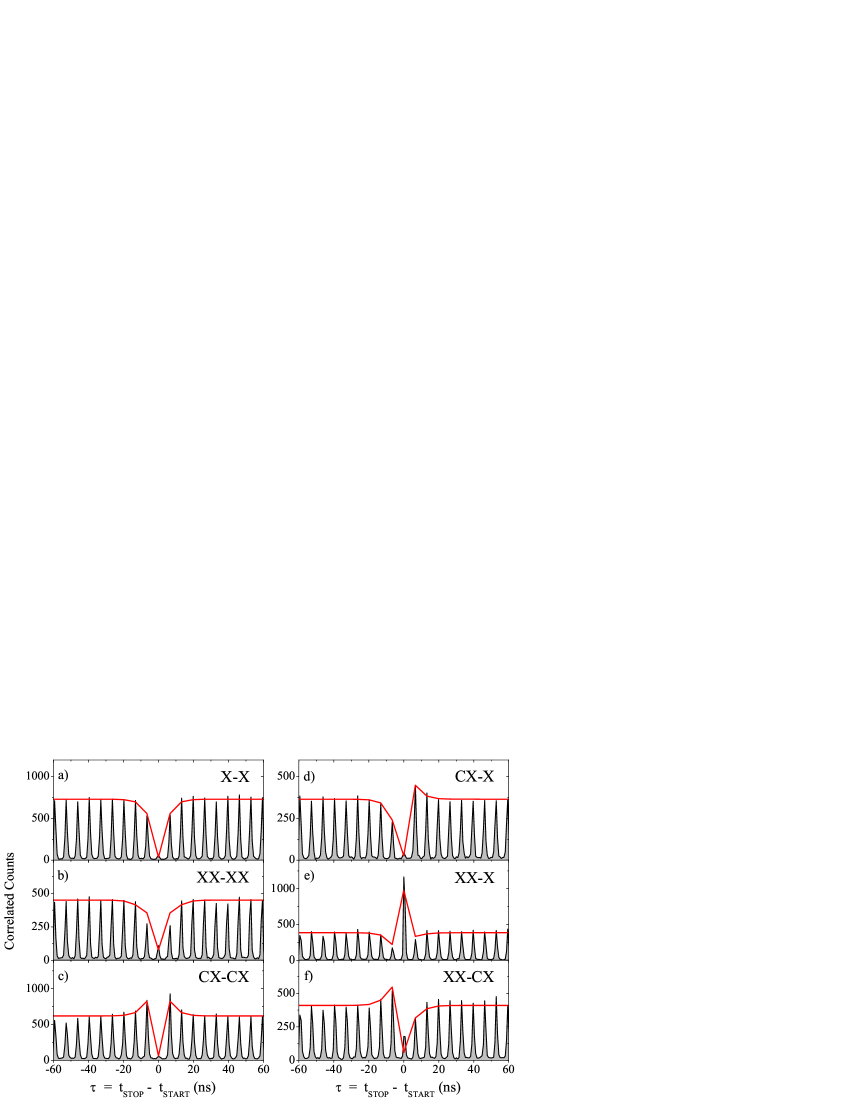
The each of six histograms consists of distinct peaks separated by a 6.6 ns excitation repetition period. No background subtraction was made. The signal between the peaks is negligible, indicating that the emission from the QD is truly locked to the pulsed excitation. The strong suppression of the central peak at (antibunching) visible in X-X, CX-CX, and XX-XX autocorrelation histograms (Fig. 6(a-c)) constitutes evidence of single photon emission. An enhancement of the central peak in XX-X crosscorrelation (Fig. 6(e)) confirms the presence of the biexciton-exciton cacscade, while its suppression in crosscorrelations between different QD charge state transitions (Figs. 6(d) and 6(f)) confirms our identification, as no X-CX or XX-CX cascades are expected. These results confirm the potential of CdTe/ZnTe QDs as sources of single photons or photons pairs ”on demand”, in agreement with previous reports.Couteau05
Apart from the effects on the zero delay peak, all the histograms presented show that more than one excitation period is necessary to reach a steady state. Similar long time scale memory effects (blinking), observed previously in autocorrelation measurements on InAs/GaAs QDs, were interpreted recentlySantoriSubm ; Ulrich05 in terms of QD charge state variation. We present here a systematic study of these effects by measuring various types of correlations.
To check the evolution of the QD state between the excitation pulses we performed some of the correlation measurements at two different repetition periods ns or 13 ns. We established that the correlation functions did not depend on the time interval between excitation pulses, as seen in Fig. 7. In order to evaluate function (n) integrated counts C(n) of the peak number n were normalized according to the formula: , where are single counters rates, is total acquisition time, and is repetition period.Beveratos02 The negligible contribution of background counts was not taken into account in the calculation.
In other words the peak consecutive number n is a good parameter to present the correlation results, rather than the commonly used time coordinate.Ulrich05
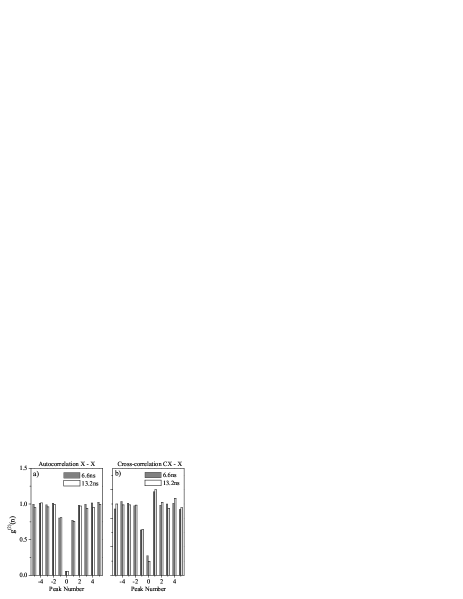
This indicates that the QD state remains frozen between the excitation pulses within the accuracy of our correlation experiment, no matter whether the correlated transitions occur in the same (Fig. 7(a)) or in different (Fig. 7(b)) QD charge states. Therefore in further discussion we shall ignore in particular the long time-scale component observed in the PL decay measurements.
III.6 Capture of single carriers by the QD
The results of CX-X correlation measurements provide direct evidence for the important role of single carrier capture in QD excitation. Indeed, CX-X coincidences are registered only if the charge state of the dot changes between the correlated emission events. If the carriers were injected predominantly in pairs possessing no effective charge, changes in the charge state of the dot would be unlikely, resulting in CX-X coincidence rates much smaller than X-X or CX-CX autocorrelation count rates, in contrast with our experimental results. Another argument for single carrier excitation comes from the strong asymmetry of the CX-X and XX-CX correlation histograms (a similar result has been obtained by Kiraz et al.Kiraz02 on InAs/GaAs QDs and Chang et al.Chang05 on InGaAs/GaAs QDs with cw excitation). Peaks at positive (negative) time delay in a CX-X histogram (Fig. 6(d)) represent detection of a neutral exciton photon after (before) charged exciton photon. In particular reexcitation of the quantum dot directly after the charged exciton recombination (n = 1 peak) requires a single carrier to be trapped, while three carriers are necessary for the opposite emission order (n = ). The much smaller probability of three trapping events following a single pulse results in smaller intensity of the n = peak than that of the n = 1 one. After several pulses the QD approaches a steady state with non-zero probabilities of finding the dot in a neutral or charged state, resulting in an intermediate asymptotic peak intensity. A similar explanation holds for the XX-CX crosscorrelation (Fig. 6(f)).
As reported previously in respect of X emission from nonresonantly excited III-V QDs,SantoriSubm we also observed the antibunching of photons emitted in n pulses: lower than average intensities of peaks at both sides of the central one (Fig. 6(a)). This indicates that excitation to X state is less probable when the dot is empty (following an X photon emission) than when it is in steady state condition. This difference between the steady state and empty ground state of the dot can be naturally explained in terms of the QD charge. In the case of XX autocorrelation (Fig. 6(b)) the decrease of n peaks is even more pronounced. This is because as many as four carriers are needed to repopulate the XX state. In the steady state the finite probability of the presence of a carrier in the quantum dot decreases the average number of carriers necessary to repopulate the radiative state in both cases (X or XX). An explanation of the suppression of n peaks in XX-X crosscorrelation histogram (Fig. 6(e)) may be obtained in the same spirit.
The opposite conduct is observed in the charged exciton autocorrelation: n peaks are higher than n = 0 one (Fig. 6(c)). This result is explained by the fact that after CX recombination the dot contains a single carrier, and two more carriers (of opposite sign) must be captured to repopulate the CX state. Peaks far from n = 0 are less intense because the steady state involves non-zero probability of a neutral empty QD state, requiring three carriers to enable the QD to emit another CX photon.
In summary, we explain the observed memory effects in terms of the QD charge state variation caused by capture of single carriers by the QD. Within our interpretation we would not expect any memory effects without single carrier capture: all n 0 peaks would have the same intensity (since ). The above analysis allows us to make qualitative predictions concerning correlation experiments performed under continuous wave excitation. The suppression of X-X and XX-XX autocorrelation in the neighborhood of zero delay should produce a broadening of the antibunching dip in the case of cw excitation. The same suppression observed in XX-X crosscorrelation should lead to a narrowing of the bunching peak in cw experiments. Therefore the contribution of single carrier capture can help to explain the unexpectedly wide antibunching dip in X-X autocorrelation under cw excitation reported for CdTe/ZnTe QDs,Couteau05 while no broadening was observed for the XX-X cross-correlation peak. Furthermore, our results indicate that lifetime determination of QD excitons based on an analysis of correlation measurementsBecher01 ; Persson04 may lead to significant errors if single carrier capture is neglected.
IV Model description of the experimental results
IV.1 Rate equation model
A simple model was introduced to describe our results quantitatively. It includes occupation probabilities of five QD states, presented as a vector where is the probability of finding i-th QD state occupied at time t. Since the QD confining potential is shallow,Piechal06 we do not include neutral or charged excitonic levels above the biexcitonic one. Due to the low intensity of the CX’ line in the PL spectrum we also neglected negative QD charge states. Then, possible transitions related to the capture of a carrier or of a neutral exciton as well as to radiative recombination are included as presented in Fig. 8.

Since the model deals only with level occupations, it cannot describe any coherent effects such as, e.g., polarization conversion.Astakhov06 It also neglects the fine structure of the excitonic states (e.g., dark excitons). Within the assumed approximations, the five occupation probabilities sum to unity. The dynamics of the occupation vector can be expressed by the equation: dn/dt = A(t) n(t) where A(t) is a transition rate matrix describing radiative decays and excitation processes:
| (1) |
The important role of trapping of single carriers has already been discussed above. We also include the possibility of excitation by trapping free excitons which (as follows from our simulations) is needed to achieve the observed quadratic excitation-power dependence of XX line intensity. The characteristic timescales of the electron, hole and exciton trapping (which may be different from one another) are larger than the laser pulse width because of relaxation processes within the barrier material. With the small outer barrier thickness of 50 nm we expect the trapping rates to rise almost instantaneously and to decay with characteristic times of the order of the barrier exciton lifetime (Sec. II). Therefore we assumed as a starting point a common exponential time dependence of the three excitation rates, with a decay time of ps. As we know the three radiative lifetimes , and from independent experiments, the only free parameters of the model remain constants , and understood as time-integrated respective capture rates, e.g., , where the Heaviside function equals to 0 for and to 1 for . We also allow for an arbitrary coefficient between the computed and measured count rates to account for (unknown) photon detection efficiency.
We integrated the rate equations numerically to compute n(t). Integration over time of , , gives PL intensities (per excitation pulse) for X, CX or XX respectively. The initial state is defined by a steady state or by a defined transition observed in the correlation experiment.
If we choose the initial point for integration to meet the steady state condition n(t) = n, we get relative line intensities in the PL spectrum. As far as the correlation experiment is concerned, the first photon unequivocally defines n(0) (e.g., if we detect a photon from the recombination of CX, we know the dot is occupied by a hole) and therefore we can calculate the expected PL intensity for the following period. The correlation function is proportional to this expected PL multiplied by the average PL intensity of the line of the first photon. The calculation of the correlation function for the central peak is slightly more complicated and can be written as:
| (2a) | |||
| (2b) |
where in the example case of X-CX crosscorrelation ”A” denotes the X state, ”a” denotes the QD state after X photon emission (empty dot), B denotes the CX state, ”b” denotes the QD state after CX photon emission (a single hole present), and ”s” denotes the steady state. is time dependence for a rate of emission from QD state denoted as ”K” when starting from the state denoted as ”m”.
IV.2 Description of the experimental results
The results of fitting the rate equation model to experimental data are presented in Figs. 3 and 6. The fitting procedure takes into account the results of PL intensity power dependence and the complete set of auto- and crosscorrelation measurements simultaneously. As seen in Fig. 6, the model describes the results of correlation measurements with excellent accuracy. The shapes of the correlation histograms, i.e. long timescale bunching and antibunching features are repeated by the model with high fidelity. The calculated number of counts in the zero delay peak on each histogram in Fig. 6 agrees with values obtained in experiment. The same set of fitting parameters allows the slopes and magnitude of X, CX and XX emission intensities to be described, plotted as a function of excitation power in Fig. 3. However, the region of strong, saturating excitation powers is not described adequately by the model (not shown). This aspect requires further study.
As a result of the fitting procedure, integrated capture rates per pulse for electron, hole and exciton were obtained: , , and , respectively. We see that the capture of a single carrier is more than three times more probable than capture of an electron-hole pair. This supports our interpretation (Sec. III.6) of the results of the auto- and crosscorrelation experiment indicating the role of single carrier capture processes in QD excitation.
The systematic simulations have convinced us that the integrated capture rates are the most important parameters influencing the PL intensity and correlation results. The detailed temporal distribution of the capture processes is less important, provided that their characteristic times are significantly lower than the QD PL decay times or the excitation repetition period. To study these processes in detail, different tools should be applied, such as pump-probe absorption measurements or Correlation Excitation Spectroscopy.
V Conclusions
We demonstrate the utility of photon correlation measurements to study non-resonant excitation mechanisms of semiconductor quantum dots. A qualitative analysis indicates the important role of single carrier capture processes and leads to an explanation of the unusually wide antibunching dip observed in previously reported autocorrelation measurements under cw excitation. The rate equation model introduced allowed us to describe a complete set of correlation and PL intensity results and to obtain quantitative information on the trapping rates of electrons, holes, and excitons by the quantum dot.
Acknowledgements.
This work was supported by the Polish Committee for Scientific Research (grants 2P03B 002 25, 2P03B 015 25, and PBZ-KBN-044/P03/2001), and the Polonium program.References
- (1) B. Piechal, J. Suffczyński, A. Trajnerowicz, M. Goryca, P. Kossacki, A. Golnik and J.A. Gaj, Acta Phys. Pol. A 108, 831 (2005).
- (2) C. Couteau, S. Moehl, J.A. Gaj, F. Tinjod, J.M. Gérard, K. Kheng, H. Mariette, R. Romestain and J.-P. Poizat, Appl. Phys. Lett. 85, 6251 (2005).
- (3) C. Santori, D. Fattal, J. Vučkovic̀, G.S. Solomon, E. Waks, and Y. Yamamoto, Phys. Rev. B 69, 205324 (2004).
- (4) G. Karczewski, S. Maćkowski, M. Kutrowski, T. Wojtowicz, and J. Kossut, App. Phys. Lett. 74, 3011 (1999).
- (5) Y. Viale, P. Gilliot, O. Cregut, J.-P. Likforman, B.Honerlage, R. Levy, L. Besombes, L. Marshal, K. Kheng, H. Mariette, Mat. Sci. Eng. B 101, 55 (2003).
- (6) J. Jasny, J. Sepioł, Chem. Phys. Lett. 273, 439 (1997).
- (7) A. Kudelski, K. Kowalik, A. Golnik, G. Karczewski, J. Kossut, J.A. Gaj, J. Lumin. 112, 127 (2005).
- (8) L. Besombes, K. Kheng, L. Marsal, and H. Mariette, Phys. Rev. B 65, 121314(R) (2002).
- (9) O. Labeau, P. Tamarat, and B. Lounis, Phys. Rev. Lett. 90, 257404 (2003).
- (10) B. Patton, W. Langbein, and U. Woggon, Phys. Rev. B 68, 125316 (2003).
- (11) C. Santori, G.S. Solomon, M. Pelton, and Y. Yamamoto, Phys. Rev. B 65, 73310 (2002).
- (12) Y. Yamada, T. Mishina, Y. Masumoto, Y. Kawakami, J. Suda, S. Fujita, and S. Fujita, Phys. Rev. B 52, R2289 (1995).
- (13) L. Besombes, J.J. Baumberg, and J. Motohisa, Phys. Rev. Lett. 90, 257402 (2003).
- (14) D.K. Young, L. Zhang, D.D. Awschalom, and E.L. Hu, Phys. Rev. B 66, 081307(R) (2002).
- (15) S.M. Ulrich, M. Benyoucef, P. Michler, N. Baer, P. Gartner, F. Jahnke, M. Schwab, H. Kurtze, M. Bayer, S. Fafard, Z. Wasilewski, and A. Forchel, Phys. Rev. B 71, 235328 (2005).
- (16) A. Beveratos, S. Kühl, R. Brouri, T. Gacoin, J.-P. Poizat, and P. Grangier, Eur. Phys. J. D 18, 191 (2002).
- (17) A. Kiraz, S. Fälth, C. Becher, B. Gayral, W.V. Schoenfeld, P.M. Petroff, Lidong Zhang, E. Hu, and A. Imamoǧlu, Phys. Rev. B 65, 161303(R) (2002).
- (18) W.-H. Chang, H.-S. Chang, W.-Y. Chen, T.M. Hsu, T.-P. Hsieh, J.-I. Chyi, and N.-T. Yeh, Phys. Rev. B 72, 233302 (2005).
- (19) C. Becher, A. Kiraz, P. Michler, A. Imamoglu, W.V. Schoenfeld, P.M. Petroff, Lidong Zhang, and E. Hu, Phys. Rev. B 63, 121312(R) (2001).
- (20) J. Persson, T. Aichele, V. Zwiller, L. Samuelson, and O. Benson, Phys. Rev. B 69, 233314 (2004).
- (21) B. Piechal et al., unpublished
- (22) G.V. Astakhov, T. Kiessling, A.V. Platonov, T. Slobodskyy, S. Mahapatra, W. Ossau, G. Schmidt, K. Brunner, and L.W. Molenkamp, Phys. Rev. Lett. 96, 27402 (2006).