Systematic characterization of thermodynamic and dynamical phase behavior in systems with short-ranged attraction
Abstract
In this paper we demonstrate the feasibility and utility of an augmented version of the Gibbs ensemble Monte Carlo method for computing the phase behavior of systems with strong, extremely short-ranged attractions. For generic potential shapes, this approach allows for the investigation of narrower attractive widths than those previously reported. Direct comparison to previous self-consistent Ornstein-Zernike approximation calculations are made. A preliminary investigation of out-of-equilibrium behavior is also performed. Our results suggest that the recent observations of stable cluster phases in systems without long-ranged repulsions are intimately related to gas-crystal and metastable gas-liquid phase separation.
pacs:
61.20.Lc, 64.60.-i, 61.46.Bc, 82.70.DdI Introduction
Colloidal systems with short-ranged interactions serve as a minimal model of complex fluids used in a variety of technological applications Russel et al. (1991). While such systems are important in the applied realm, their intrinsic phase behavior is of great fundamental interest. Upon adding polymer to an otherwise uniform colloidal suspension, an entropic depletion interaction is induced Asakura and Oosawa (1954); Vrij (1976). The range and strength of this attractive interaction may be controlled by the length and concentration of the added polymer. Thus, exquisite control may be experimentally exercised over such systems, which allows for an exhaustive exploration of the temperature-density phase diagram for nearly any range of attractive interaction Renth et al. (2001); Verma et al. (1998); Ramakrishnan et al. (2002).
At high volume fractions, depletion attractions have been shown to induce an inverse melting behavior, such that the viscosity of a hard-sphere suspension close to its colloidal glass transition is significantly reduced Dawson et al. (2001); Pham et al. (2002). This suspension may be revitrified by addition of still more polymer. Thus, two glassy phases appear to exist at the same volume fraction: one induced by the repulsions and one induced by strong attractions Dawson et al. (2001). It has been speculated that the attractive glass state at high volume fractions can be continuously connected to a gel state at lower volume fractions Bergenholtz et al. (2000). A major difficulty with the connection between attractive glass and colloidal gel is that phase separation often intervenes Cates et al. (2004); Foffi et al. (2005a). Phase separation into colloid rich and colloid poor regions may become anomalously slow if the density of the colloid rich region is close to the density of the uniform attractive glass at high volume fractions. This process leads to weak colloidal gels whose connection with near-equilibrium high volume fraction attractive glasses is complicated by the interplay of vitrification and phase separation Verhaegh et al. (1997); Manley et al. (2005). Thus, the added dimension of out-of-equilibrium behavior may greatly increase the complexity of the various phases that may be observed in such systems.
In addition to colloidal gels induced by phase separation, various cluster phases have been recently experimentally observed Segre et al. (2001); Lu et al. (2006); Sedgwick et al. (2005). If charge resides on the colloids, then equilibrium microphase clusters may form due to the competition between short-ranged attraction and long-ranged charge repulsion Sciortino et al. (2004, 2005); de Candia et al. (2006). Interestingly, recent experiments that utilize sufficient salt to screen the charge on the colloids still show the existence of relatively stable large clusters. The existence of such clusters even in the absence of repulsion has been suggested theoretically Kroy et al. (2004). Lu et al. Lu et al. (2006) have observed large, relatively compact clusters at low volume fraction and low () attraction strength. Sedgwick et al. Sedgwick et al. (2005) have observed a “bead phase” of clusters that appears to exist only along a portion of the metastable gas-liquid binodal.
Clearly, the investigation of the nature of gel and cluster phases via computer simulation is complicated by the need for a precise characterization of the equilibrium phase diagram. Qualitatively, the role of short-ranged attractions in widening the gas-solid coexistence gap is well known Gast et al. (1983); Hagen and Frenkel (1994). The characterization of various phase boundaries for general short-ranged potentials, however, has been performed by integral equation methods Foffi et al. (2002) by a mix of Monte Carlo and analytic expansions Asherie et al. (1996); Lomakin et al. (1996), on systems with a moderately short attraction range ten Wolde and Frenkel (1997); Bolhuis et al. (2002); Pagan and Gunton (2005); Liu et al. (2005); Vliegenthart et al. (1999); Shukla (2000); Chang et al. (2004); Pellicane et al. (2003); Tavares and Sandler (1997); Dijkstra et al. (1999); Fortini et al. (2005), or short-ranged attractive systems with somewhat artificial forms that do not lend themselves to dynamical studies Miller and Frenkel (2003, 2004). In this work, we will combine several existing computational methodologies to produce a direct Monte Carlo approach that is capable of yielding essentially exact phase behavior over a wide range of the thermodynamic parameter space, for systems with extremely short-ranged attractive interactions.
In particular, we demonstrate the general applicability of a form of the Gibbs ensemble Monte Carlo (GEMC) Panagiotopoulos (1992) approach augmented with improved sampling techniques for the calculation of phase behavior in systems that mimic colloidal suspensions with short-ranged attractions. In addition, our approach allows for the direct sampling of configurations without additional a priori knowledge when the phase behavior is complex, such as in systems that exhibit microphase separation Charbonneau and Reichman (2006). We use the results gleaned from this implementation of GEMC to compare with several techniques, including the approximate but powerful self-consistent Ornstein-Zernike approximation (SCOZA) approach Foffi et al. (2002) and exact approaches such as thermodynamic integration Dijkstra (2002). With these results in hand, we make a preliminary study of the nonequilibrium phase behavior of systems presumably similar to those studied by Lu et al. Lu et al. (2006) and Sedgwick et al. Sedgwick et al. (2005) in the regimes where cluster phases might be expected. Our paper is organized as follows. In Sec. II, we discuss the application of our GEMC methodology to systems with short-ranged attractions, and we outline the systems that are studied in this work. In Sec. III, we compare the results of our GEMC to previously published results. In Sec. IV we study various aspects of the out-of-equilibrium behavior of systems similar to those published in recent experiments. Our studies are facilitated by the precise knowledge of the phase diagram afforded by the Monte Carlo method developed in this work. In Sec. V we conclude.
II Simulation techniques
(a) (b)
(c) (d)
Various potential shapes have been suggested to capture the phenomenology of short-ranged attractive systems. Two commonly used forms are the generalized Lennard-Jones (LJ) potential
| (1) |
with Hasegawa and Ohno (1997) and the hard core plus attractive Yukawa potential
| (4) |
with Foffi et al. (2002). Both are used in the current work. Results are reported in reduced units. Temperatures are in units of the well depth , distances are in units of the particle diameter , and time is rescaled by where is the mass of the particles.
GEMC with single particle displacement and exchange as well as volume exchange is used for the metastable gas-liquid equilibrium for two boxes of 256 particles (500 for and LJ potentials). Finite size effects were checked by comparing the results to that of a square-well potential with a width of Pagan and Gunton (2005). As the work was being completed, a paper with similar methodology (applied to square well fluids) appeared, and thus more details can be found there Liu et al. (2005). In the current work, of the moves are particle swaps, are particle displacements, and the rest are volume interchanges, while equilibrium and production runs involve at least , and sometimes reaching Monte Carlo cycles. When solid nucleated in the liquid box, only the intermediate results are retained for analysis.
For the gas-crystal equilibrium, the methodology developed by Chen and Siepmann is followed Chen and Siepmann (2000); Chen et al. (2001). This greatly increases the efficiency of GEMC in this regime. The boxes are configured such that one box contains only vapor and the other a slab of solid surrounded by vapor. In addition to basic GEMC moves ( particle displacements, particle swaps, symmetric and asymmetric volume exchanges) aggregation-volume bias Chen and Siepmann (2000) and its generalization to exchanges between two boxes ( each) are performed. For these simulations initial system sizes are 256 particles for the gas phase, 864 for the solid slab, and again a minimum of Monte Carlo cycles are performed for equilibration and production.
All dynamical results are performed with the Lennard-Jones potential using standard molecular dynamics integration for systems of size and with an integration step . Cooling is done by velocity resampling every steps starting from a liquid configuration. We do not expect a strong influence of the type of dynamics on the qualitative results Foffi et al. (2005b), so further studies with other dynamical protocols are not performed.
II.1 Finite-size effects
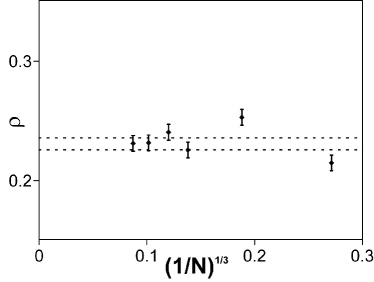
An obvious source or error exists in the approach we have employed to determine the gas-crystal coexistence line. In particular, the standard use of GEMC for gas-crystal coexistence would utilize a box of pure solid and a box of pure vapor with particle exchanges between the two boxes. In such a configuration, exchanges between boxes would be prohibitively infrequent. We have instead used the Chen and Siepmann approach where the solid box is replaced by a box containing a solid slab surrounded by vapor Chen et al. (2001). From the microscopic perspective, several possible finite-size effects arise. First, the crystal block might show anisotropy in its vapor pressure depending on the selection of the grain surface exposed to the gas. However, this is expected to be very small for spherically symmetric potential shapes. Second, at high densities, crystal surface fluctuations or other image effects may become significant. This was avoided by working at relatively low gas densities and by using a box of sufficient dimensions to eliminate periodic artifacts. From the thermodynamic standpoint, the Chen-Siepmann procedure can lead to biased results due to the fact that the free energy of the solid box now has a contribution from the surface. In principle, this error should scale as where is the surface tension and the crystal size. In previous studies, Chen and Siepmann have shown that their results are in quantitative agreement with the known gas-crystal coexistence behavior of several simple systems Chen et al. (2001). While they did not perform a study of finite size effects, their results suggest that, in at least some instances, it is indeed possible to obtain quantitative results efficiently with a modified GEMC approach that allows for metastable equilibrium via “coexistence” between a gas on the one hand and a gas-crystal mixture on the other. However, the convergence as a function of system size should be performed at each temperature and for each system, in order to ensure accurate results within the modified GEMC approach of Chen and Siepmann. Here, we carry out such a study.
In Fig. 1 we show the gas density obtained for and for a variety of different system sizes. After some noticeable damped oscillatory behavior for small system sizes, the value remains within the GEMC error width. We consider the density to be converged when the result has saturated within a band of densities whose width is that of the error bars of the GEMC procedure itself for a given size of the solid slab. The nontrivial convergence behavior hints at a possible lattice periodicity effect (e.g., the period of the behavior might be related to the number of particles in a layer of solid), but a more detailed analysis is left for a later study. The results presented in Fig. 1 are representative of the results found for other values of and that are presented in this work.
Thus, we are confident of the accuracy of the results for the gas-crystal lines presented in Figs. 2 and 3. While it is true that the method used here for gas-crystal coexistence can induce systematic error, it appears that such errors can be kept to a controllable size without undue computational effort, at least in the systems we have investigated. It should also be noted that while approaches such as thermodynamic integration do not suffer from the potential systematic bias discussed in this subsection, they still may lead to inaccurate results if a good reference system is not used (as could the case for extremely short-ranged attractive potentials) or if the systems utilized are too small. This will be discussed further in the next section.
III Comparison with SCOZA
Various aspects of the thermodynamic properties of systems with short-ranged attractions have been studied in the last decade Hagen and Frenkel (1994); ten Wolde and Frenkel (1997); Vliegenthart et al. (1999); Pagan and Gunton (2005); Liu et al. (2005); Foffi et al. (2002); Shukla (2000); Miller and Frenkel (2004). One of the interesting features of such systems is the possibility of metastable gas-liquid coexistence below the gas-crystal equilibrium region. However, no verification of integral equation predictions, other than in the Baxter limit of an infinitely narrow potential, has been made in extremely short-ranged attractive systems Miller and Frenkel (2004). SCOZA is generally viewed as being among the most accurate integral equation methods available Høye and Stell (1977, 1984). Predictions of phase diagrams for short-ranged potentials with hard-core Yukawa have been made using SCOZA and SCOZA-based hybrid methods Foffi et al. (2002). However, these results have only been compared with simulation results slightly over the limit of metastability with Hagen and Frenkel (1994); Shukla (2000); Foffi et al. (2002) for the gas-liquid binodal and up to for the gas-solid binodal Hagen and Frenkel (1994). The Baxter limit of infinitely small interaction range has also been reported via simulation Miller and Frenkel (2004), but only for the gas-liquid binodal. For colloidal depletion interactions, ranges of the order of to are of more interest, corresponding to for the hard-core attractive Yukawa. Simulated phase diagrams for systems with an interaction range as low as for square well Pagan and Gunton (2005); Liu et al. (2005), and for Derjaguin-Landau-Verwey-Overbeek (DLVO) Pellicane et al. (2003), LJ-based Vliegenthart et al. (1999); Chang et al. (2004); ten Wolde and Frenkel (1997), Asakura-Oosawa pair potential Tavares and Sandler (1997); Dijkstra et al. (1999); Fortini et al. (2005) have been reported, but none of these can easily be quantitatively compared with the SCOZA predictions, other than the cases presented in Ref. Dijkstra (2002).
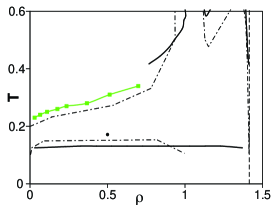
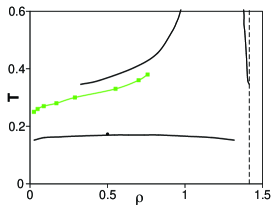
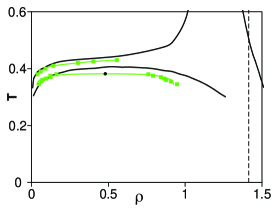
Calculated phase diagrams for the hard core attractive Yukawa potential are shown in Fig. 2. The metastable gas-liquid density-temperature binodal was fitted using , where Vega et al. (1992) and the critical temperature used in the fitting was extracted from the result of the Baxter limit Miller and Frenkel (2003) and mapped to this system by equating second virial coefficients as done for similar systems Foffi et al. (2005b). Due to the flatness of the curve, critical densities are harder to pinpoint. A value of appears to fit all of our simulated systems. No unique set of and parameters fit the binodal through the entire temperature range of our simulations, but a rather reasonable agreement was obtained nonetheless for fixed and . The results for the hard-core Yukawa potential for and for and are consistent with those of Ref. Dijkstra (2002) for nearby values of .
For the gas-solid binodal, a simple spline fit was made to the gas branch. Densities on the solid side are indistinguishable from that of close packing within measured precision. Much larger system sizes would be required to obtain a sufficiently precise measurement. This leads us to suspect the solid phase density results obtained by a recent paper are due to an erroneous density calculation scheme for these systems Liu et al. (2005). However, this is not the part of the phase diagram that is of interest here, and we will thus satisfy ourselves with a straight line at the close-packing density. Finally, the range of densities available for simulations did not allow for the study of solid-solid coexistence, known to take place in systems with an extremely short range of interaction Bolhuis and Frenkel (1994); Bolhuis et al. (1994).
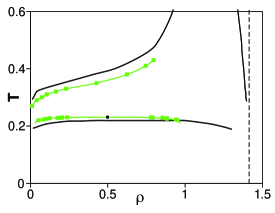
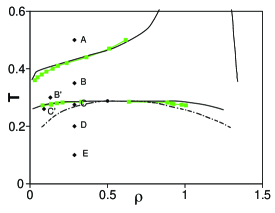
Comparing the phase diagrams of two different potential shapes with a similar range of attraction (), namely the LJ with and the hard core attractive Yukawa potential with , we observe that the interaction range is a good measure of gas-liquid phase separation metastability: the gap between the metastable gas-liquid critical point and the gas-solid binodal is in both cases. After shifting the phase diagram so as to match critical points, SCOZA predictions are seen to match the LJ simulation results just as well in Fig. 3. This is in the spirit of the extended corresponding state principle discussed above.
Comparison of GEMC simulation with SCOZA shows rather good agreement for the gas-solid binodal, especially for the wider interaction ranges of and . For the narrower ranges of and , we reach densities beyond the range numerically attainable for SCOZA calculations Foffi et al. (2002). Also, though the curves have similar shapes, the simulation results are shifted to lower temperatures with respect to the SCOZA predictions. On the high density side, phase boundaries would only be accessible through the GEMC methodology using much larger systems due to the fact that small blocks of crystal tend to melt completely at high vapor pressures. The pathological SCOZA predictions of solids beyond the close-packing density indicates the limitation of such an approach in high density regimes.
GEMC metastable gas-liquid binodals for and also agree well with SCOZA predictions, especially for the low density branch. It is difficult to reach lower temperatures as solid nucleation becomes facile in metastable finite-sized systems. This limits the range of temperatures where the metastable binodal data can be obtained. Furthermore, this approach breaks down for narrower interaction ranges when the flatness of the binodal does not allow for a sufficient separation of Monte Carlo time scales before the crystal nucleates. Obtaining spinodal curves by simulation would require precise dynamical measurement upon cooling and as its meaning is loosely defined in any case Foffi et al. (2002), no direct calculation of the spinodal was attempted. For further reference the SCOZA spinodal was included in the LJ phase diagram in Fig. 3 Foffi et al. (2002).
Finally, we conclude this section with a brief discussion of the comparison of our results for a very narrow attraction range () with that of thermodynamic integration techniques Dijkstra (2002). In principle, thermodynamic integration is the preferred method, since it does not have a systematic bias such as, for example, that discussed in Sec. II.1. However, in some important cases the methods presented here have some advantages over this direct approach. In particular thermodynamic integration may be difficult to perform if the repulsive portion of the potential is not of the hardcore variety or if a suitable reference system cannot be found. More importantly, in cases where the morphological characteristics of the phases are not known (such as in complex microphases or domain-forming systems Charbonneau and Reichman (2006)) it is of great advantage to have a direct Monte Carlo approach that does not need to make use of presupposed information. In Fig. 2a we compare the thermodynamic integration results of Ref. Dijkstra (2002) to that of our GEMC approach. While the results of Ref. Dijkstra (2002) are consistent with our results for smaller values of , here, a difference of about can be seen in the gas-crystal coexistence temperatures at low densities. We believe, based on an analysis of the type given in Sec. II.1 that our results should be quantitatively accurate. Interestingly, a similar discrepancy of the same magnitude and direction exists between the location of the gas-liquid binodal line and the location of the critical point as found by the extended corresponding state predictions. It is possible that the small system size () used in the thermodynamic integration study is one source of these discrepancies. It would be of some interest to examine these issues further in a future study.
IV Nonequilibrium kinetics in various regions of the phase diagram
(a) (b) (c)
The precise location of various phase boundaries has important implications for the dynamics that might be observed upon quenching a homogeneous system into different temperature and density regions of the phase diagram. Interesting out-of-equilibrium phenomena have been observed experimentally depending on the depth of the quench, the initial density, and the quench rate. Using precise characterization of the phase diagram for the LJ () system of Fig. 3, we use direct molecular dynamics simulation to investigate some aspect of this kinetic behavior. For clarity, we shall refer to the various labeled points in Fig. 3. Points A-E are located at a volume fraction and at , , , , and from A to E, respectively. Points B’ and C’ refer to volume fraction and and temperature and , respectively. The behavior of the system at point A, as expected, is that of a homogeneous gas as verified by direct dynamical simulation. No further mention of the behavior in this region of the phase diagram will be made.
IV.1 Gas-crystal phase coexistence
Cluster phases in colloidal systems may exist for a variety of reasons Sear and Frenkel (2003); Malescio and Pellicane (2003); Lopes (2002); Mladek et al. (2006). Perhaps the most ubiquitous reason is the presence of both short-ranged attractions and long-ranged repulsion. This repulsion is most commonly thought to arise from excess charge residing on the colloidal particles. Recent experiments, however, have suggested that even when charge repulsion is highly screened, compact clusters may appear and evolve in a rather stable fashion. Lu et al. have recently studied, via confocal microscopy, the evolution of attractive colloidal suspensions in a high salt environment Lu et al. (2006). They find evidence for stable, compact clusters of more than 500 particles. This behavior is most prominent at rather weak attraction strength () and an intermediate range of attraction (). Sedgwick et al., in screened lysozyme solution, find evidence for a compact “bead” phase in a different region of the phase diagram Sedgwick et al. (2005). The bead phase of Sedgwick et al. appears to exist only close to the metastable gas-liquid binodal. Therefore, the ability to locate precise boundaries in the equilibrium phase diagram is a fundamental prerequisite for the study of such kinetic behavior. Below, we undertake a preliminary study of nonequilibrium behavior in the regions of the phase diagram where such cluster phases have been found.
In the study of Lu et al., the attraction strength where a cluster phase is observed would appear to be in the broad gas-crystal coexistence region Lu et al. (2006). Further support for this may be found in the degree of crystallinity seen in the clusters imaged by Lu et al. 222In the experiments of Lu et al., surface-induced crystallization is seen in this regime when clusters contact the coverslip boundary. P. J. Lu (private communication).. In our simulations, we find that, by inserting a small face-centered-cubic nucleus, the subsequent crystal growth is rather facile and reaches equilibrium with the gas phase rapidly. The behavior occurs essentially throughout the gas-crystal coexistence region above the metastable gas-liquid binodal. The idea that nucleation and growth of clusters can be self-limiting, leading to a metastable cluster fluid phase, was theoretically put forth by Kroy, Cates, and Poon Kroy et al. (2004). Lu et al. propose that the rearrangement of particles at the surface and on the interior of a cluster may occur on a different time scale than the time scale on which clusters diffuse away from each other, rendering clusters long-lived. This notion is similar to that of Ref. Kroy et al. (2004).
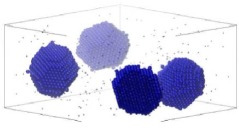
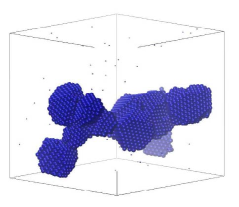
To test this kind of hypothesis we study larger system than that possible by GEMC. We artificially nucleate the solid by carving out irregular portions of the equilibrium crystal ( particles each) allowing the surface of these clusters to come to equilibrium with the vapor under the appropriate thermodynamic conditions, and then allowing the clusters evolve via molecular dynamics. We have implemented this procedure at points B and B’ of the phase diagram in Fig. 3. While this procedure is a crude mimic of the kinetics of gas-crystal nucleation, it does provide a useful test of self-limited cluster growth as a stabilizing mechanism of the cluster phase observed by Lu et al. Lu et al. (2006). We find that smaller compact clusters merge without much impediment upon collision with each other. This process is depicted in Fig. 4. No trajectories showed cluster dissociation. It should be noted that the same behavior is observed at higher temperatures as well, where the initial cluster surface morphologies are rougher due to a higher equilibrium vapor pressure. We did not find any evidence of a strong cluster size dependence for this process. Thus, while we did not make a systematic study of the effects of quench rate, system size, or polydispersity, one possibility for the cluster fluid phase observed by Lu et al. is simply a slowly evolving solid nucleation and growth process ††footnotemark: . Interestingly, Sedgwick et al. find that the crystal phase is observed for a wide range of volume fractions and temperatures effectively in the gap between gas-solid and metastable gas-liquid coexistence. This is consistent with our findings in the analogous region of the phase diagram.
A final possibility that should be mentioned with regard to the cluster phase observed by Lu et al. is accumulation repulsion Louis et al. (2002); Likos et al. (2005). Even in the absence of charge, it is possible that the neutral added polymer may induce an effective repulsion between colloidal spheres, due to its enhanced concentration at the surface of the colloids. It would appear unlikely that this repulsion is sufficient to render clusters thermodynamically stable in the system studied by Lu et al. However, it is possible that this accumulation repulsion could significantly enhance metastable cluster lifetimes. To the best of our knowledge, a systematic study of nucleation and growth kinetics as a function of repulsion strength and range has never been performed (see, however, Pini et al. (2000)). Such a study would be quite useful in understanding the role of the added polymer on the stability of the cluster phase observed by Lu et al.
IV.2 Metastable gas-liquid phase separation

(a) (b) (c)
A generic feature of systems with short-ranged attractions is the existence of a metastable gas-liquid binodal buried below the gas-crystal coexistence line. This feature gives rise to another possible phase separation mechanism. In particular, a two-step nucleation process, where the first step of phase separation is the formation of a higher density liquid and the subsequent step involves the transformation of the high density liquid into a crystal, arises. This two-step nucleation process can proceed by a lower free energy pathway than that of classical nucleation, thus accelerating the rate of crystal formation. At low densities, just below the metastable gas-liquid binodal, interesting nonequilibrium behavior has been reported.
In particular, it is in the vicinity of the metastable gas-liquid coexistence line that the bead phase of Sedgwick et al. is observed Sedgwick et al. (2005). Thus, in this section, we investigate the dynamics of domain growth at two volume fractions (point C and C’ in Fig. 3) just below the metastable gas-liquid binodal.
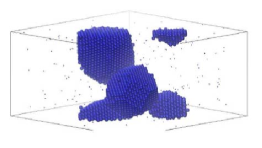
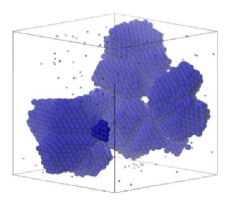
When our system is quenched to point C of Fig. 3, rapid nucleation of ramified liquid regions, followed by solidification occurs. Figure 5 shows this two-step process which is clear upon visual inspection, and may also be observed in the time evolution of the energy of the system per particle, as shown in Fig. 7. For lower density quenches (point C’), liquid beads nucleate quickly. The evolution of the low density droplet phase then occurs via cluster diffusion. Generically, the droplets begin to crystalize before they coalesce, as seen in Fig. 6. The crystal growth process thus takes place by cluster coalescence, and it strikingly similar to the growth of the crystal above the metastable gas-liquid binodal. It should be noted that the entire process illustrated in Fig. 6 occurs spontaneously, in contrast to the ad hoc seeding procedure that we have performed to illustrate gas-crystal phase separation at higher temperatures above the gas-liquid binodal. Indeed, this is possible due to the rapid formation of liquid beads in this region of the phase diagram.
Clearly, we do not observe that liquid beads are long-lived along the low temperature side of the metastable gas-crystal binodal. This appears to contrast with the results of Sedgwick et al. Sedgwick et al. (2005). It is interesting to note, however, that recent confocal microscopy studies of Lu et al. 333P. J. Lu (private communication). at do show clear coalescence of clusters. There are several reasons why the final stages of nucleation might occur more slowly in the experimental system of Sedgwick et al. than in our simulations. First, our system is monodisperse, which facilitates the crystallization process. Crystal beads may coalesce more easily due to surface faceting, providing a more regular contact area between clusters. Second, the lysozyme units of Sedgwick et al. carry some residual charge which may hinder crystal formation. Third, sedimentation may play some role, and is clearly not modeled in our system. It should also be mentioned that the quench rate may play a significant role in the formation of such phases, as Sedgwick et al. have mentioned. Although we have not made a systematic study of the effects of quench rate, our preliminary studies show the same behavior for systems rapidly quenched to point C’ and those that reach metastable equilibrium just above point C’ (homogeneous fluid) and are then slowly quenched to point C’. Thus, we find no clear evidence of quench rate dependence in our system in this region of the phase diagram.
IV.3 Deep quenches: gels
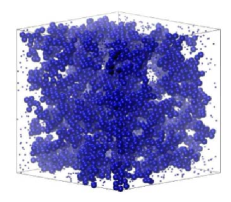
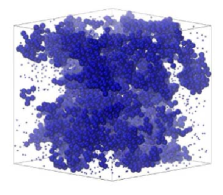
When systems with short-ranged attractions are quenched below the metastable gas-liquid binodal curve, phase separation characterized by large-scale fluctuations sets in. At short times, the system segregates into liquid-rich and liquid-poor regions. Since the gas-liquid critical point is buried below the gas-solid coexistence line, the fluid phase is metastable with respect to the crystal. Thus, an additional process, the nucleation of the stable crystal phase from the metastable fluid competes with spinodal decomposition, and the time dependence of the nonequilibrium process is governed by a subtle interplay of factors, such as the relative rates of solid nucleation within the liquid to the rate of the initial decomposition process ten Wolde and Frenkel (1997). If either crystallization or vitrification occurs locally inside the dense component before the phase separation process is complete, the long wavelength segregation of phases slows down considerably. On time scales relevant for colloidal experiments, porous solids that bear the imprint of this arrested phase separation appear Cates et al. (2004); Verhaegh et al. (1997); Manley et al. (2005); Foffi et al. (2005a, b); Lodge and Heyes (1999). Since many recent experimental and computational studies of this route to colloidal gelation have been carried out, we confine ourselves here to some rather qualitative features of this process in this section. The distinction between the past work and the work presented here is that a rather precise characterization of such behavior with respect to the location of various phase boundaries (here the location of the metastable gas-liquid binodal) may be made.
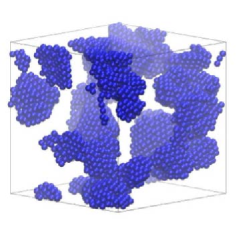
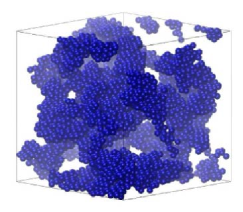
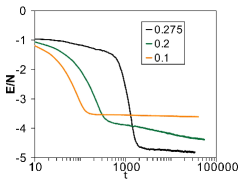
In Fig. 7(a) and Fig. 7(b) two snapshots of the intermediate evolution of the phase separation process are shown. These snapshots correspond to direct quenches to points D and E in Fig. 3, respectively. While quenches just below the metastable gas-liquid binodal allow for facile crystallization, the evolution of the system for deeper quenches is anomalously slow. This is clearly illustrated by the time dependence of the energy per particle as illustrated in Fig. 7(c). For the intermediate quench (D) there is residual evolution of the energy, while for deeper quenches (E) near complete arrest is observed.
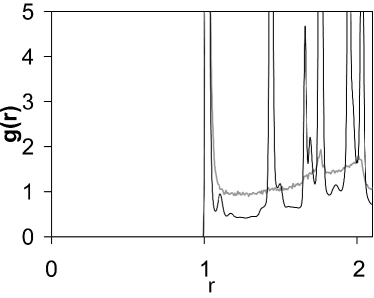
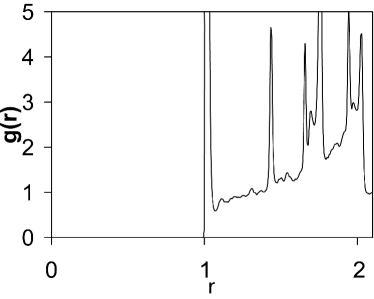
Given the weaker bonding relative to temperature at point D, it is expected that the system may explore deeper metastable states during its slow evolutions. This is clearly seen in Fig. 7(c). Correspondingly, a greater degree of crystallinity is expected in the interior of the porous solid when compared to deeper quenched structures that arrest at earlier times during their structural evolution. Indeed, as shown in Fig. 8 more resolved crystal peaks are observed in the radial distribution function for more shallow quenches.
A topic of great interest of late is the arrest of phase separation by vitrification as opposed to crystallization. In the investigation here, the monodisperse nature of the sample favors crystallization. By making the sample polydisperse, arrested phase separation will occur via a local glass transition of the dense phase Foffi et al. (2005a, b). The characterization of the precise location of such a glass transition is greatly complicated by a variety of features, including the explicitly nonequilibrium nature of the process and the fact that the effective density of the component undergoing the glass transition is the thermodynamically defined bulk density. The use of GEMC enabling essentially exact determination of stable and metastable phase behavior, perhaps combined with the ideas of Ref. Sastry (2000) might lead to a more precise characterization of the notion and location of a “glass transition” under the metastable gas-liquid binodal residing in the expanded parameter space that includes quench dependent and thermodynamic parameters.
V Conclusions
In this work we have demonstrated the general utility and feasibility of GEMC for the study of the phase behavior of systems with rapidly varying, short-ranged attractions. Thus, rather exhaustive study of both the equilibrium and nonequilibrium behavior of such systems is possible for generic potentials and with precise reference for various phase boundaries. Here, we have mainly made comparison to the predictions of the SCOZA approach and made a preliminary investigation of dynamics. In light of recent experiments that show interesting nonequilibrium phases in systems with predominantly short-ranged attractions, more work should be performed to understand the role of quench rate, polydispersity, gravity, hydrodynamics, and other factors that may influence the dynamical behavior of such systems. Another avenue worthy of study are systems that possess long-ranged repulsion in addition to short-ranged attraction. Such systems have been the focus of intense recent study. Due to the competing lengthscales in these systems, implementation of the GEMC method is rather demanding for larger systems. A preliminary GEMC investigation of gelation and microphase separation in such systems will be presented in a future publication Charbonneau and Reichman (2006).
Acknowledgements.
This work was supported in part by the NSF-0134969 and FQRNT-91389 (to P.C.) grants. We would like to thank P. Lu and K. Miyazaki for helpful discussions and comments.References
- Russel et al. (1991) W. B. Russel, D. A. Saville, and W. R. Schowalter, Colloidal Dispersions, Monographs on Mechanics and Applied Mathematics (Cambridge University Press, Cambridge, 1991), paperback ed.
- Asakura and Oosawa (1954) S. Asakura and F. Oosawa, J. Chem. Phys. 22, 1255 (1954).
- Vrij (1976) A. Vrij, Pure Appl. Chem. 48, 471 (1976).
- Renth et al. (2001) F. Renth, W. C. K. Poon, and R. M. L. Evans, Phys. Rev. E 64, 031402 (2001).
- Verma et al. (1998) R. Verma, J. C. Crocker, T. C. Lubensky, and A. G. Yodh, Phys. Rev. Lett. 81, 4004 (1998).
- Ramakrishnan et al. (2002) S. Ramakrishnan, M. Fuchs, K. S. Schweizer, and C. F. Zukoski, J. Chem. Phys. 116, 2201 (2002).
- Dawson et al. (2001) K. Dawson, G. Foffi, M. Fuchs, W. Gotze, F. Sciortino, M. Sperl, P. Tartaglia, T. Voigtmann, and E. Zaccarelli, Phys. Rev. E 63, 011401 (2001).
- Pham et al. (2002) K. N. Pham, A. M. Puertas, J. Bergenholtz, S. U. Egelhaaf, A. Moussaid, P. N. Pusey, A. B. Schofield, M. E. Cates, M. Fuchs, and W. C. K. Poon, Science 296, 104 (2002).
- Bergenholtz et al. (2000) J. Bergenholtz, M. Fuchs, and T. Voigtmann, J. Phys.: Condens. Matter 12, 6575 (2000).
- Cates et al. (2004) M. E. Cates, M. Fuchs, K. Kroy, W. C. K. Poon, and A. M. Puertas, J. Phys.: Condens. Matter 16, S4861 (2004).
- Foffi et al. (2005a) G. Foffi, C. De Michele, F. Sciortino, and P. Tartaglia, Phys. Rev. Lett. 94, 078301 (2005a).
- Verhaegh et al. (1997) N. A. M. Verhaegh, D. Asnaghi, H. N. W. Lekkerkerker, M. Giglio, and L. Cipelletti, Physica A 242, 104 (1997).
- Manley et al. (2005) S. Manley, H. M. Wyss, K. Miyazaki, J. C. Conrad, V. Trappe, L. J. Kaufman, D. R. Reichman, and D. A. Weitz, Phys. Rev. Lett. 95, 238302 (2005).
- Segre et al. (2001) P. N. Segre, V. Prasad, A. B. Schofield, and D. A. Weitz, Phys. Rev. Lett. 86, 6042 (2001).
- Lu et al. (2006) P. J. Lu, J. C. Conrad, H. M. Wyss, A. B. Schofield, and D. A. Weitz, Phys. Rev. Lett. 96, 028306 (2006).
- Sedgwick et al. (2005) H. Sedgwick, K. Kroy, A. Salonen, M. B. Robertson, S. U. Egelhaaf, and W. C. K. Poon, Eur. Phys. J. E 16, 77 (2005).
- Sciortino et al. (2004) F. Sciortino, S. Mossa, E. Zaccarelli, and P. Tartaglia, Phys. Rev. Lett. 93, 055701 (2004).
- Sciortino et al. (2005) F. Sciortino, P. Tartaglia, and E. Zaccarelli, J. Phys. Chem. B 109, 21942 (2005).
- de Candia et al. (2006) A. de Candia, E. Del Gado, A. Fierro, N. Sator, M. Tarzia, and A. Coniglio, Phys. Rev. E 74, 010403(R) (2006).
- Kroy et al. (2004) K. Kroy, M. E. Cates, and W. C. K. Poon, Phys. Rev. Lett. 92, 148302 (2004).
- Gast et al. (1983) A. P. Gast, C. K. Hall, and W. B. Russel, J. Colloid Interface Sci. 96, 251 (1983).
- Hagen and Frenkel (1994) M. H. J. Hagen and D. Frenkel, J. Chem. Phys. 101, 4093 (1994).
- Foffi et al. (2002) G. Foffi, G. D. McCullagh, A. Lawlor, E. Zaccarelli, K. A. Dawson, F. Sciortino, P. Tartaglia, D. Pini, and G. Stell, Phys. Rev. E 65, 031407 (2002).
- Asherie et al. (1996) N. Asherie, A. Lomakin, and G. B. Benedek, Phys. Rev. Lett. 77, 4832 (1996).
- Lomakin et al. (1996) A. Lomakin, N. Asherie, and G. B. Benedek, J. Chem. Phys. 104, 1646 (1996).
- ten Wolde and Frenkel (1997) P. R. ten Wolde and D. Frenkel, Science 277, 1975 (1997).
- Bolhuis et al. (2002) P. G. Bolhuis, A. A. Louis, and J. P. Hansen, Phys. Rev. Lett. 89 (2002), 128302.
- Pagan and Gunton (2005) D. L. Pagan and J. D. Gunton, J. Chem. Phys. 122, 184515 (2005).
- Liu et al. (2005) H. Liu, S. Garde, and S. Kumar, J. Chem. Phys. 123, 174505 (2005).
- Vliegenthart et al. (1999) G. A. Vliegenthart, J. F. M. Lodge, and H. N. W. Lekkerkerker, Physica A 263, 378 (1999).
- Shukla (2000) K. P. Shukla, J. Chem. Phys. 112, 10358 (2000).
- Chang et al. (2004) J. Chang, A. M. Lenhoff, and S. I. Sandler, J. Chem. Phys. 120, 3003 (2004).
- Pellicane et al. (2003) G. Pellicane, D. Costa, and C. Caccamo, J. Phys.: Condens. Matter 15, 375 (2003).
- Tavares and Sandler (1997) F. W. Tavares and S. I. Sandler, AIChE J. 43, 218 (1997).
- Dijkstra et al. (1999) M. Dijkstra, J. M. Brader, and R. Evans, J. Phys.: Condens. Matter 11, 10079 (1999).
- Fortini et al. (2005) A. Fortini, M. Dijkstra, and R. Tuinier, J. Phys.: Condens. Matter 17, 7783 (2005).
- Miller and Frenkel (2003) M. A. Miller and D. Frenkel, Phys. Rev. Lett. 90, 135702 (2003).
- Miller and Frenkel (2004) M. A. Miller and D. Frenkel, J. Chem. Phys. 121, 535 (2004).
- Panagiotopoulos (1992) A. Z. Panagiotopoulos, Mol. Sim. 9, 1 (1992).
- Charbonneau and Reichman (2006) P. Charbonneau and D. R. Reichman (2006), eprint cond-mat/0604430.
- Dijkstra (2002) M. Dijkstra, Phys. Rev. E 66, 021402 (2002).
- Hasegawa and Ohno (1997) M. Hasegawa and K. Ohno, J. Phys.: Condens. Matter 9, 3361 (1997).
- Chen and Siepmann (2000) B. Chen and J. I. Siepmann, J. Phys. Chem. B 104, 8725 (2000).
- Chen et al. (2001) B. Chen, J. I. Siepmann, and M. L. Klein, J. Phys. Chem. B 105, 9840 (2001).
- Foffi et al. (2005b) G. Foffi, C. De Michele, F. Sciortino, and P. Tartaglia, J. Chem. Phys. 122, 224903 (2005b).
- Høye and Stell (1977) J. S. Høye and G. Stell, J. Chem. Phys. 67, 439 (1977).
- Høye and Stell (1984) J. S. Høye and G. Stell, Mol. Phys. 52, 1071 (1984).
- Vega et al. (1992) L. Vega, E. Demiguel, L. F. Rull, G. Jackson, and I. A. McLure, J. Chem. Phys. 96, 2296 (1992).
- Bolhuis and Frenkel (1994) P. Bolhuis and D. Frenkel, Phys. Rev. Lett. 72, 2211 (1994).
- Bolhuis et al. (1994) P. Bolhuis, M. Hagen, and D. Frenkel, Phys. Rev. E 50, 4880 (1994).
- Sear and Frenkel (2003) R. P. Sear and D. Frenkel, Phys. Rev. Lett. 90, 195701 (2003).
- Malescio and Pellicane (2003) G. Malescio and G. Pellicane, Nat. Mater. 2, 97 (2003).
- Lopes (2002) J. N. C. Lopes, Phys. Chem. Chem. Phys. 4, 949 (2002).
- Mladek et al. (2006) B. M. Mladek, D. Gottwald, G. Kahl, M. Neumann, and C. N. Likos, Phys. Rev. Lett. 96, 045701 (2006).
- Louis et al. (2002) A. A. Louis, E. Allahyarov, H. Lowen, and R. Roth, Phys. Rev. E 65, 061407 (2002).
- Likos et al. (2005) C. N. Likos, C. Mayer, E. Stiakakis, and G. Petekidis, J. Phys.: Condens. Matter 17, S3363 (2005).
- Pini et al. (2000) D. Pini, J. L. Ge, A. Parola, and L. Reatto, Chem. Phys. Lett. 327, 209 (2000).
- Lodge and Heyes (1999) J. F. M. Lodge and D. M. Heyes, Phys. Chem. Chem. Phys. 1, 2119 (1999).
- Sastry (2000) S. Sastry, Phys. Rev. Lett. 85, 590 (2000).