Power-law carrier dynamics in semiconductor nanocrystals at nanosecond time scales
Abstract
We report the observation of power law dynamics on nanosecond to microsecond time scales in the fluorescence decay from semiconductor nanocrystals, and draw a comparison between this behavior and power-law fluorescence blinking from single nanocrystals. The link is supported by comparison of blinking and lifetime data measured simultaneously from the same nanocrystal. Our results reveal that the power law coefficient changes little over the nine decades in time from 10 ns to 10 s, in contrast with the predictions of some diffusion based models of power law behavior.
pacs:
The following article has been submitted to Applied Physics Letters. If it is published, it will be found online at http://apl.aip.org
Power law dynamics observed in the fluorescence blinking behavior of single semiconductor nanocrystals have received much recent attention. Both the fluorescence on and off periods have been shown to follow power law distributions, with the probability density of measuring a period of duration given by , where is the time independent power law coefficient, and is the temporal resolution of the measurement apparatus. The observed behaviour is particularly robust for the fluorescence off durations which show values of between about 0.4 and 0.8 over time scales from 100 s to 100 s Kuno00 ; Shimizu01 ; Tang05JCP . Autocorrelation measurements of ensemble fluorescence have suggested that the behavior extends to time scales as short as 1 s Verberk02 . The behavior is of significant practical importance, since the occurrence of long fluorescence off durations leads to statistical ageing (reversible photobleaching) in the fluorescence from ensembles of emitters Brokmann03 , raising serious obstacles to the realization of inexpensive optoelectronic devices based on nanocrystal/polymer composites.
The blinking itself is thought to be caused by the hopping of carriers between the quantum confined state in the nanocrystal and surrounding trap sites: when the nanocrystal is in a charged state, fluorescence is quenched by strong non-radiative Auger processes facilitated by the extra confined carrier. However the origin of the power law behavior is still a matter of some debate. Several suggestions have been made for dynamic models that rely on a random walk or diffusion process Shimizu01 ; Tang05JCP ; Tang05PRL ; Frantsuzov05 ; Margolin04 , whilst others propose static models with a distribution of trap states in the volume surrounding each nanocrystal Verberk02 ; Kuno03 . Some works Tang05PRL ; Frantsuzov05 have suggested that a signature of a diffusion process would be a reduction in the power law gradient at sub-100 s time scales such that .
In this Letter we present evidence that power law behavior can be observed on nanosecond to microsecond time scales in time-resolved photoluminescence (TRPL) experiments performed on both single nanocrystals and ensembles, thereby providing a new time scale on which to study the phenomenon. We used a standard time-correlated single photon counting (TCSPC) apparatus with timing resolution ps to measure room temperature TRPL of three different nanocrystal types: bare CdSe nanocrystals (sample A); CdSe/ZnS core-shell structures (sample B); and triple layer structures (sample C). The core-shells were fabricated by standard methods; the fabrication procedure for the bare nanocrystals and the triple layer structures are described elsewhere XCthesis ; SMDthesis . All of the samples showed strong ensemble luminescence at around 600 nm with no deep trap luminescence, but importantly were not optimized for high quantum yield so that long fluorescence on times were absent. Samples for photoluminescence measurements were created by spin casting from solution onto quartz substrates. Single nanocrystals were identified by their homogeneously broadened PL spectra with Lorentzian line shapes.
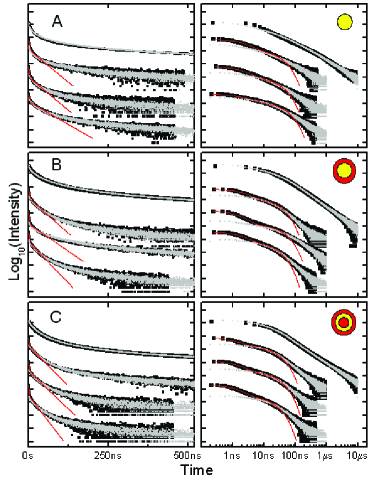
Figure 1 shows fluorescence decay data for three single nanocrystals and an ensemble of each of the sample types A, B, and C. The same data (black squares) are displayed on semi-logarithmic axis in the left hand column and fully logarithmic axes in the right hand column of the figure. Power law behaviour appears as a straight line of gradient on the fully logarithmic axes. Previously, single nanocrystal fluorescence decays have been fitted with biexponential functions with lifetimes of about 1 ns and 15 ns, attributed to Auger and radiative recombination processes respectively Schlegel02 . Fitting biexponential functions to our data (solid red lines in Fig.1) reveals excellent agreement up to about 50 ns after the excitation pulse, but for longer delays the fluorescence consistently decays more slowly than the biexponential function.
The presence of this slow tail indicates that between excitation and emission, the photogenerated exciton can enter a ‘dark’ state from which it can not radiate. We do not believe this state to be the ‘dark’ spin configuration of the confined exciton ground state since the lowest energy ‘bright’ exciton states for nanocrystals of this size lie less than 5 meV () higher in energy Norris96 , and the spin relaxation time is fast compared with the radiative lifetime Gupta02 ; Crooker03 . That the tail results from a large homogeneous line width as suggested in the recent work by Rothe et al Rothe06 appears unlikely since homogeneous broadening at room temperature is dominated by rapid dephasing of the exciton and not population decay. We therefore believe that the dark state occurs when one of the carriers escapes from the nanocrystal, similarly to the fluorescence off state that is responsible for the single nanocrystal blinking phenomenon.
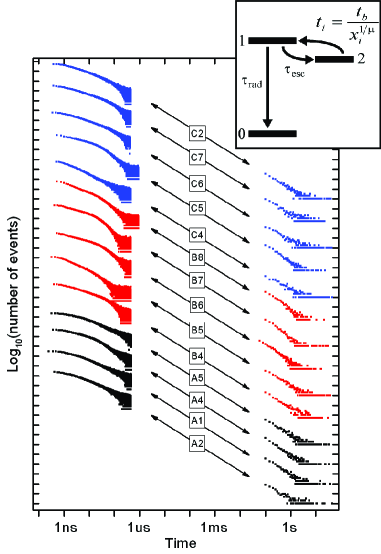
An empirical Monte Carlo (MC) model that produces the suggested power-law behavior is shown schematically in the inset of Fig.2. Times spent in the fluorescence off state are generated using the function where is a random variable in the range , and is the minimum measurable trapping duration Bardou01 , which in our experiment is equal to . For each MC iteration the system is initialized in the exciton state at time and is allowed to evolve until it undergoes radiative recombination to the ground state.
Fits of our MC simulation data sets to the measured TRPL data are shown as grey scatter graphs overlaying the experimental data in Fig.1. In all cases the model provides exact fits to the experimental data for time delays greater than about 10 ns. The underestimation of the single nanocrystal experimental data at short time delays results because our model neglects Auger limited fluorescence. The fitting parameters for the twelve MC data sets in Fig.1 are listed in Table 1. In each case we have taken value from the ensemble fit. The tabulated parameters reveal that most of the differences between the data sets are primarily attributable to differences in , which is determined by the degree of surface passivation of the individual nanocrystals. That all values of fitted are smaller than shows that the off state plays an important role.
| Sample | ||||
|---|---|---|---|---|
| Aens | 14 (2) | 2 (1) | 0.50 (0.05) | 0.54 (0.05) |
| A1 | 14 (2) | 2.5 (1) | 0.50 (0.1) | |
| A2 | 14 (2) | 4 (1) | 0.50 (0.1) | |
| A3 | 20 (2) | 5 (1) | 0.50 (0.1) | |
| Bens | 14 (2) | 2.5 (1) | 0.63 (0.05) | 0.67 (0.05) |
| B1 | 14 (2) | 7 (1) | 0.63 (0.1) | |
| B2 | 20 (2) | 3 (1) | 0.63 (0.1) | |
| B3 | 12 (2) | 7 (1) | 0.63 (0.1) | |
| Cens | 17 (2) | 6 (1) | 0.50 (0.05) | 0.37 (0.05) |
| C1 | 17 (2) | 10 (2) | 0.50 (0.1) | |
| C2 | 17 (2) | 10 (2) | 0.50 (0.1) | |
| C3 | 17 (2) | 10 (2) | 0.50 (0.1) |
To probe the relationship between the fluorescence decay function and distribution of off times from blinking measurements, we performed both experiments simultaneously on the same nanocrystal. Pulsed excitation at a repetition rate of 500 kHz allowed us to use a TRPL time range of 1 s and a blinking sampling time of 50 ms with clear distinction between the fluorescence on and off states. Figure 3 shows both TCSPC and fluorescence off histograms for fourteen single nanocrystals of the different types.
We have scaled the TCSPC data in Fig. 2 to enable the two data sets to be presented on the same -axis. The scaling factor used is the product of two sub-factors –the first, , corrects for the difference between the widths of the time bins, generally 50 ms for blinking and 200 ps for TCSPC, giving , while the second, , corrects for the difference in the measurement efficiency of the two methods. Whilst the blinking data records all of the off periods with duration 100 ms, the TCSPC data records a timing event for only about 4 of the excitation pulses, so that 25. The result of this scaling is therefore to shift the TCSPC data up the -axis of the logarithmic plot by about ten decades without distortion to the curve shape.
Although there is clearly a large time gap between the two data sets and some variation between individual nanocrystals, in each case their relative positions suggest that the power law decay at the short and long time scales measured here may be continuous across the entire time range with 0.5 throughout. There is also some correlation between the values of measured on the different time scales. The mean values measured from the blinking data, listed alongside the ensemble fitting parameters for each of the three nanocrystal types in Table 1, agree well with those fitted to the ensemble TRPL tails, with nanocrystals of type B (core-shells) providing a noticeably larger value of in both measurements. This degree of correspondence between the two data sets provides further evidence that the tail in the fluorescence decay is a result of the same trapping behavior that causes fluorescence blinking. We note that in contrast with the predictions made in the diffusion based models of references Tang05PRL and Frantsuzov05 the values of appear quite similar on the 100 ns time scale to those found in the blinking data.
To conclude, our study provides evidence that the same carrier trapping dynamics that lead to power law statistics in fluorescence blinking of single semiconductor nanocrystals can be observed on much faster time scales in fluorescence decay experiments, opening up new possibilities for testing the various theoretical models of power law behavior. We hope that as well furthering the understanding of carrier dynamics in semiconductor nanocrystals, our approach may prove fruitful in the analysis of the non-exponential fluorescence decays of other colloidal and molecular systems.
Acknowledgements.
Funding for this work was provided by the United Kingdom Engineering and Physical Sciences Research Council, the Royal Society of Edinburgh, the Royal Society of London, and Oxford University’s Research Development Fund. We would like to thank PicoQuant GmbH for the loan of a pulsed laser for the single nanocrystal measurements.References
- (1) M. Kuno, D. P. Fromm, H. F. Hamann, A. Gallagher and D. J. Nesbitt, J. Phys. Chem 112, p.3117 (2000).
- (2) K. T. Shimizu, R. G. Neuhauser, C. A. Leatherdale, S. A. Empedocles, W. K. Woo, and M. G. Bawendi, Phys. Rev. B 63, 205316 (2001).
- (3) J. Tang and R. A. Marcus, J. Chem. Phys 123, 054704 (2005).
- (4) R. Verberk, A. M. van Oijen, M. Orrit, Phys. Rev. B 66, 233202 (2002).
- (5) X. Brokmann, J.-P. Hermier, G. Messin, P. Desbiolles, J.-P. Bouchaud and M. Dahan, Phys. Rev. Lett 90, 120601 (2003).
- (6) J. Tang and R. A. Marcus, Phys. Rev. Lett. 95, 107401 (2005).
- (7) P. A. Frantsuzov and R. A. Marcus, Phys. Rev. B 72, 155321 (2005).
- (8) G. Margolin and E. Barkai, J. Chem. Phys 121, p.1566 (2004).
- (9) M. Kuno, D. P. Fromm, S. T. Johnson, A. Gallagher and D. J. Nesbitt, Phys. Rev. B 67, 125304 (2003).
- (10) S. M. Daniels, PhD Thesis, University of Manchester, UK (2006).
- (11) X. Chen, D.Phil thesis, University of Oxford, UK (2007).
- (12) G. Schlegel, J. Bohnenberger, I. Potapova, A. Mews, Phys. Rev. Lett. 88, 137401 (2002).
- (13) D. J. Norris, A. L. Efros, M. Rosen, and M. G. Bawendi, Phys. Rev. B 53, p.16347 (1996).
- (14) J. A. Gupta ; D. D. Awschalom, ; A. L. Efros and A. V. Rodina, Phys. Rev. B 66, 125307 (2002).
- (15) S. A. Crooker, T. Barrick, J. A.Hollingsworth and V. I. Klimov, Appl. Phys. Lett 82, 2793 (2003).
- (16) C. Rothe, S. I. Hintschich and A. P. Monkman, Phys. Rev. Lett 96, 163601 (2006).
- (17) F. Bardou, J. P. Bouchaud, A. Aspect, and C. Cohen-Tannoudji, Lévy Statistics and Laser Cooling, Cambridge University Press (2001).