,
Inferring the effective thickness of polyelectrolytes from stretching measurements at various ionic strengths: applications to DNA and RNA
Abstract
By resorting to the thick-chain model we discuss how the stretching response of a polymer is influenced by the self-avoidance entailed by its finite thickness. The characterization of the force versus extension curve for a thick chain is carried out through extensive stochastic simulations. The computational results are captured by an analytic expression that is used to fit experimental stretching measurements carried out on DNA and single-stranded RNA (poly-U) in various solutions. This strategy allows us to infer the apparent diameter of two biologically-relevant polyelectrolytes, namely DNA and poly-U, for different ionic strengths. Due to the very different degree of flexibility of the two molecules, the results provide insight into how the apparent diameter is influenced by the interplay between the (solution-dependent) Debye screening length and the polymers’ “bare” thickness. For DNA, the electrostatic contribution to the effective radius, , is found to be about 5 times larger than the Debye screening length, consistently with previous theoretical predictions for highly-charged stiff rods. For the more flexible poly-U chains the electrostatic contribution to is found to be significantly smaller than the Debye screening length.
Introduction
In recent years, the remarkable advancement of single-molecule manipulation techniques has made possible to characterise with great accuracy how various biopolymers respond to mechanical stretching [1, 2, 3, 4, 5, 6, 7, 8, 9, 10, 11, 12, 13, 14]. The wealth of collected experimental data have constituted and still represent an invaluable and challenging benchmark for models of polymers’ elasticity [15, 16, 17, 18, 19, 20, 21, 22, 23, 24]. The interpretation of single-molecule stretching experiments often relies on one-dimensional non-self-avoiding models of polymers. It is physically appealing that the schematic nature of such descriptions often conjugates with the capability of reproducing well experimental measurements. Two notable instances are represented by the freely-jointed chain [25, 15] and the worm-like chain models which, in their original or extended forms, constitute the most commonly-used theoretical frameworks for biopolymers’ stretching[26, 17, 27]. Both models are endowed with a parameter, the Kuhn length or the persistence length, that provides a phenomenological measure of the polymer stiffness and that is obtained by fitting the experimental data. It is important to notice, however, that it is possible to go beyond this phenomenological approach and connect the persistence length to the fundamental structural properties of a polymer. A strong indication of the feasibility of this scheme is provided by the fact that, for a large number of biopolymers, the observed persistence length shows an approximate quartic dependence on the polymer diameter, as predicted for “ideal” elastic rods[15].
From this perspective it appears natural to investigate in detail the connection between structural properties and stretching response of biopolymers. We have recently pursued this objective by modelling explicitly the intrinsic thickness of a homo-polymer (treated as a tube with uniform cross-section) and characterising the stretching response [21]. The theoretical and numerical results were employed in an appealing chemico-physical framework where the diameter of a biopolymer was not probed directly but inferred through the mere knowledge of the stretching response. The adopted thick-chain model [28, 29, 30], briefly outlined in the next section, was used to fit stretching measurements obtained for a variety of biopolymers: DNA [5], the PEVK-domain of the titin protein [7, 8] and cellulose [31, 10]. For uncharged polymers, such as titin and cellulose, the effective diameter recovered from fitting the force-extension curves were very consistent with the stereochemical ones, thereby validating the thick-chain model approach [21]. Even more interesting is the case of polymers possessing a substantial linear charge density, such as DNA and RNA which will be the focus of the present study. The properties of polyelectrolytes, in fact, depend very strongly on the electrostatic screening provided by the ions present in solution. The influence of the electrostatic screening on the behaviour of polyelectrolytes has been extensively investigated both experimentally and theoretically [32, 33, 34, 35, 36, 37, 38]. From the latter perspective, it is customary to introduce apparent (or effective) physico-chemical parameters to describe the properties of a polyelectrolyte in a given solution with reference to the uncharged polymer case. For example, in the context of elasticity, one introduces an effective (solution-dependent) bending rigidity to account for the additional electrostatic contribution to the “bare” persistence length of the hypothetically-neutral polymer [37, 38]. Also, in the context of colloidal dispersions of stiff polyelectrolytes, one can describe the polymer as uncharged cylinders and resort to the theory for second virial coefficient to derive its solution-dependent effective diameter[34, 39, 40]. For DNA in solutions of low ionic strength, both the effective persistence length and effective diameter can exceed by several factors the bare ones. So far, these effective DNA properties have been typically probed by distinct methodologies. For example stretching experiments were employed to establish the dependence of the the persistence length on ionic strength [41, 6] while measurements of second virial coefficients, knotting probabilities or braiding properties were used for the effective diameter[42, 40, 43, 44, 45]).
The thick-chain framework is used to obtain, starting from stretching measurements data, the effective diameter of a polyelectrolyte and to further relate it to its the effective persistence length. Besides the implications in the general context of polyelectrolytes the proposed method can be used to establish the effective structural parameters to be used in coarse-grained studies of looping, knotting and packaging of biopolymers [46, 47].
The thick chain model
To characterise the stretching response of a polymer with finite thickness we shall view the latter as a tube with a uniform circular section in the plane perpendicular to the tube centreline. The chain thickness, , is defined as the radius of the circular section. Several frameworks have been introduced to capture the uniform thickness constraint in a way apt for numerical implementation. These approaches typically rely on a discretised representation of the thick chain [48, 49, 50, 28, 51]. In this study we shall employ the piece-wise linear modelling of the chain centerline introduced by Gonzalez and Maddocks [28].
We shall indicate with the centerline of the chain consisting of a succession of points equispaced at distance . We shall further denote with the virtual bond joining the th and th points, . In order for the succession of points to be a viable centerline for a chain of thickness , it is necessary that the radii of the circles going through any triples of points , and , are not smaller than . Accordingly, the Hamiltonian for the thick chain (tube) model can be written as
| (1) |
where is the three-body potential used to enforce the thickness of the chain [28, 49, 52, 29, 30, 53]. As anticipated, the argument of is the radius of the circle going through the triplet of distinct points and has the form
| (2) |
Physically, the model of eqn. 1 introduces conformational restrictions for the centerline that are both local and non-local in character, as depicted in Fig. 1. The local constraints are those where the triplet , and identifies three consecutive points. The limitation on the radius of the associated circumcircle reflects the fact that, to avoid singularities, the local radius of curvature must not be smaller than . This reflects on the following bound on the angle formed by two consecutive bonds:
| (3) |
On the other hand there is also a non-local effect due to the fact that any two portions of the centerline at a finite arclength separation cannot interpenetrate. It has been shown in ref. [28] that this second effect can be accounted for by requiring that the minimum radius among circles going through any triplet of non-consecutive points, is also greater than (or equal to) . The seamless way in which the local and non-local steric effects are accounted for make the model particularly appealing. Other discrete models relying on pairwise interactions for the excluded volume (such as the cylindrical model of refs. [44, 45]) may be adopted, though ad hoc prescriptions for dealing with e.g. overlapping consecutive units need to be introduced [54].
In the present context we will consider the application of a stretching force, , to the ends of a chain of thickness (the contour length therefore being ). The Hamiltonian of eqn. 1 needs to be complemented with the stretching energy
| (4) |
As customary we shall characterize the force dependence of the average normalised projection of the end-to-end distance, , along the direction of applied force:
| (5) |
where the brackets denote the canonical ensemble average. Owing to its self-avoiding nature, the stretching response of the chain cannot be characterised exactly by available analytical methods. We shall therefore resort to extensive Monte Carlo samplings, based on the Metropolis scheme, to evaluate the ensemble averages of eqn. 5.
Besides the numerical study of the tube model subject to stretching it is interesting to illustrate a simplification of the model of eqn. 1, which is amenable to an extensive analytical characterization. To do so we retain only the local thickness constraint and thus end up with a model that is essentially non-self-avoiding. The simplified nature of this problem, however, makes it very tractable also in the presence of a bending rigidity penalty, . We shall therefore consider the Hamiltonian
| (6) |
again we stress that the three-body potential is restricted only to consecutive (local) triplets. In this form the stretching response of the model can be characterized exactly both at very low and very high forces using standard statistical-mechanical procedures [55, 56]. These two limiting regimes can be joined together to yield the following approximate expression for the stretching response of a locally-thick chain with bending rigidity (LTC+BR, for brevity):
| (7) | |||||
where , is the inverse Boltzmann factor and
| (8) |
with . The two cases in the above equation, reflect the fact that, for no restriction applies to the angle formed by two consecutive virtual bonds since eqn. (3) is always satisfied.
Expression 7 possesses some noteworthy limits. First, in the absence of thickness and in the continuum limit (, , being the persistence length) [55, 56], the model reduces to the well-known Marko and Siggia result for the WLC:
| (9) |
Secondly, in the absence of both thickness and bending rigidity one recovers the low- and high-force response of the freely-jointed chain with Kuhn length equal to :
| (10) |
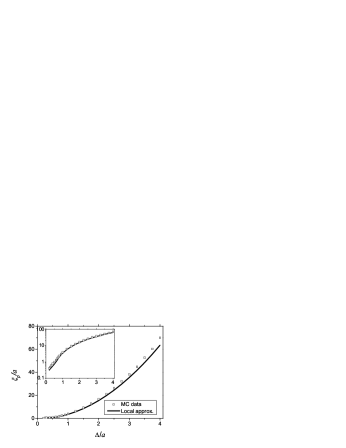
It is of interest also the case of finite thickness but no bending rigidity. In this case one obtains the following expression for the persistence length:
| (11) |
Though this expression does not include the non-local self-avoiding effects it will be shown later to provide a good approximation of the persistence length obtained numerically for the full model of eqn. 1.

We conclude this section by mentioning that for the models of eqn. 1 and 6 the spacing of consecutive points is constant along the centerline, so that the contour length is unaffected by the application of forces of arbitrary strength. The inextensibility property is obviously a simplification of the behaviour found in naturally-occurring polymers which, at very high forces can undergo isomerization or structural transitions resulting in an “overstretching” beyond their nominal contour length. Several approximate treatments have been developed to correct the stretching response of inextensible models so to account for overstretching [57, 5] by adopting additional parameters in the theory. In the present study we shall keep the number of model parameters to a minimum and hence postpone to future work the the investigation of the most suitable way to include overstretching in the TC model.
Numerical results
The characterization of the stretching response of the thick chain of eqn. 4 was carried out using a Monte Carlo scheme: starting from an arbitrary initial chain configuration satisfying the thickness constraints, the exploration of the available structure space was done by distorting conformations by means of pivot and crankshaft moves. Newly-generated structures are accepted/rejected according to the standard metropolis criterion (the infinite strength of the three-body penalties of eqn. 2 was enforced by always rejecting configurations violating the circumradii constraints).
The discretization length, , was taken as the unit length in the problem and several values of were considered, ranging from the minimum allowed value of 0.5 to the value of 4.0. This upper limit appears adequate in the present context since the largest nominal ratio for among the biopolymers considered here is achieved for dsDNA for which one has [47]. For each explored value of considered, we considered chains of length at least ten times bigger than the persistence length estimated through eqn. (11). The relative elongation of the chain, was calculated for increasing values of the applied stretching force (typically about 100 distinct force values were considered). For each run, after equilibration, we measured the autocorrelation time and sampled a sufficient number of independent conformations to achieve a relative error of, at most, on the average chain elongation. For moderate or high forces this typically entailed the collection of 104 independent structures while a tenfold increase of sampling was required at small forces due to the broad distribution of the end-to-end separation along the force direction.
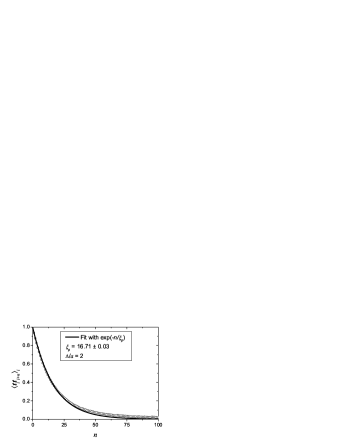
We first discuss the results for the persistence length obtained from the decay of the tangent-tangent correlations measured at zero force over an ensemble of sampled structures picked at times greater than the system autocorrelation time. The resulting data are shown in Fig. 2, along with the curve corresponding to the approximate expression of eqn. (11). It can be seen that the local approximation for the persistence length is very good in the range , where the relative difference from the value found numerically is typically inferior to 10%. Significant relative discrepancies are, instead found as approaches the limiting value of 0.5 (though it should be noted, the single exponential fit suffers from the very rapid decay of the tangent autocorrelation). In this case, only a narrow range of values for the angle formed by two consecutive bonds is forbidden. Consequently, the persistence length is very much affected by the (non-local) self-avoidance condition that is unaccounted for by the simple expression of eqn. (11). As intuitively expected the value of found numerically is larger than the one based on the local-thickness approximation.
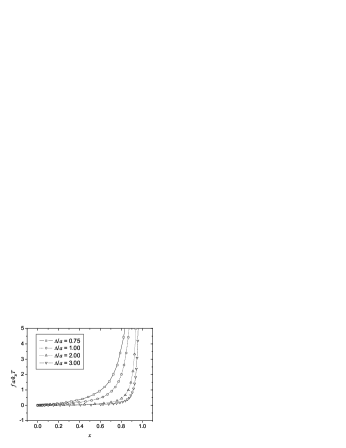
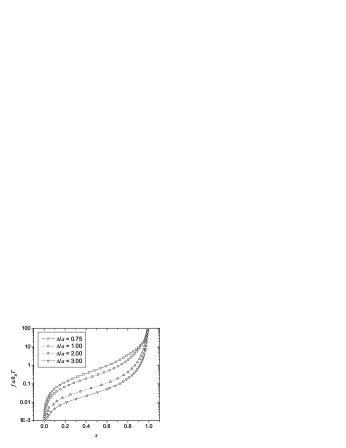
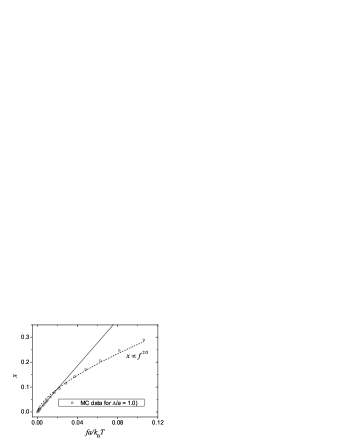
The analysis of the numerical results revealed several different stretching regimes in the elastic response of a thick chain. These are best discussed in connection with analogous regimes found in the two standard reference models, the freely-jointed chain (FJC) and the worm-like chain (WLC). We first point out that for both these models, as well as the generalisation of eqn. 7 the relative elongation, , depends linearly on the applied force, . This result holds also for the thick chain model. However, due to the inclusion of the self-avoidance effect in the TC (absent in both the FJC and WLC), the Hookean relationship between and disappears in the limit of long polymer chains in favour of the Pincus regime, , being the critical exponent for self-avoiding polymers in three dimensions [25, 16, 58], see Fig. 4.
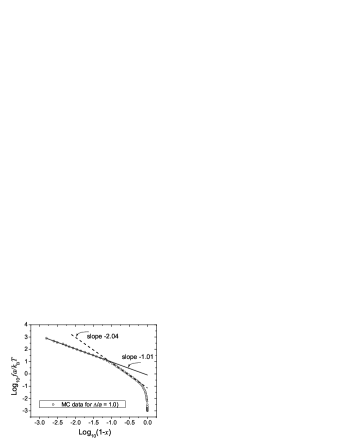
For intermediate forces the Pincus behaviour is found to be followed by a second regime characterised by the same scaling relation found in the WLC at high forces, . As shown in Fig. 4, at still higher forces the same scaling relation found in the FJC is observed, . Physically, the first two regimes are determined by self-avoidance and chain stiffness or persistence length while the last regime is ascribable to the discrete nature of the chain [59, 60, 55, 61].
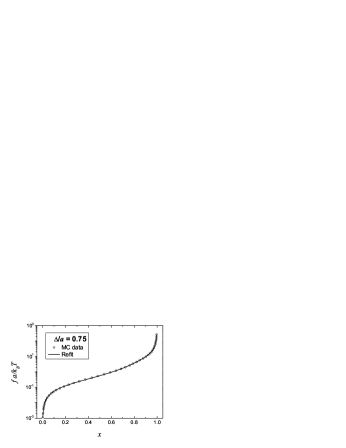
In order to apply the thick-chain model to contexts where experimental data are available we have analysed the data of the numerical simulations with the purpose of extracting an analytical expression capturing the observed functional dependence of on and . For any value of and the sought expression should reproduce the succession of the three regimes discussed above. Among several trial formulae we found, a posteriori, that the best interpolation was provided by the following expression,
| (12) |
where the parametric dependence on and is carried by the following expressions for the ’s,
| (13) | |||||
| (14) | |||||
| (15) |
Within the explored ranges of and , the relative extension obtained from eq. (12) differs on average by 1% (and at most by 5%) from the true values at any value of the applied force, as shown in Fig. 5.

Applications to experimental data and discussions
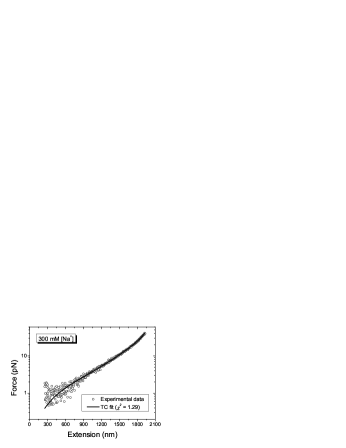
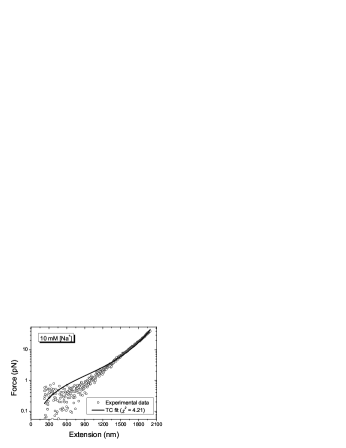
We shall now discuss the application of the TC model to data sets obtained in DNA and RNA stretching experiments carried out for various [Na+] concentrations. In particular, the data for dsDNA are taken from ref. [2] (solutions of 10, 1.0 and 0.1 mM [Na+]) while for single-stranded RNA (poly-U) we considered the recent results of ref. [62] (solutions of 500, 300, 100, 50, 10 and 5 mM [Na+]). The fits of the experimental data is carried out through the standard procedure of minimizing the over the TC parameters: the contour length, , chain granularity, and chain thickness, . For the calculation of we have estimated the effective uncertainty on the force measurements, taking the relative extension as the independent variable, directly from the large data sets of poly-U (more than 400 points for each set). For dsDNA, owing to the more limited number of points (about 20-25) we propagated the declared experimental uncertainty on extension.

| dsDNA | |||||
| [Na+] | |||||
| (mM) | (nm) | (nm) | (nm) | (nm) | |
| 10 | 9 2 | 12 2 | 55 2 | 32.9 0.2 | 0.6 |
| 1.0 | 25 7 | 26 4 | 94 4 | 32.3 0.2 | 0.3 |
| 0.1 | 36 16 | 48 13 | 242 14 | 32.3 0.2 | 1.9 |
| poly-U | |||||
|---|---|---|---|---|---|
| [Na+] | a | ||||
| (mM) | (nm) | (nm) | (nm) | (nm) | |
| 500 | 1.10 0.01 | 0.64 0.01 | 0.80 0.01 | 2126 4 | 1.49 |
| 300 | 1.09 0.02 | 0.65 0.01 | 0.91 0.01 | 2123 5 | 1.29 |
| 100 | 1.08 0.03 | 0.68 0.02 | 1.11 0.01 | 2117 8 | 1.05 |
| 50 | 1.11 0.03 | 0.73 0.02 | 1.30 0.01 | 2134 8 | 1.33 |
| 10 | 1.33 0.08 | 0.94 0.04 | 1.94 0.03 | 2138 12 | 4.21 |
| 5 | 1.41 0.10 | 1.03 0.05 | 2.26 0.05 | 2142 12 | 4.34 |
It is particularly appealing that, over the about 400 data points available for poly-U, the associated to the thick chain is very close to 1 for the set of measurements carried out for [Na+] in the 50 to 500 mM range. In the case of the two smallest concentrations, [Na+]= 5 and 10 mM, a significant increase of the is observed. The same is true for the fit of DNA measurements carried out in 0.1 mM [Na+]. The worsening of the TC performance consequent to the increase of the screening length is reflected, among other effects, by the progressive importance of accounting for overstretching [63, 6, 62]. Accordingly, the fitting parameters obtained at the lowest salt concentrations can be expected to change upon the introduction of a stretching modulus.
For both DNA and RNA the viability of the structural and elastic parameters of the TC fit can be compared against those obtained by different models and physical approaches. The most natural term of comparison for the elastic response is provided by the widely-employed WLC, which is the common reference model for determining the persistence length and contour length of several types of biopolymers. It is appealing that both and given by the TC for dsDNA and poly-U in Tables 1 and 2 are in close agreement with the same quantities given by the WLC, the relative difference being typically less than 5% for both quantities. For dsDNA, the values of as a function of [Na+] are compatible with the ones found by Baumann et al. [41] and those predicted by Lee and Thirumalai [38]. The values of for poly-U are, on the other hand, consistent with the WLC results found by Seol et al. in the original analysis of the data set provided to us [62]. Also, the order of magnitude of the granularity parameter, , providing the best fit for various [Na+] concentrations is consistent with the discretization length of the piece-wise cylindrical model optimised for DNA by Vologodskii and Frank-Kamenetskii [64].
It is important to point out that the best fits of the TC model yield a that is about one half the WLC one. This way reflect the fact that the WLC has one less parameter (the granularity) with respect to the TC model. However, the difference also stems from the very different functional dependence of in the two models. A noteworthy illustration of this fact is provided by the use of the Kratky-Porod (KP) model which represents a discretised chain with bending rigidity (e.g. a WLC endowed with a granularity parameter). The presence of the additional parameter, which allows the comparison with TC on a physically-equal footing, does not decrease appreciably the which remains about twice the TC one. A considerable improvement over the WLC/KP fit is however possible upon the inclusion of the local thickness effects, that is through the LTC+BR model of eqns. 6 and 7. The model is particularly interesting because it represents the simplest way of combining, in an approximate but analytical way, bending rigidity and thickness effects (within the piece-wise cylindrical model the inclusion of bending rigidity was recently discussed in ref. [45]). Despite the absence of non-local self-avoidance the LTC+BR model has a performance that, on average, improves the TC one by 20%. In fact, for the three concentrations of [Na+] reported in Table 1 one obtains the following values: 0.6, 0.4 and 1.0. The associated thickness values (being approximately 14, 26, and 48 nm, for 10, 1.0 and 0.1 mM [Na+], respectively) are consistent with the full TC determination, while the bending rigidity parameters are within 50% of those of the “bare” WLC. These results indicate the benefit of supplementing the ordinary bending rigidity with the self-avoidance originating from the chain thickness. Owing to the fact that the combined model possesses a larger parameter space we will postpone to future work the detailed characterization of the model.
We finally discuss the dependence of the effective thickness, , on the concentration of counterions in solution (the apparent diameter of the polymer is simply given by ). For both DNA and poly-U, the effective radius shows a monotonic decrease for increasing concentrations and indicates reaching a saturated value (different for each type of the polymers), namely the inferred “bare” thickness. In particular, over the range of 0.1 to 10 mM [Na+] the apparent radius of dsDNA decreases from 48 nm to 12 nm. For ssRNA the decrease is instead, 0.96 nm to 0.63 nm over the range of 5 to 500 mM [Na+]. As we anticipated in the introduction, the theoretical results derived by Stigter and Odijk [34, 39] have been previously used to predict the effective diameter of double-stranded DNA. The available theoretical predictions based on the approach of refs. [34, 40, 39] yield dsDNA radii of 8.1 nm for 10 mM [Na+], 27.1 nm for 1 mM [Na+] and 96.3 for 0.1 mM [Na+]. Given the very diverse nature of the approach and approximations of the present study and of refs. [34, 39], it is pleasing that the two determinations of the effective thickness are in reasonable agreement.
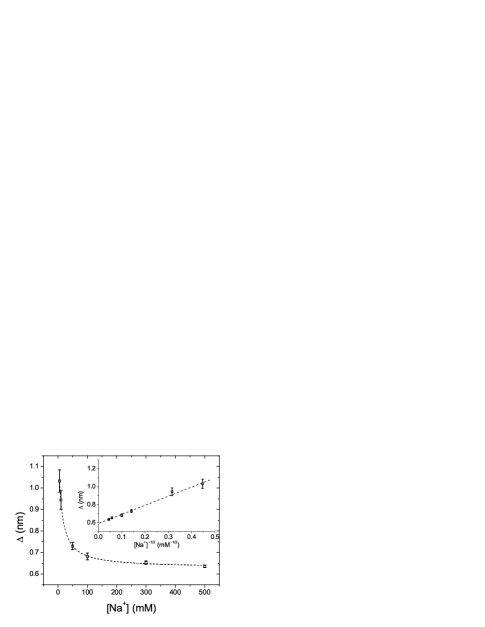
We finally turn to the case of poly-U. Owing to its high flexibility, even short stretches of RNA cannot be modeled as stiff rods, and hence the theoretical analysis of ref. [34] cannot be used to generate a comparison term for the effective radius, , of poly-U. It was pointed out by Stigter that for DNA the electrostatic contribution to the effective radius, though exceeding by several times the bare one, was of the same order of the Debye screening length, (the “proportionality factor” ranging from about 4 to 8) [34]. Also in the case of RNA, the Debye length, which is proportional to is a useful concept for rationalising the dependence of the effective radius on the ionic strength. In fact, within the explored range of [Na+], appears to increase linearly with , as visible in the inset of Fig. 8 (b). Assuming the validity of such linear relationship, the “bare” radius of poly-U is estimated by extrapolating for vanishing . One obtains , which compares well with the nominal value of about 0.5 nm observed in crystallographic structures of (non-hydrated) poly-U fragments (from PDB structure 1I5L). Incidentally we mention that also the value of agrees with the nominal size of the modular poly-U units which is about 0.6 nm. Several efforts have been devoted in the past to establishing how the apparent persistence length of polyelectrolytes is affected by the interplay between the bare persistence length, the linear charge density and the ionic strength [37, 36, 38]. Different manners of functional dependence of on are, in fact, observed for polyelectrolytes with different degree of flexibility, such as double-stranded and single-stranded DNA. It is, therefore, interesting to compare the dependence of the effective diameter of DNA and poly-U. The most notable difference is that the proportionality factor between the electrostatic contribution to the effective radius and the Debye length is of the order of 0.1, therefore appreciably smaller than for the case of dsDNA.
Conclusions
Extensive stochastic sampling techniques were used to characterize the behaviour of an inextensible thick polymer subject to a stretching force. The extension versus force response found numerically was parametrised in terms of the polymer structural parameters (thickness and monomer length) and captured by an analytic expression. The resulting formula was used to fit experimental data obtained from stretching measurements of DNA and poly-U in solutions of different ionic strength. This represents a novel and physically-appealing route to extract the apparent structural parameters of polyelectrolytes starting merely from their elastic response. The inferred effective diameter for DNA was found to be in satisfactory agreement with the estimates obtained by Stigter through an unrelated approach. In particular, the electrostatic contribution to the effective DNA radius was found to be several times larger than the Debye screening length, . Also for the much-more flexible poly-U chain it is observed that the effective radius strongly depends on the ionic strength, having an approximately linear dependence on within the available ranges of [Na+]. At variance with dsDNA, however, the electrostatic contribution to the effective radius was found to be an order of magnitude smaller than the Debye screening length.
Acknowledgements: We are indebted to K. Visscher for having provided us with the experimental data on poly-U and for useful comments. We thank T. Odijk for valuable suggestions and are grateful to D. Marenduzzo for several discussions and the careful reading of the manuscript.
References
- [1] Bustamante, C., Bryant, Z., and Smith, S. B. (2003) Nature 421, 423–427.
- [2] Smith, S. B., Finzi, L., and Bustamante, C. (1992) Science 258, 1122–1126.
- [3] Cluzel, P., Lebrun, A., Heller, C., Lavery, R., Viovy, J.-L., Chatenay, D., and Caron, F. (1996) Science 271, 792.
- [4] Strick, T. R., Allemand, J.-F., Bensimon, D., Bensimon, A., and Croquette, V. (1996) Science 271, 1835–1837.
- [5] Bouchiat, C., Wang, M. D., Allemand, J. F., Strick, T., Block, S. M., and Croquette, V. (1999) Biophys. J. 76, 409–413.
- [6] Wenner, J. R., Williams, M. C., Rouzina, I., and Bloomfield, V. A. (2002) Biophys. J. 82, 3160.
- [7] Linke, W. A., Kulke, M., Li, H., F.-Becker, S., Neagoe, C., Manstein, D. J., Gautel, M., and Fernandez, J. M. (2002) J. Struct. Biol. 137, 194–205.
- [8] Li, H., Oberhauser, A. F., Redick, S. D., C.-Vazquez, M., Erickson, H. P., and Fernandez, J. M. (2001) Proc. Natl. Acad. Sci. USA 98, 10682–10686.
- [9] Rief, M., Pascual, J., Saraste, M., and Gaub, H. E. (1999) J. Mol. Biol. 286, 553–561.
- [10] Marszalek, P. E., Oberhauser, A. F., Pang, Y.-P., and Fernandez, J. M. (1998) Nature 396, 661–664.
- [11] Williams, P. M., Fowler, S. B., Best, R. B., Toca-Herrera, J. L., Scott, K. A., Steward, A., and Clarke, J. (2003) Nature 422, 446–449.
- [12] Best, R. B., Fowler, S. B., Toca-Herrera, J. L., Steward, A., Paci, E., and Clarke, J. (2003) J. Mol. Biol. 330, 867–877.
- [13] Wang, M. D., Yin, H., Landick, R., Gelles, J., and Block, S. M. (1997) Biophys. J. 72, 1335–1346.
- [14] Strick, T., Allemand, J.F., Croquette, V., and Bensimon, D. (2000) Prog. Biophys. and Mol. Biol. 74, 115–140.
- [15] Boal, D. (2002) Mechanics of the cell (Cambridge University Press, Cambridge).
- [16] Pincus, P. (1976) Macromolecules 9, 386–388.
- [17] Bustamante, C., Marko, J. F., Siggia, E. D., and Smith, S. (1994) Science 265, 1599–1600.
- [18] Cieplak, M., Hoang, T. X., and Robbins, M. O. (2002) Proteins 49, 114–124.
- [19] Gao, M., Wilmanns, M., and Schulten, K. (2002) Biophys. J. 83, 3435–3445.
- [20] Bensimon, D., Dohmi, D., and Mezard, M. (1998) Europhys. lett. 42, 97 102.
- [21] Toan, N.M., Marenduzzo, D., and Micheletti, C. (2005) Biophys. J. 89, 80–86.
- [22] Seyed-allaei, Hamed (2005) Phys. Rev. E 72(3), cond–mat/0409492.
- [23] Hugel, T., Rief, M., Seitz, M., Gaub, H.E., and Netz, R.R. (2005) Phys. Rev. Lett. 94, 048301(1)–048301(4).
- [24] Piana, S. (2005) Nucl. Acids Res. 33, 7029–7038.
- [25] Flory, P.J. (1989) Statistical mechanics of chain molecules (Hanser Publisher, Munich).
- [26] Marko, J. F. and Siggia, E. D. (1995) Macromolecules 28, 8759–8770.
- [27] Hansen, P.L. and Podgornik, R. (2001) J. Chem. Phys. 114, 8637–8648.
- [28] Gonzalez, O. and Maddocks, J. H. (1999) Proc. Natl. Acad. Sci. USA 96, 4769–4773.
- [29] Maritan, A., Micheletti, C., Trovato, A., and Banavar, J. R. (2000) Nature 406, 287.
- [30] Stasiak, A. and Maddocks, J. H. (2000) Nature 406, 251–253.
- [31] Marszalek, P. E., Pang, Y.-P., Li, H., Yazal, J. E., Oberhauser, A. F., and Fernandez, J. M. (1999) Proc. Natl. Acad. Sci. USA 96, 7894–7898.
- [32] Odijk, T. (1977) J. Polym. Sci. Polym. Phys. 15, 477–483.
- [33] Skolnick, J. and Fixman, M. (1977) Macromolecules 10, 944–948.
- [34] Stigter, D. (1977) Biopolymers 16, 1435–1448.
- [35] Tricot, M. (1984) Macromolecules 17, 1698–1704.
- [36] Reed, W. F., Ghosh, S., Medjahdi, G., and Francois, J. (1991) Macromolecules 24, 6189–6198.
- [37] M. Ullner, B. J nsson, Peterson, C., Sommelius, O., and Soderberg, B. (1997) J. Chem. Phys. 107, 1279–1287.
- [38] Lee, N. and Thirumalai, D. (1999) Eur. Phys. J. B 12, 599–605.
- [39] Odijk, T. (1990) J. Chem. Phys. 93, 5172–5176.
- [40] Stigter, D. and Dill, K.A. (1993) J. Phys. Chem. 97, 12995–12997.
- [41] Baumann, C. G., Smith, S. B., Bloomfield, V. A., Bustamante, C., Wang, M. D., emand, J. F. All, Strick, T., Block, S. M., and Croquette, V. (1997) Proc. Natl. Acad. Sci. USA 94, 6185–6190.
- [42] Nicolai, T. and Mandel, M. (1989) Macromolecules 22, 2348–2356.
- [43] Sottas, P-E., Larquet, E., Stasiak, A., and Dubochet, J. (1999) Biophys. J. 77, 1858–1870.
- [44] Rybenkov, V. V., Cozzarelli, N. R., and Vologodskii, A. V. S. (1993) Proc. Natl. Acad. Sci. USA 90, 5307.
- [45] Charvin, G., Vologodskii, A., Bensimon, D., and Croquette, V. (2005) Biophys. J. 88, 4124–4136.
- [46] Arsuaga, J., Tan, R. K. Z., Vazquez, M., Sumners, D. W., and Harvey, S. C. (2002) Biophys. Chem. 101, 475–484.
- [47] Marenduzzo, D. and Micheletti, C. (2003) J. Mol. Biol. 330, 485–492.
- [48] Buck, G. and Orloff, J. (1995) Topol. Appl. 61, 205–214.
- [49] Katrich, V., Olson, W. K., Pieranski, P., Dubochet, J., and Stasiak, A. (1997) Nature 388, 148–151.
- [50] Litherland, R., Simon, J., Durumeric, O., and Rawdon, E. (1999) Topol. Appl. 91, 233–244.
- [51] Rawdon, E. (2000) J. Knot Th. Ram. 9, 113–145.
- [52] Banavar, J. R., Gonzalez, O., , Maddocks, J. H., and Maritan, A. (2003) J. Stat. Phys 110, 35–50.
- [53] Banavar, J.R., Maritan, A., Micheletti, C., and Trovato, A. (2002) Proteins 47, 315–322.
- [54] Banavar, J. R. and Maritan, A. (2003) Rev. Mod. Phys. 75, 23.
- [55] Rosa, A., Hoang, T. X., Marenduzzo, D., and Maritan, A. (2003) Macromolecules 36, 10095–10102.
- [56] Rosa, Angelo (2003) Statistical Mechanics of Polymer Stretching, Ph.D. thesis, SISSA (The International School for Advanced Studies), Trieste, Italy.
- [57] Odijk, Theo (1995) Macromolecules 28, 7016–7018.
- [58] Lam, P.-M. (2002) Biopolymers 64, 57–62.
- [59] Livadaru, L., Netz, R. R., and Kreuzer, H. J. (2003) Macromolecules 36, 3732–3744.
- [60] Storm, C. and Nelson, P. C. (2003) Phys. Rev. E 67, 051906.
- [61] Lamura, A., Burkhardt, T. W., and Gompper, G. (2001) Phys. Rev. E 64, 061801.
- [62] Seol, Y., Skinner, G.M., and Visscher, K. (2004) Phys. Rev. Lett. 93, 118102.
- [63] Podgornik, R., Hansen, P.L., and Parsegian, V.A. (2000) J. Chem. Phys. 113, 9343–9350.
- [64] Vologodskii, A. and Frank-Kamenetskii, M. (1992) Methods Enzymol. 211, 468–472.