Dynamics of Bulk vs. Nanoscale WS2: Local Strain and Charging Effects
Abstract
We measured the infrared vibrational properties of bulk and nanoparticle WS2 in order to investigate the structure-property relations in these novel materials. In addition to the symmetry-breaking effects of local strain, nanoparticle curvature modifies the local charging environment of the bulk material. Performing a charge analysis on the xy-polarized E1u vibrational mode, we find an approximate 1.5:1 intralayer charge difference between the layered 2H material and inorganic fullerene-like (IF) nanoparticles. This effective charge difference may impact the solid-state lubrication properties of nanoscale metal dichalcogenides.
pacs:
63.22.+m, 78.20.Ci, 61.46.+w, 78.30.-jI Introduction
Inorganic fullerene-like (IF) nanostructures have recently attracted attention due to their unique closed cage structures and outstanding solid-state lubricating behavior Tenne1992 ; Margulis1993 ; Parilla1999 . Just as carbon fullerenes are nanoscale analogs of layered graphite, IF nanoparticles and nanotubes are curved analogs of the corresponding quasi-two-dimensional material. Layered and nanoscale metal dichalcogenides are prototypes in this regard, and the discovery of the WS2-based family of IF nanoparticles (Fig. 1) provides the opportunity to investigate structure-property relations in bulk vs. nanoscale materials. At the same time, the IF materials hold out the potential for important applications. In addition to use in rechargeable batteries, optical devices, and in impact-resistant nanocomposities, extensive mechanical properties testing demonstrates that the friction coefficient of IF-WS2 nanoparticles is reduced up to 50% compared with the 2H-WS2 parent compound, maintaining excellent lubricating behavior even under very high loads, ultra-high vacuum, and in humid conditions Rapoport1997 ; Rapoport1999 ; Rapoport2003 ; Chen2002 ; Schuffenhauer2004 ; Rapoport2005 ; Zhu05 . Because of these observations, major efforts have been directed at understanding the connection between bulk and microscopic properties and exploiting the commercial promise of these novel nanomaterials.

2H-WS2 belongs to the space group P63/mmc () and contains two formula units per unit cell 2HNote . The bonding is well-known to consist of strong covalent intralayer forces and weak van der Waals interactions between adjacent layers Wilson1969 ; Schutte1987 . Each MX2 layer (M = group VIB metal, X = group VIA element) contains a layer of metal atoms, sandwiched between two chalcogen layers, with each metal atom bonded to six chalcogen atoms in a trigonal prismatic arrangement. A group theoretical analysis (Table A.1, Appendix) gives a total of 18 normal modes Verble1970 . The doubly degenerate E1u and singly degenerate A2u vibrational modes are infrared active; the conjugate gerade modes are Raman active. Figure 2 displays the relevant displacement vectors. Note that the infrared active xy-polarized E1u and z-polarized A2u modes are associated with intralayer and interlayer motion, respectively. This directional selectivity provides a sensitive and microscopic probe of charge and bonding interactions that we will employ in this work to assess effective total and local charge differences between the bulk and nanoscale materials Uchida1978 ; Lucovsky1973 ; Lucovsky1971 ; Lucovsky1976 ; Burstein1970 . X-ray diffraction reveals that the local structure of 2H-WS2 is preserved within the unit cell of an IF nanoparticle with the exception of a 2% lattice expansion along the z-axis Feldman1995 ; Feldman1996 . This lattice expansion is attributed to strain in the curved WS2 layers Feldman1996 ; Srolovitz1995 , each of which has a slightly different radius due to layer inhomogeneities (Fig. 1(b)). The lattice modes of 2H-WS2 were previously investigated using combined Raman and inelastic neutron scattering, demonstrating that the two-phonon resonance Raman effects are second-order processes involving the longitudinal acoustic mode at the K point of the Brillouin zone Sourisseau1991 . Previous studies also indicate that the new Raman peaks in spectra of IF-WS2 nanotubes and nanoparticles should be assigned as disorder-induced zone edge phonons Frey1998b . More recent Raman work demonstrates that the 33 cm-1 E2g shearing or “rigid layer” mode is almost completely blocked in IF-WS2 due to surface strain hindering intralayer motion in the nanoparticles unpublished . Extensive optical properties and STM work indicates that the indirect gap is smaller in the IF nanoparticles compared to that in the bulk Frey1998 ; Hershfinkel1994 . A and B exciton positions are also sensitive to confinement and the number of layers in the nanoparticle Frey1998b ; Frey1998 .
In order to investigate structure-property relationships in these chemically identical but morphologically different metal dichalcogenides, we measured the infrared reflectance spectra of both 2H- and IF-WS2 powders and performed a charge analysis to extract total and local effective charge from the oscillator parameters of the major infrared active phonon modes. We found an approximate 1.5:1 intralayer charge difference between the 2H- bulk and IF-nanoparticle materials, respectively. The trend is different in the interlayer direction, reflecting a slightly enhanced interaction in the nanoparticles. We discuss how differences in both charge and strain may be connected to the macroscopic properties of these materials.

II Experimental Methods
IF-WS2 was prepared from its oxide precursor, WO3, following previously published procedures Tenne1992 ; Feldman1996 ; Homyonfer1997 ; Feldman2000 ; Rosentsveig2002 ; Margolin2004 ; Tenne2003 . The IF nanoparticles of interest in this work range in size from 120 - 200 nm in diameter. The particle size, shape and distribution have been studied by x-ray powder diffraction Feldman1996 , scanning tunneling microscopy Hershfinkel1994 , and high-resolution transmission electron microscopy Hershfinkel1994 ; Homyonfer1997 ; Feldman1996 . Pressed isotropic pellets were prepared to investigate the dynamical properties. Bulk 2H-WS2 was also measured for comparison (Alfa Aesar, 99.8%).
Near-normal infrared reflectance was measured over a wide frequency range using a series of spectrometers including a Bruker 113V Fourier transform infrared spectrometer, an Equinox 55 Fourier transform instrument (equipped with a microscope attachment), and a Perkin Elmer Lambda 900 grating spectrometer, covering the frequency range from 25 - 52000 cm-1. A helium-cooled bolometer detector was employed in the far-infrared for added sensitivity. Both 0.5 and 2 cm-1 resolution were used in the infrared, whereas 3 nm resolution was used in the optical regime. Variable temperature measurements were carried out with a continuous-flow helium cryostat and temperature controller. A Kramers-Kronig analysis was used to calculate the optical constants from the measured reflectance, yielding information on the dispersive and lossy response of each material Wooten1972 ; optconst . Standard peak-fitting techniques were employed, where appropriate.
III Results and Discussion
III.1 Understanding Charge Localization Effects in 2H- and IF-WS2
Figure 3 displays a close-up view of the far infrared reflectance spectra of 2H- and IF-WS2 at 300 K. We assign the major features in the reflectance (at 356 and 437 cm-1) as the E1u and A2u modes, respectively Verble1970 ; conductivitynote . These modes are strikingly different in the two materials. The E1u mode appears damped and suppressed in IF-WS2 compared to the 2H- analog, whereas the A2u mode is slightly more pronounced in the IF compound compared to that in the bulk. These differences can be quantified using traditional dielectric oscillator models and fitting techniques which, in combination with appropriate models, allow us to assess the charge characteristics of the nanomaterial as compared to the bulk.

Classical Oscillator Parameters
and Optical Phonon Frequencies for 2H- and IF-WS2
E1u Mode
A2u Mode
300 K
2H-WS2
IF-WS2
2H-WS2
IF-WS2
Oscillator strength, S
0.031
0.014
0.002
0.002
Damping constant,
0.005
0.010
0.004
0.006
(cm-1)
356.47
356.97
438.32
439.01
(cm-1)
357.10
357.28
- (cm-1)
0.63
0.31
9.58
6.26
10 K
Oscillator strength, S
0.040
0.017
0.005
0.004
Damping constant,
0.004
0.010
0.006
0.004
(cm-1)
358.30
358.61
440.80
440.87
(cm-1)
359.14
359.20
- (cm-1)
0.84
0.59
8.92
6.46
One well-established approach for quantifying charge in a material involves assessment of both total and local effective charge Uchida1978 ; Lucovsky1973 ; Lucovsky1971 ; Lucovsky1976 ; Burstein1970 . As discussed by Burstein et al. Burstein1970 , macroscopic effective charge, , is a measure of the electric moment per unit cell and contains contributions from both the localized charge on the ion sites and the charge generated throughout the unit cell. Therefore, , can be separated into a localized part, , and a nonlocalized part, ,
| (1) |
Here, is defined as the localized moment generated per unit displacement of an ion. It induces a local field through dipole-dipole interactions which contributes to the reduction of the transverse optical (TO) phonon frequency. Although can be a good measure of bond ionicity or covalency in layered MX2 transition-metal dichalcogenides, gives a more appropriate representation of bonding interactions because it quantifies charge on the ionic sites Uchida1978 .
Total macroscopic effective charge, , is given as
| (2) |
Here, is the TO phonon frequency (in cm-1), is the oscillator strength, is the number of WS2 formula units per unit volume, is the mode mass Herzberg1945 , e is the electronic charge, is the speed of light (in cm/s), and is the permittivity of free space. Note that for comparison of two similar materials, such as 2H- and IF-WS2, oscillator strength and TO phonon frequency will be the distinguishing parameters. Localized effective charge Uchida1978 , , is determined as
| (3) |
Here, is the longitudinal optical (LO) phonon frequency (in cm-1) and is the Lorentz factor for a hexagonal lattice Mueller1936 . Precise measurement of the LO-TO splitting is key to distinguishing local charge differences in 2H- and IF-WS2.
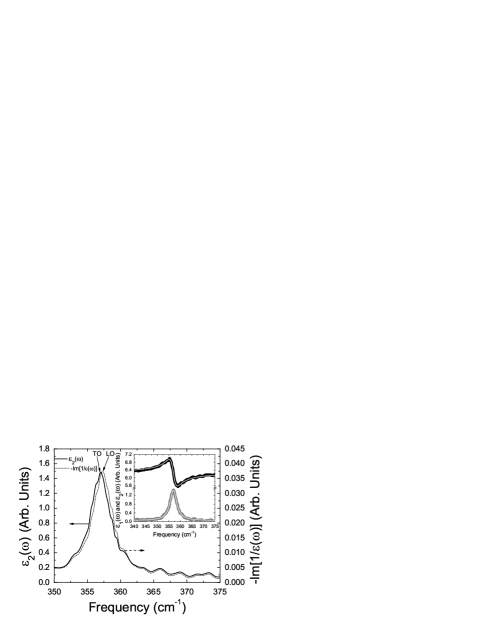
In order to obtain the parameters needed to extract total effective and local charge for both 2H- and IF-WS2, we carried out a Kramers-Kronig analysis of the measured reflectance. LO and TO phonon frequencies are obtained directly from the optical constants, for instance, as peaks in the energy loss function, Im(1/()), and in the imaginary part of the frequency dependent dielectric function, , respectively. Figure 4 shows an example of these optical constants and the straightforward extraction of LO and TO phonon frequencies for IF-WS2 at 300 K. Oscillator strength, , is obtained by simultaneously fitting the real and imaginary parts of the complex dielectric function, () = () + i(), using the three parameter model
| (4) |
Here, the subscript refers to the mode of interest, is the damping constant, and is the high frequency dielectric constant Wooten1972 ; Lucovsky1973 ; Gervais1983 ; Lucovsky1976 . As an example, the inset of Fig. 4 shows an oscillator fit of the real and imaginary parts of the complex dielectric function for the E1u mode of IF-WS2 at 300 K. The classical oscillator parameters of both 2H- and IF-WS2 are summarized in Table 1. These parameters, along with Eqns. 2 and 3, allow us to evaluate the charge characteristics.
Macroscopic and Localized Effective Charge Values for 2H- and IF-WS2
E1u Mode
A2u Mode
2H-WS2
IF-WS2
2H-WS2
IF-WS2
300 K
/e
0.45
0.30
0.15
0.16
/e
0.20
0.14
10 K
/e
0.51
0.34
0.22
0.20
/e
0.23
0.20
cannot be obtained for the z-polarized interlayer A2u mode due to the negative Lorentz factor negativeL .
Error bars on the total and local charge values are 0.02.
The small LO-TO splitting in both 2H- and IF-WS2 indicates that the metal-chalcogen bond is highly covalent within the layer, in agreement with previous results for WS2 as well as other well-known covalent compounds including MoS2, MoSe2, and WSe2 Burstein1970 ; Lucovsky1971 ; Lucovsky1973 ; Uchida1978 ; Lucovsky1976 . In contrast, Uchida and Tanaka report large LO-TO splittings for several group IV transition-metal dichalcogenides, including 1T-TiSe2, 1T-ZrSe2, and 1T-HfSe2, which are considered to be highly ionic materials Uchida1978 . Physically, the smaller LO-TO splitting of the E1u mode in IF-WS2 (Table 1), indicates that the IF- nanoparticles are slightly more covalent than the parent 2H- compound. This result indicates that nanoparticle curvature changes the charge-sharing environment within the layer.
Table 2 displays the total macroscopic and local charge for both 2H- and IF-WS2. Using the xy-polarized E1u mode as a probe of charge within the layer, we find that = 0.45 for 2H-WS2 and = 0.30 for IF-WS2 at 300 K UchidaData . Thus, IF-WS2 has approximately two thirds the intralayer charge as 2H-WS2. This approximate 1.5:1 charge difference is replicated in the local charge numbers, with decreasing proportionally in the IF compound. The intralayer charge differences summarized in Table 2 can be traced to differences in the LO-TO splitting and oscillator strength of the E2u mode in 2H- and IF-WS2. As already mentioned, these changes are easily observed in the spectral data (Fig. 3). The results imply that there is in fact a significant difference in the local environment and chemical bonding between the 2H- and IF- materials and that nanoparticle curvature changes the charging environment within the plane. A blocked “rigid layer” E2g Raman mode is also consistent with these observations unpublished .
In the interlayer direction, the charge trend as characterized by the behavior of the A2u mode is different (Table 2). At 300 K, = 0.16 for IF-WS2 compared with = 0.15 for 2H-WS2. That is larger in IF-WS2 is indicative of slightly stronger interlayer interaction and enhanced charge environment in the curved nanoparticles compared with the bulk. As expected, the total effective charge within the layer ( from the E1u mode) is always larger than that between layers ( from the A2u mode), indicating that the majority of charge resides within the metal dichalcogenide layer in both materials.
Table 2 also displays the total and local effective charge of 2H- and IF-WS2 at low temperature. Although the exact values of total and local effective charge differ slightly from their 300 K values (for instance, the total charge extracted from analysis of the xy-polarized E1u mode of 2H-WS2 is 0.51 at 10 K and 0.45 at 300 K), the overall trends between the layered and nanomaterial remain similar to those discussed above. Macroscopic effective charge within the layer decreases from 0.51 in the bulk to 0.34 in the nanomaterial (again, an approximate 1.5:1 charge difference), and local charge makes up approximately 50% of the total charge. The total charge extracted from the interlayer A2u mode is slightly larger in the 2H material than in the IF nanoparticles at low temperature.
III.2 Curvature-Induced Local Symmetry Breaking in IF-WS2
Are there other manifestations of curvature in the nanoparticles besides the aformentioned total and local effective charge differences? Certainly, strain and confinement have been of recent interest in both vanadium oxide inorganic nanotubes and silicon nanowires Cao04 ; Adu05 . In both cases, strain broadens the vibrational modes. Another effect of curvature is that the local, short range symmetry is formally lower than (and a subgroup of) the unstrained bulk. The reduction of local symmetry can change the selection rules, allowing formerly “infrared-silent” modes to become infrared active jannote ; Loa2001 . Further, the curvature of each metal dichalcogenide layer within the nanoparticle is not uniform. This inhomogeneous structure also results in mode dispersion. Evidence for these effects, while present in the 300 K spectrum of IF-WS2 (Fig. 3), is best illustrated in the low temperature spectral response.
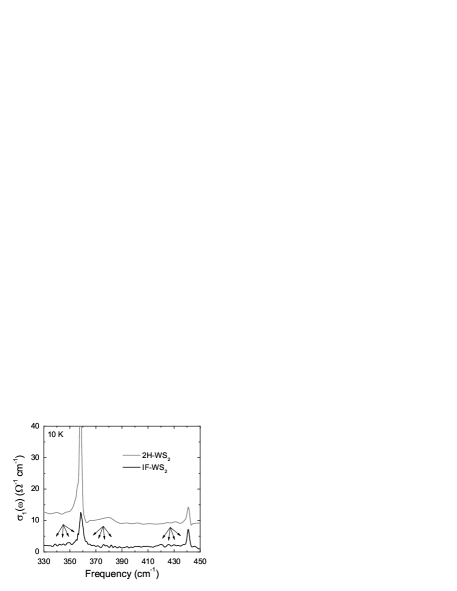
Figure 5 displays the optical conductivity, , of 2H- and IF-WS2 at 10 K optconst . The low temperature spectral response of both materials is still dominated by the E1u and A2u modes, although because of the additional fine structure, the nanoparticle response is clearly much richer and more complicated than that of the bulk material. We attribute the additional vibrational structure to the formally “silent” and combination modes, activated (and dispersed) in the spectrum of IF-WS2 by the symmetry breaking that results from the curved cage structure. For instance, some Raman modes are well-known conjugates of infrared active features Sekine1980 . The E and E conjugate pair is an example. The symmetry analysis and vector displacement diagrams of Verble and Wieting Verble1970 (see also Table A.1, Appendix) also provide several candidates for silent mode activation, stating that the inactive B1g, B2u, and E2u modes are nearly degenerate with several Raman- and infrared-active modes. Thus, the optical conductivity of IF-WS2 likely contains weak contributions from all of these first-order structures, along with a substantial number of peaks that originate from mode combinations and disorder effects.
Group theory can also be used to investigate possible second order infrared active combinations. When a direct product of two fundamental modes contains A2u or E1u symmetry in its character, it follows that a combination of those two modes will be infrared active. For example, E1u E2g = B1u + B2u + E1u, and A2u E1g = E1u. These combinations are both infrared active because their reducible representation contains E1u. (Taking the direct product of this state with the , , and dipole moment operators clearly contains the totally symmetric group.) Similarly, the sum and difference of other fundamental vibrational frequencies can lead to various infrared active combinations like A2u A1g, E1u A1g, E1u E1g, B2u E2g and B2u B1g. We note that the longitudinal acoustic mode is intimately and extensively involved with many combination modes that appear in resonance Raman Sourisseau1991 and may be involved in the infrared-active combination modes of IF-WS2 as well.
IV Conclusion
We report the infrared vibrational properties of bulk and nanoparticle WS2 in order to investigate the structure-property relations in these novel materials. In addition to the symmetry-breaking effects of local strain, nanoparticle curvature modifies the well-known charge environment of the bulk material. Using the E1u mode as a local probe of charge behavior within the layer, we find an approximate 1.5:1 intralayer charge difference between the 2H- and IF- materials. The trend is different in the interlayer direction (probed by the A2u mode) at 300 K. Here, effective charge increases slightly in the IF material compared to that in the bulk. We attribute the stronger interlayer interaction to nanoparticle curvature. Elucidating the relationship between structure and effective total and local charge in 2H- and IF-WS2 is only the first step in understanding the fundamental interactions underlying the phenomenal mechanical and solid state lubricating properties of nanoscale metal dichalcogenides. Tuning MX2 bond covalency may, for instance, allow simultaneous exploration of macroscopic mechanical properties, the charge environment, and potential surface effects.
V Acknowledgements
Work at the University of Tennessee is supported by the Materials Science Division, Office of Basic Energy Sciences at the U.S. Department of Energy under Grant No. (DE-FG02-01ER45885). Work at the Weizmann Institute of Science is supported by the Helen and Martin Kimmel Center for Nanoscale Science and by NanoMaterials, Ltd. R.T. is the holder of the Drake Family Chair in Nanotechnology. We thank Albert Migliori and David Tomnek for interesting discussions and Ronit Popovitz-Biro for the transmission electron microscope images.
APPENDIX: Group Theoretical Results for 2H-WS2
In 1970, Verble and Wieting carried out a complete symmetry analysis on hexagonal layered compounds with the goal of analyzing vibrational mode symmetries. Our analysis differs from that in Ref. Verble1970 in two ways: (1) a C correlation table accounts for the D3h 2(c) site symmetry of tungsten, and (2) a correlation table accounts for the C3v 4(f) site symmetry of sulfur Schutte1987 ; Fateley1972 . In Ref. Fateley1972 refer to Table 14, p. 50, and D6h correlation table, p. 210. Table A.1 summarizes our results. Local strain in the IF-WS2 breaks the selection rules of the 2H- “parent compound”, as detailed in the text.
Group Theoretical Analysis for 2H-WS2
Atom
Site Symmetry
Irreducible Representation
W
D3h
2(c)
A2u + B1g + E2g + E1u
S
C3v
4(f)
A1g + A2u + B1g + B2u
+ E1g + E1u + E2g + E2u
2A2u + 2B1g + A1g + B2u
+ E1g + 2E2g + 2E1u + E2u
2B1g + B2u + E2u
A2u + E1u
2E2g + A1g + E1g
A2u + E1u
References
- (1) R. Tenne, L. Margulis, M. Genut, and G. Hodes, Nature 360, 444 (1992).
- (2) L. Margulis, G. Salitra, and R. Tenne, Nature 365, 113 (1993).
- (3) P.A. Parilla, A.C. Dillon, K.M. Jones, G. Riker, D.L. Schulz, D.S. Ginley, and M.J. Heben, Nature 397, 114 (1999).
- (4) L. Rapoport, Yu. Bilik, Y. Feldman, M. Homyonfer, S.R. Cohen, and R. Tenne, Nature 387, 791 (1997).
- (5) L. Rapoport, Y. Feldman, M. Homyonfer, H. Cohen, J. Sloan, J.L. Hutchison, and R. Tenne, Wear 225, 975 (1999).
- (6) L. Rapoport, N. Fleischer, and R. Tenne, Adv. Mater. 15, 651 (2003).
- (7) W.X. Chen, J.P. Tu, Z.D. Xu, R. Tenne, R. Rosentsveig, W.L. Chen, and H.Y. Gan, Adv. Eng. Mater. 4, 686 (2002).
- (8) C. Schuffenhauer, G. Wildermuth, J. Felsche, and R. Tenne, Phys. Chem. Chem. Phys. 6, 3991 (2004).
- (9) L. Rapoport, N. Fleischer, and R. Tenne, J. Mater. Chem. 15, 1782 (2005).
- (10) Y.Q. Zhu, T. Sekine, Y.H. Li, W.X. Wang, M.W. Fay, H. Edwards, P.D. Brown, N. Fleischer, and R. Tenne, Adv. Mater. 17, 1500 (2005).
- (11) Here, 2H is based on Ramsdell notation with 2 indicating the number of S-W-S slabs within the unit cell and H representing the lattice type (hexagonal).
- (12) J.A. Wilson and A.D. Yoffe, Adv. Phys. 18, 193 (1969).
- (13) W.J. Schutte, J.L. De Boer, and F. Jellinek, J. Solid State Chem. 70, 207 (1987).
- (14) J.L. Verble and T.J. Wieting, Phys. Rev. Lett. 25, 362 (1970).
- (15) S. Uchida and S. Tanaka, J. Phys. Soc. Jpn. 45, 153 (1978).
- (16) G. Lucovsky, R.M. White, J.A. Benda, and J.F. Revelli, Pys. Rev. B 7, 3859 (1973).
- (17) G. Lucovsky, R.M. Martin, and E. Burstein, Phys. Rev. B 4, 1367 (1971).
- (18) G. Lucovsky, J.C Mikkelsen, Jr., W.Y. Liang, R.M. White and R.M. Martin, Phys. Rev. B 14, 1663 (1976).
- (19) E. Burstein, A. Pinczuk, and R.F. Wallis, in Proceedings of the Conference on the Physics of Semimetals and Narrow-gap Semiconductors (Pergamon Press, New York, 1971), p. 251.
- (20) Y. Feldman, E. Wasserman, D. J. Srolovitz, and R. Tenne, Science 267, 222 (1995).
- (21) Y. Feldman, G.L. Frey, M. Homyonfer, V. Lyakhovitskaya, L. Margulis, H. Cohen, G. Hodes, J.L. Hutchison, and R. Tenne, J. Am. Chem. Soc. 118, 5362 (1996).
- (22) D.J. Srolovitz, S.A. Safran, M. Homyonfer, and R. Tenne, Phys. Rev. Lett. 74, 1779 (1995).
- (23) C. Sourisseau, F. Cruege, and M. Fouassier, Chem. Phys. 150, 281 (1991).
- (24) G.L. Frey, R. Tenne, M.J. Matthews, M.S. Dresselhaus, and G. Dresselhaus, J. Mater. Res. 13, 2412 (1998).
- (25) Unpublished data, P.C. Klipstein, Department of Physics, Clarendon Laboratory, University of Oxford, Oxford, England.
- (26) G.L. Frey, S. Elani, M. Homyonfer, Y. Feldman, and R. Tenne, Phys. Rev. B 57, 6666 (1998).
- (27) M. Hershfinkel, L.A. Gheber, V. Volterra, J.L. Hutchison, L. Margulis, and R. Tenne, J. Am. Chem. Soc. 116, 1914 (1994).
- (28) M. Homyonfer, B. Alperson, Y. Rosenberg, L. Sapir, S.R. Cohen, G. Hodes, and R. Tenne, J. Am. Chem. Soc. 119, 2693 (1997).
- (29) Y. Feldman, A. Zak, R. Popovitz-Biro, and R. Tenne, Solid State Sci. 2, 663 (2000).
- (30) R. Rosentsveig, A. Margolin, Y. Feldman, R. Popoviz-Biro, and R. Tenne, Chem. Mater. 14, 471 (2002).
- (31) A. Margolin, R. Rosentsveig, A. Albu-Yaron, R. Popoviz-Biro, and R. Tenne, J. Mater. Chem. 14, 617 (2004).
- (32) R. Tenne, Angew. Chem. Int. Ed. 42, 5124 (2003).
- (33) F. Wooten, Optical Properties of Solids (Academic Press, New York, 1972).
- (34) These optical constants include the real and imaginary parts of the dielectric function, and , the energy loss function, Im(1/()), and the optical conductivity, . In our analysis, the low frequency data was extrapolated as a constant, and the high frequency data was extrapolated with an exponent of 2.4.
- (35) In the optical conductivity, , these features are centered at 356.5 and 438.3 cm-1 for the 2H compound and at 357.0 and 439.0 cm-1 for the IF nanoparticles.
- (36) G. Herzberg, Infrared and Raman Spectra of Polyatomic Molecules (D. Van Nostrand Company, Inc., New York, 1945).
- (37) H. Meller, Phys. Rev. 50, 547 (1936).
- (38) F. Gervais, Infrared and Millimeter Waves, Vol. 8 (Academic Press, New York, 1983).
- (39) We note that Uchida and Tanaka Uchida1978 report = 1.5 and = 0.4 for 2H-WS2, emphasizing the difference between powder and single crystal measurements.
- (40) cannot be obtained for the z-polarized interlayer A2u mode. The model for localized charge is developed for studying only the intralayer E1u mode in the layered 2H bulk material Burstein1970 ; Uchida1978 . Since the Lorentz factor is negative for the A2u mode, no realistic charge values could be determined.
- (41) J. Cao, J. Choi, J.L. Musfeldt, S. Lutta, and M.S. Whittingham, Chem. Mater. 16, 731 (2004).
- (42) K.W. Adu, H.R. Gutíerrez, U.J. Kim, G.U. Sumanasekera, and P.C. Eklund, Nano. Lett. 5, 409 (2005).
- (43) Formally, the local site symmetry of a curved sheet is C1, and all A modes are active. But practically, the nanoparticle curvature is small, so it is useful to consider the additional spectral features as perturbations to the planar picture.
- (44) I. Loa, C. Möschel, A. Reich, W. Assenmacher, K. Syassen, and M. Jansen, Phys. Status Solidi B 223, 293 (2001).
- (45) T. Sekine, T. Nakashizu, K. Toyoda, K. Uchinokura, and E. Matsuura, Solid State Commun. 35, 371 (1980).
- (46) Within the clusters centered at 347, 379, and 426 cm-1, we observe vibrational fine structure at 338.7, 342.1, 345.0, 349.1, 355.09, 356.2; 362.6, 365.0, 368.1, 371.5, 376.0, 378.2, 381.9, 384.5, 388.0, 394.0, 396.8; and 420.4, 425.7, 430.1, 433.0 cm-1, respectively.
- (47) W.G. Fateley, F.R. Dollish, N.T. McDevitt, and F.F. Bentley, Infrared and Raman Selection Rules for Molecular and Lattice Vibrations: The Correlation Method (Wiley-Interscience, New York, 1972).