Quantitative Analysis of Hydrogenated DLC Films by Visible Raman Spectroscopy
Abstract
The correlations between properties of hydrogenated diamond like carbon films and their Raman spectra have been investigated. The films are prepared by plasma deposition technique, keeping different hydrogen to methane ratio during the growth process. The hydrogen concentration, sp3 content, hardness and optical Tauc gap of the materials have been estimated from a detail analysis of their Raman spectra. We have also measured the same parameters of the films by using other commonly used techniques, like sp3 content in films by x-ray photoelectron spectroscopy, their Tauc gap by ellipsometric measurements and hardness by micro-hardness testing. The reasons for the mismatch between the characteristics of the films, as obtained by Raman measurements and by the above mentioned techniques, have been discussed. We emphasize on the importance of the visible Raman spectroscopy in reliably predicting the above key properties of DLC films.
Keywords : Diamond like carbon, Raman scattering.
I introduction
In recent years, hard diamond like carbon (DLC) films have attracted a great deal of research interest as they are useful materials for protective optical and tribological coating geis:1993 ; koidl:1989 ; angus:1988 ; robertson:1992 ; tsai:1987 . These films can be of greater economic importance in the long run, if their properties can be understood to the extent we know the bulk characteristics of diamond today. The characteristics of DLC films depend considerably on the atomic structure of the films. For example, opaque samples with hardness one-fifth of that for diamond and the transparent ones nearly as dense and hard as diamond tamor:1994 , have been considered as DLC films, for which specific properties have been investigated. This indicates that over a wide range of atomic structures one can achieve diamond-like behavior.
DLC films can be defined as composites of nanocrystalline diamond and/or amorphous carbon with/without hydrogen (required to passivate the dangling bonds of carbon). The films with 20 - 50 of hydrogen content is commonly known as hydrogenated DLC (HDLC) films. DLC films are usually composed of amorphous carbon with a significant amount of sp3 bonds ferrari:2000 . The films with higher (more than 85%) sp3 content are known as tetrahedral amorphous carbon (ta-C) rather than DLC. Such films along with a considerable amount of hydrogen content are known as ta-C:H. In general, the amorphous carbon can have sp3 (diamond-like), sp2 (graphite-like) and even sp1 sites. The properties of any carbon material depend on the ratio of the amount of sp2 to that of the sp3 bonds. In addition to the sp3 content, the clustering of sp2 phase also plays an important role in determining different properties of these materials, especially, their optical, electrical and mechanical characteristics. Moreover, the presence of nanocrystalline (NC) diamond in DLC/HDLC films results in a special characteristic of these materials compared to graphite or diamond. It has been shown by Badziag et al. that the nanodiamond clusters of less than 5 nm in diameter are more stable than the graphite clusters of same size badziag:1990 .
A variety of analytic techniques have been used to characterize the DLC/HDLC films. Common tools to measure sp2 and sp3 contents in the carbon films are nuclear magnetic resonance (NMR) kaplan:1985 ; tamor:1991 or electron energy loss spectroscopy (EELS) fink:1983 ; fallon:1993 . X-ray photoelectron (XP) spectroscopy has also been used to estimate sp3 content in DLC films yan:2004 . Ellipsometric measurement is in general used to measure the Tauc gap of the material franta:2002 ; vinnichenko:2004 . The standard techniques to measure hardness of DLC films are nano-indentation or micro-Vicker hardness testing marchon:1997 ; wazumi:2005 . All the above techniques have their own limitations when used for DLC films. For example, NMR and EELS are time-consuming and destructive techniques. The aim of this article is to show that Raman spectroscopy, a non-destructive probe, can be employed as a single technique, to predict all the above critical properties of DLC/HDLC films from a single measurement with better accuracy.
I.1 Raman modes
The Raman spectrum of diamond consists of T2g mode at 1332 cm-1 (sp3 mode). The phonon confinement in NC diamond results in a downshift in the Raman spectrum of the diamond line. The amount of shift depends on the grain size. For grains of less than 1 nm in size, the maximum of the vibrational density of states appears at 1260 cm-1 ferrari:2001 . On the other hand, the Raman spectrum of graphite usually shows two modes, zone center E2g phonon mode at around 1580-1600 cm-1 (commonly known as G-peak, sp2 mode) and K-point phonons at around 1350 cm-1 (commonly known as D-peak : disordered allowed zone edge mode of graphite). The sp1 mode is present in the HDLC film in a negligible amount. In HDLC films, other than NC diamond, the G- and D- peaks, features near 1150 cm-1 and its companion mode 1450 cm-1 appear due to sum and difference in combinations of C=C chain stretching and CH wagging modes [v1 and v3 modes of transpolyacetylene (Trans-PA)] lying in the grain boundary ferrari:2001 . Trans-PA is an alternate chain of sp2 carbon atoms, with a single hydrogen bonded to each carbon atom. In addition, recent work has shown that a particularly stable defect in diamond is the dumbbell defect, which consists of 100 split interstitials prawer:2000 in HDLC films. This localized defect consists of an isolated sp2 bonded pair. In vibrational density of states calculation of a largely four folded amorphous carbon network there is a strong evidence for paired three-fold coordinated defects which appear as a sharp localized mode at about 1600 cm-1 drabold:1994 .
I.2 Three Stage model
At this point it is to be noted that there is an inherent problem in applying visible Raman spectroscopy directly to estimate the ratio of sp3 and sp2 fraction in carbon materials by measuring the intensities of corresponding Raman modes : the visible Raman scattering cross-section is 50-230 times more sensitive to sp2 sites compared to that of sp3 sites, as visible photons preferentially excite the -states of sp2 sites. It was believed that visible Raman spectroscopy has a limited use to characterize DLC/HDLC films, especially to estimate the content of sp3 and sp2 fraction in these materials. Recently, based on atomic and electronic structure of disordered carbon, Ferrari and Robertson ferrari:2000 have proposed a three-stage model and have shown that disordered, amorphous and diamond like carbon phases in amorphous C-H films can be characterized by measuring the position and width of G-peak and intensity ratio of G- and D-peaks in Raman spectra, rather than by directly measuring their intensities. The changes in line shape of the Raman spectrum for carbon material, when its phase changes from graphite to NC carbon (stage one) to amorphous carbon (stage two) and then to ta-C carbon with about 85-90 sp3 bonding (stage three), have been explicitly shown in their article. During the first stage, with an increase in sp3 content in the material, the ratio of the intensity of D peak (ID) to that of G peak (IG) increases from 0.0 to 2.0 and simultaneously, the G peak position () increases from 1580 cm-1 to 1600 cm-1. However, in the second stage, a reverse trend is observed for both parameters with an increase in sp3 content : the ratio ID/IG decreases from 2.0 to 0.25, whereas, the value of decreases from 1600 to 1510 cm-1. For a phase transition from amorphous carbon to ta-C phase, increases (from 1520 to 1560 cm-1) with an increase in sp3 content and the intensity ratio ID/IG drops down further (from 0.25 to 0) from what was observed in stage two. For each stage, relations between G-peak position and sp3 content as well as Tauc gap of the carbon material have been discussed by authors.
In this article, we show how visible Raman spectra can be used as a fingerprint to characterize the DLC/HDLC -films grown by plasma deposition technique. Our emphasis will be on four important characteristics of HDLC films : sp3 content, hydrogen concentration, optical gap and hardness. Section II covers the sample preparation technique, which we have followed and other details regarding the instruments, which we have used for various measurements. In Section III, we have analyzed our experimental Raman spectra using the three-stage model proposed by Ferrari and Robertson, mentioned above. The analysis provides an insight into the chemical composition (eg. hydrogen content, sp3 content) and hardness of these films. The estimated sp3 content and hardness of the films, measured from Raman data analysis, have been compared with the results obtained from the XP spectroscopic and nano-indentation measurements, respectively. We could also make an approximate judgement of the optical Tauc gap in these films from the shift in in their Raman spectra. Later on, the measured gap energies have been compared with the values we get from ellipsometric measurements. Finally, in section IV, we have discussed our results with a few concluding remarks.
Here, we would like to mention that in the article tamor:1994 , Tamor and Vassel described a systematic study of the Raman spectra of amorphous carbon films. Based on experimental data, this phenomenological report revealed a clear correlation between the variation in the G-peak position and the change in optical gap and hardness of films. In this present report, based on the theoretical understanding proposed by Ferrari and Robertson ferrari:2000 , we have shown how Raman measurements can be used to study HDLC films in more detail. We have also shown the presence of NC diamond in our films. Furthermore, in this report, we have pointed out drawbacks of other commonly used probes to study this system.
II Experiments
Carbon thin films are deposited on mirror-polished Si(100) substrate at room temperature using asymmetric capacitively coupled RF (13.56 MHz) plasma system. The depositions are made systematically as follows: a pretreatment of the bare mirror polished Si (100) substrate has been done for 15 minutes using pure hydrogen plasma at pressure 0.2 mbar and dc self-bias of -200 volts. The deposition has been made for 30 minutes at pressure 0.7 mbar keeping the flow rate of helium (He) at 1500 sccm, hydrogen (H2) at 500 sccm, and varying the flow rate of methane (CH4). Five samples (for which the CH4 flow rates are 50 sccm, 30 sccm, 20 sccm, 18 sccm and 15 sccm), thus grown with varying H2 to CH4 ratio during deposition, will be represented as Sample A to Sample E, in the rest of the article.
Raman spectra are measured in back-scattering geometry using a 488 nm Argon ion laser as an excitation source. The spectrometer is equipped with 1200 gmm holographic grating, a holographic super-notch filter, and a Peltier cooled CCD detector. With 100 m slit-width of the spectrometer the resolution of our Raman measurement is 1 cm-1.
XP spectra are taken using PHI-5702 X-ray Photoelectron Spectroscope operating with monochromated Al K irradiation (photon energy 1476.6 eV) as an excitation source at a pass energy of 29.4 eV. The chamber pressure is maintained at 10-8 Pa.
Ellipsometric measurements of the five DLC films (Sample A - Sample E) are performed for the spectral range from 370 to 990 nm (1.25 3.35 eV) using J.A. Wollam ellipsometer( make USA) in the reflection mode. The angle of incidence is 70∘. From the ellipsometric measurements, the thickness of the films are estimated to be 120 20 nm.
Hardness of the films are measured by Leica micro- hardness tester operated using Vickers diamond indenter by applying a load of 50 gf at a minimum of three places for each sample. Diagonals of the indentations are measured to eliminate the asymmetry of the diamond pyramid.
Samples for Transmission Electron Microscopy (TEM) are deposited on 400 mesh copper TEM grids coated with carbon films. The suspended film is obtained by sonicating the substrate with film in Acetone; which is then directly added drop-wise on the grid. The excess acetone is allowed to evaporate in air. The grids are examined in Hitachi H600 microscope operated at 75 kV.
III Characterization of DLC films by Raman measurements and by other techniques
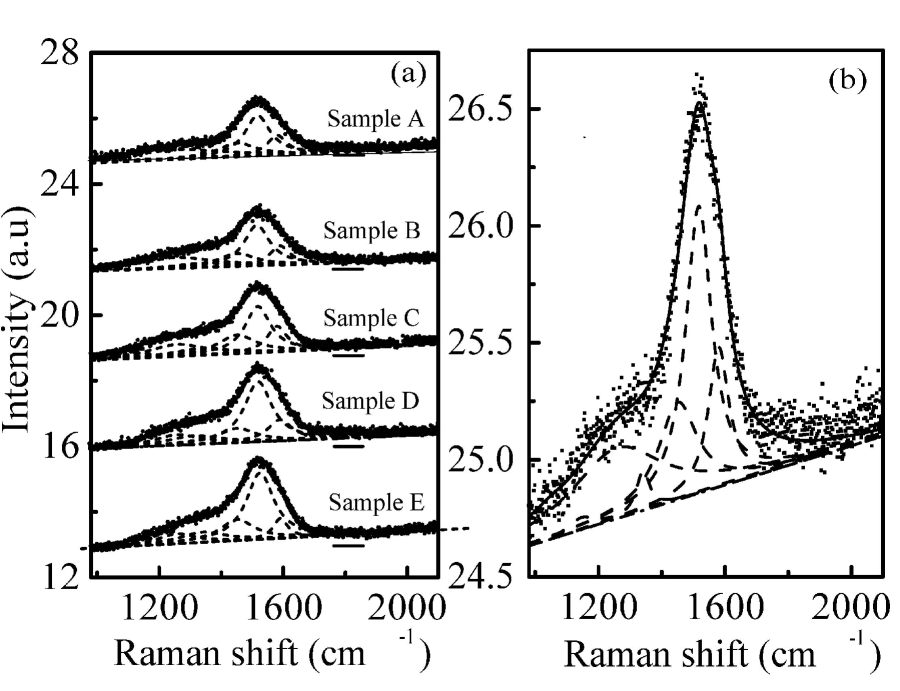
Fig. 1 (a) shows Raman spectra of Sample A to Sample E for the range from 950 to 2500 cm-1. The increasing PL background of each spectra is a typical signature of hydrogenated DLC (HDLC) films ferrari:2000 ; marchon:1997 . Keeping in mind the possibility of the presence of different phases of carbon, mentioned in section I, we have deconvoluted each spectrum with six Lorentzian functions (shown by dashed lines in Fig. 1) keeping intensities, width and peak positions as free fitting parameters. Table I provides all parameters, which we have obtained, in this analysis. It is to be noted that the asymmetric Breit-Wigner-Fano (commonly known as BWF) line shape is usually used to fit the G-peak which appears due to asymmetry of the vibrational density of states of graphite towards lower wavenumber. The tail of BWF line takes into account the Raman modes at 1100 and 1400 cm-1, mentioned in the previous section, without giving rise to extra peaks. In Fig. 1 (and Table I) we note that the intensities of the D-peak and other low frequency peaks are quite less than the intensity of the G-peak. Thus, if we deconvolute each spectrum with all low frequency components to obtain the information of individual modes, there is an inherent difficulty in using BWF line shape for the G-peak. For this reason, we have used Lorentzian line shapes for all modes to analyze our spectra. For clarity, in Fig 1 (b) we show the experimental data, deconvoluted lines and net fitted spectrum for Sample A. Below we discuss the properties of our DLC films obtained from above Raman data analysis :
| Sample | Sample E | Sample D | Sample C | Sample B | Sample A | Remarks |
|---|---|---|---|---|---|---|
| Peak position (cm | 1591 | 1589 | 1590 | 1589 | 1590 | Dumbbell |
| Width (cm-1) | 38 | 45 | 39 | 39 | 39 | defect |
| Intensity | 1708 | 3082 | 3045 | 2283 | 2331 | in NC |
| Peak position (cm | 1539 | 1524 | 1518 | 1515 | 1517 | |
| Width (cm-1) | 54 | 54 | 50 | 50 | 50 | G-peak |
| Intensity | 10943 | 9885 | 7059 | 6182 | 6132 | |
| Peak position (cm | 1451 | 1451 | 1451 | 1451 | 1451 | |
| Width (cm-1) | 67 | 64 | 66 | 64 | 65 | Trans-PA |
| Intensity | 4304 | 2919 | 4225 | 2919 | 900 | ( mode) |
| Peak position (cm | 1341 | 1341 | 1341 | 1341 | 1341 | |
| Width (cm-1) | 90 | 105 | 105 | 105 | 105 | D-peak |
| Intensity | 2813 | 2800 | 2332 | 1416 | 2146 | |
| Peak position (cm | 1258 | 1258 | 1258 | 1258 | 1258 | |
| Width (cm-1) | 73 | 91 | 110 | 148 | 177 | NC |
| Intensity | 2214 | 2894 | 4000 | 4858 | 5363 | diamond |
| Peak position (cm | 1150 | 1146 | 1146 | 1146 | 1146 | |
| Width (cm-1) | 51 | 50 | 52 | 50 | 50 | Trans-PA |
| Intensity | 84 | 70 | 73 | 58 | 74 | ( mode) |

(a) Hydrogen content: The main effect of hydrogen in HDLC films is to modify its C-C network. Instead of increasing the fraction of C-C bond, hydrogen saturates the C=C bonds as CHx groups to increase the sp3 content in the film ferrari:2000 . In visible Raman spectra, C-H stretching mode lies above 3000 cm-1, whereas, C-H bending mode (1290-1400 cm-1) is masked by the D-peak region ristein:1998 . Moreover, these modes are not resonantly enhanced in visible Raman spectroscopy. Thus, it is difficult to estimate hydrogen content in a HDLC film directly by using this technique. However, as a result of the recombination of electron-hole pairs within sp2 bonded clusters in HDLC films, the hydrogen content in films gives rise to a strong PL background for first order Raman spectra marchon:1997 . The ratio between the slope of the fitted linear background of the Raman spectrum (shown by dashed-dotted line in Fig. 1 (a)) due to photoluminescence and the intensity of G-peak (IG), , can be used as a measure of the bonded H content in the film. The slope parameter is described in micrometer unit marchon:1997 . Using this analysis, the decrease in intensity of bonded hydrogen content from Sample A to Sample E is shown in Fig. 2. It is to be noted that the observed decrease in H2 content is expected to increase the sp2 cluster size and results in a decrease in band gap from Sample A to Sample E ferrari:2000 .

(b) sp3 fractions in the films : The variation in from Sample A to Sample E, as obtained from their Raman spectra in Fig.1 (a), is shown in Fig. 3(a). The frequency of the Raman shift for and the presence of NC diamond in the films (which will be discussed latter), indicate that the characteristics of the films fall under the second stage of the three stage model. If one carefully notes the dispersion in Raman G-peak position, , in amorphous HDLC films and the sp3 content in the same samples obtained by other measurements (NMR and EELS), a certain correlation between these two parameters can be clearly observed. Ferrari and Robertson in Fig. 14 of ref ferrari:2000 summarized experimental data from different sources and have shown that sp3 content in the HDLC film is related to in the films. Similar characteristic has also been shown in Ref. tamor:1991 by Tamor et al. We have taken average of all data presented in these references in Fig. 3(b) and obtained an empirical relation by fitting the data points between 1525 cm-1 and 1580 cm-1 by a polynomial equation
| (1) |
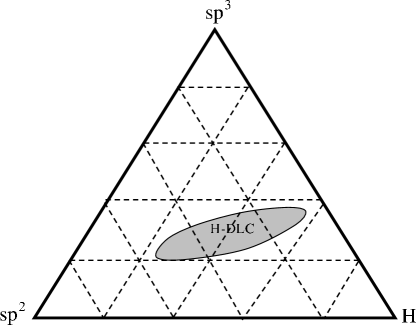
In this equation, has been taken in unit of inverse of micrometer unit. Eqn. 1 also demonstrates that for at 1580 cm-1, the sp3 fraction in the film is 0.24. Using the shift in G peak position in the above equation, the changes in sp3 content in the films are shown in Fig. 3(c) (they are also tabulated in Table II). If one looks into the ternary phase diagram for HDLC film robertson:1991 , as shown in Fig. 4, it is clear that with a decrease in hydrogen content the C-C sp3 bonding in the film should also decrease. Thus, the observed decrease in hydrogen content (shown in Fig. 2) supports the decrease in sp3 content in films, shown in Fig. 3(c).

Next, we have used XP Spectroscopy on these samples to measure their sp3 content. The XP spectra for Sample A to Sample E are shown in Fig. 5. After subtracting the background signal, C1s spectra of HDLC films are deconvoluted into four components around 283.6 0.2 eV, 284.6 0.2 eV, 285.4 0.2 eV, and 286.9 0.3 eV (Fig. 5). The peaks at around 284.3 eV and 285.3 eV correspond to sp2 carbon atoms cardona:1978 and sp3 C C bond zhao:2000 , respectively. The feature at 286.6 eV is assigned to C O contamination formed on the film surface due to air exposure yan:2004 ; zhao:2000 . The presence of lower energy peak at around 283 eV indicates that some carbon atoms in HDLC films are bonded to silicon substrate (carbon peak of carbide) yan:2004 . The full width at half maxima for both peaks at 284.3 eV and 285.3 eV are kept at 1.40.05 eV. The sp3 content in the films, as obtained from the ratio of the corresponding sp3 peak area over the total C1s peak area, have been tabulated in Table II along with the same obtained from visible Raman data analysis.
| Sample | sp3 content in | |
|---|---|---|
| from Raman | from XPS | |
| Sample A | 55 | 44 |
| Sample B | 56 | 43 |
| Sample C | 54 | 42 |
| Sample D | 51 | 43 |
| Sample E | 44 | 31 |

(c)Tauc gap : For quantitative analysis of the Tauc gap in DLC films, as done in reference ferrari:2000 , the authors have shown a correlation between with the optical Tauc gap of the material. Similar correlation between the same parameters has been reported by Tamor et al in Ref. tamor:1994 . We make a summary of all experimental data from the above references in Fig. 6(a) and fit them with a polynomial equation
| (2) |
As in Eqn. 1, has been taken in unit of inverse of micrometer unit. Eqn. 2 also demonstrates that for at 1580 cm-1, the Tauc gap of the film is 0.92 eV. From the variation in as shown in Fig. 3(b) and using Eqn. 2, we have estimated the variation in Tauc gap of the samples, which has been shown in Fig. 6(b) and also listed in Table III. Here, we would like to recall that a decrease in Tauc gap was expected due to the decreasing hydrogen content from Sample A to Sample E (see Fig. 2).
| Sample | Tauc Gap (eV) | |
|---|---|---|
| from Raman | from Ellipsometry | |
| Sample A | 2.05 | 1.59 |
| Sample B | 2.12 | 1.53 |
| Sample C | 2.01 | 1.49 |
| Sample D | 1.98 | 1.48 |
| Sample E | 1.40 | 1.41 |
The optical gap obtained from the analysis of Raman data, has been compared with the same measured directly from Ellipsometry. Both layer and substrate are characterized by spectral dependencies of the refractive indices (n and n⋆) and the extinction coefficients (k and k⋆).The spectral dependency of n⋆ and k⋆ of the silicon substrate are taken from ref. ohlidal:1999 . The spectral dependencies of the optical constants (n and k) of the DLC films for a wide spectral range can be interpreted by a semi-classical dispersion model with Lorentz oscillators corresponding to (originating from sp2 sites) and (originating from sp3 sites) interband transitions zhang:1998 . We have used this model to obtain n and k from the ellipsometric data. The shape of the imaginary part of the complex dielectric function ( = 2nk) above the band gap is given by the Tauc equation
| (3) |
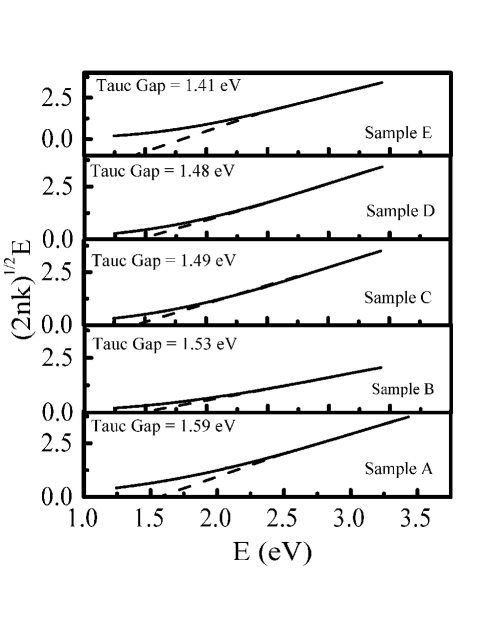
is the absorbance of the film. The intersection of the plot vs. (Tauc plot) with the axis, measures the energy of the band gap, . Tauc plots for Sample A to Sample E as obtained from the ellipsometric measurements are shown in Fig. 7. It is to be noted that plots for our DLC films are not strictly straight lines as indicated by Eqn. 3. This can be due to the existence of the Urbach tail (the transitions between localized states inside the band gap and extended states inside valence or conduction bands, which causes an exponential broadening of the absorption edge). From the intercept of the tangent of Tauc plots on axis we have obtained the optical band gap of HDLC films. The variation in optical band gap from Sample A to Sample E, as observed by ellipsometric measurements has been compared with that obtained from Raman measurements in Table IV.
(d)Hardness: In reference marchon:1997 we find a comment on variation in hardness of the DLC films with the percentage of Hydrogen in the film. Using this reference, we propose an empirical relation by fitting the data points by a linear equation
| (4) |
Using Eqn. 4 and the variation in hydrogen contents in our samples, we have estimated the hardness of the films. The hardness of each film, as obtained indirectly from Raman data analysis has been tabulated in Table IV along with the same obtained from micro-hardness testing.
| Sample | Hardness (GPa) | |
|---|---|---|
| from Raman | from micro-hardness test | |
| Sample A | 11.35 | 13.1 |
| Sample B | 15.37 | 12.7 |
| Sample C | 17.22 | 13.2 |
| Sample D | 17.60 | 11.4 |
| Sample E | 18.15 | 13.3 |
From Fig. 2, Fig. 3(c) and the above hardness analysis we conclude (a) a decrease in sp3 bonding from Sample A to Sample E does not degrade the hardness and scratch resistance of the deposit and (b) the low hydrogen content in the deposit strengthens the inter-molecular structure and, hence, leads to improved mechanical properties. Similar observation has been reported for Si implanted DLC films, where it has been shown from XP spectroscopic measurements that low hydrogen content in the DLC films results in a better hardness in these films zhao:2000 .
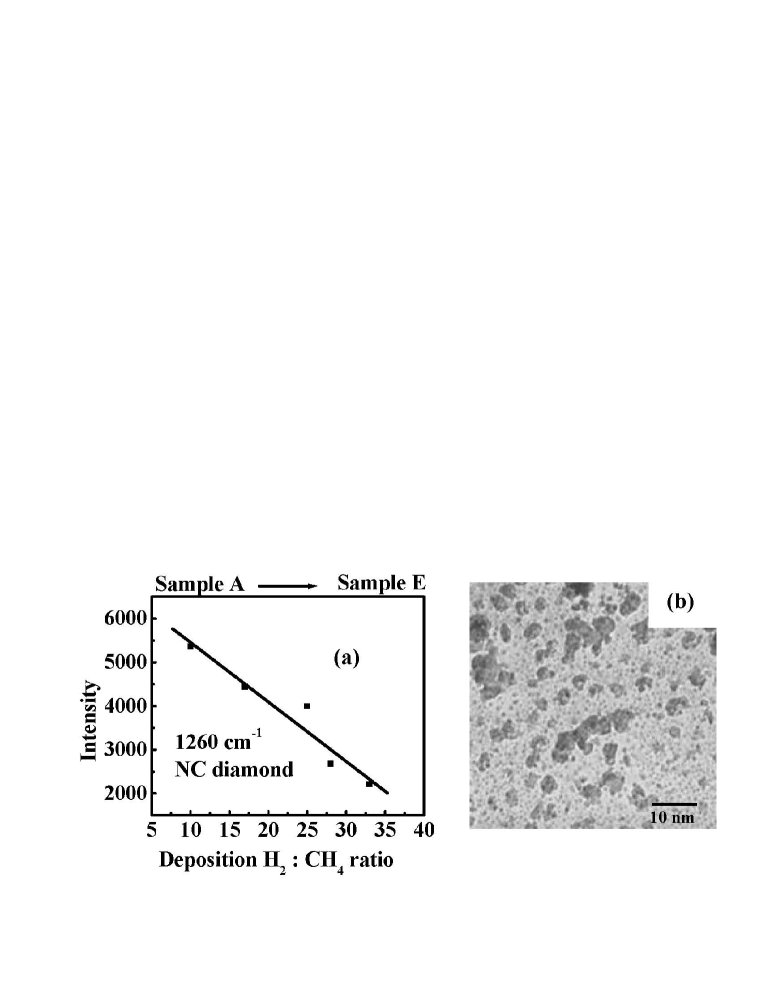
(e) Nanocrystalline diamond : The decrease in intensity of the peak at 1260 cm-1 [shown in Fig. 8 (a)] indicates a decrease in NC diamond phase from Sample A to Sample E. From our above analysis we summarize that the NC component in these films decreases along with (i) an increase in G-peak position from 1517 cm-1 to 1539 cm-1 [Fig. 3(b)] and (ii) a decrease in sp3 content [Fig. 3(c)]. The TEM image of one of our films is shown in Fig. 8(b). Presence of NC diamond along with larger particles is clear in the micrograph. This, in a way, supports our Raman data analysis by deconvolution.
IV Discussion
In this article we have tried to establish a workable phenomenological picture for characterizing DLC films using visible Raman spectroscopy. We are able to estimate sp3 and hydrogen content, optical gap and hardness of films, prepared by plasma deposition technique, by visible Raman measurements. We have summarized a number of data, available in the literature and then utilized the ‘three stage model’, which critically assesses the position of G peak in the Raman spectra of the films, to propose empirical relations between G-peak position and the values of sp3 content and Tauc gap in HDLC films.
We have also measured the sp3 content of the film by XP spectroscopy and optical band gap by ellipsometry. In addition, the hardness of the films are estimated from micro-hardness testing. In Table II, III and IV, we have compared the characteristics of DLC films as obtained from Raman data analysis and directly by the above mentioned measurements.
We now discuss the limitations of techniques while analyzing the characteristics of HDLC films on Si substrate. XP spectroscopy is a surface sensitive probe. Thus, this technique underestimates the value of sp3 fraction (obtained by fitting the XP spectra) if the thickness of the film is more than the electron mean free path ( 50 Å). Indeed, in Table II, we find that though both Raman and XP spectroscopic analysis exhibit decrease in sp3 content from Sample A to Sample E, the absolute values of the same obtained from XP spectroscopic measurements are less than the values obtained from Raman data analysis. Here, we would like to point out that rich sp3 phase of DLC films is often located below (depends on C energy) the surface layer. The surface layers are much more graphitic Lifshitz:1999 . XP spectroscopic measurement after etching the surface of the film under ultra high vacuum can be a solution to get the information of the inner layers; however, this experiment will damage the sample.
Furthermore, ellipsometry does not measure optical constants of materials directly. In this technique, we measure spectral dependency of the complex quantity , which is defined as . and represent the Fresnel coefficients of the sample. To get the spectral dependencies of the optical constants in the entire spectral region, one needs to understand the nature of dispersion in HDLC films. We have used ‘single sample method’ to analyze the ellipsometric data. We interpreted the spectral dependencies of the optical constants using Lorentz oscillator model. However, this model does not take into account the hydrogenated amorphous phase of the HDLC layer in a true sense. A more detailed nontrivial numerical analysis on modified Lorentz oscillator model is required to obtain the correct band gap of DLC films using ellipsometric measurements franta:2002 . may explain the mismatch in the Tauc gap of the samples obtained from Raman and ellipsometry measurements (shown in Table III); though both exhibit decrease in Tauc gap from Sample A to Sample E
Regarding the hardness measurements the source of discrepancy lies in the fact that our films are grown on Si substrate. The hardness of crystalline Si is 13 GPa, which is of the same order of magnitude as that of DLC. Thus, by indentation it is difficult to obtain the correct hardness of HDLC films subtracting the effect of the substrate. Indentation with less load does not measure the hardness of the films correctly. We attribute the discrepancy in hardness of the films, obtained from Raman and micro-hardness test to the fact that the latter is not a fool-proof technique to obtain the hardness of relatively thin DLC films on Si substrate.
Our Raman data analysis, based on a few empirical relations, may not be very accurate. However, by this, we overcome some of the above-mentioned shortcomings of the other techniques. The skin depth of the 488 nm excitation source, which we have used in Raman measurements is 6 . Thus, using this technique we get information for the whole material rather than only for the surface as was the case in XP spectroscopic measurements. Unlike ellipsometric measurements, Raman analysis takes into account all phases of carbon. The hardness of the films, obtained from Raman data analysis, does not require an understanding of the effect of the substrate separately. By correct data analysis, we have also shown the presence of NC diamond in our films.
In addition to , the intensity ratio of the D- and G peaks, can also be used to estimate the above parameters of HDLC films. We did not follow this procedure because of the following reasons : i) the intensity of the D peak is quite low compared to that of G peak in our samples (so the numerical value of ID/IG can be erroneous) and ii) in the low frequency regime of the Raman spectra the weak D-peak coexists with Raman components of other phases of carbon; hence the measured intensity of the D-peak from the curve fitting is not unique, it varies strongly with the choice of width and intensity of other nearby peaks.
Table V summarizes the physical properties of our HDLC films, as obtained by Raman data analysis.
| Sample | of sp3 content | Tauc gap (eV) | hardness (GPa) |
|---|---|---|---|
| Sample A | 57 | 2.03 | 11.35 |
| Sample B | 56 | 2.11 | 15.37 |
| Sample C | 55 | 1.91 | 17.22 |
| Sample D | 54 | 1.96 | 17.60 |
| Sample E | 43 | 1.39 | 18.15 |
V Acknowledgement
AR thanks Department of Science and Technology, India, for financial assistance. Authors thank Dr. S. Varma, Institute of Physics, Bhubaneswar, for their help on XPS measurements, Prof. K.K. Ray, Indian Institute of Technology, Kharagapur for Micro -Vicker’s testing, Mr. P. Roy, Saha Institute of Nuclear Physics for TEM measurements and Dr. Jens Raacke, University of Wuppertal, Germany for Ellipsometric measurements.
References
- (1) M.W. Geis and M.A. Tamor, Diamond and Diamondlike Carbon.The Encyclopedia of Applied Physics. 5, 1 (1993).
- (2) P. Koidl, C. Wild, B. Dischler, J. Wagner, and M. Ramsteiner, Material Science Forum. 52 53, 515 (1989).
- (3) M.C. Angus and C.C. Hayman, Science. 241, 913 (1988).
- (4) J. Robertson, Surf. Coatings Technol. 50, 185 (1992).
- (5) H. Tsai and D.B. Bogy, Vac. Sci. Technol. 5, 3287 (1987).
- (6) M.A. Tamor and W.C. Vassell, J. Appl. Phys. 76(6), 3823 (1994).
- (7) A.C. Ferrari and J. Robertson, Phys. Rev. B. 61(20), 14095 (2000).
- (8) P. Badziag, W.S. Verwoerd, W.P. Ellis, and N.R. Griener, Nature. 343, 244 (1990).
- (9) S. Kaplan, F. Jansen, and M. Machonkin, Appl. Phys. Lett. 47, 750 (1985).
- (10) M.A. Tamor, W.C. Vassell, and K.R. Carduner, Appl. Phys. Lett. 58, 592 (1991).
- (11) J. Fink, T. Muller-Heinzerling, J. Pfluger, A. Bubenzer, P. Koidl, and G. Crecelius, Solid state Commun. 47, 687 (1983).
- (12) P.J. Fallon, V.S. Veerasamy, C.A. Davis, J. Robertson, G.A.J. Amaratunga, W.I. Milne, and J. Koskinen, Phys. Rev. B. 48, 4777 (1993).
- (13) X.B. Yan, T. Xu, S.R. Yang, H.W. Liu, and Q.J. Xue, J. Phys. D: Appl. Phys. 37, 2416 (2004).
- (14) D. Franta, L. Zajckova, I. Ohldal, J. Janca, and K. Veltruska, Diamond Relat. Mater. 11, 105 (2002).
- (15) M. Vinnichenko, R. Gago , N. Huang , Y.X. Leng , H. Sun , U. Kreissig, M.P. Kulish and M.F. Maitza, Thin Solid Films. 455, 530 (2004).
- (16) B. Marchon, J. Gui, K. Grannen, G.C. Rauch, J.W. Ager, S.R.P. Silva, and J. Robertson, IEEE Trans. Magn. 33(5), 3148 (1997).
- (17) K. Wazumi, K. Fuchigami, K. Uematsu, Y. Koga and A. Tanaka, IHI Eng. Rev. 38, 32 (2005).
- (18) A.C. Ferrari and J. Robertson, Phys. Rev. B, 63, 121405-1 (2001).
- (19) S. Prawer, K.W. Nugent, D.N. Jamieson, J.O. Orwa, L.A. Bursill, and J.L. Peng, Chem. Phys. Lett. 332, 93 (2000).
- (20) D.A. Drabold, P.A. Fedders, and P. Stumm. Phys. Rev. B, 49, 16415 (1994).
- (21) J. Ristein, R.T. Stief, L. Ley, and W. Beyer, J. Appl. Phys. 84, 3836 (1998).
- (22) J. Robertson, Prog. Solid State Chem. 21, 199 (1991).
- (23) “Photoemission in solids I” Ed. M. Cardona dn L. Ley p.13, Springer Verlag (1978).
- (24) J.F. Zhao, P. Lemoine, Z.H. Liu, J.P. Quinn, and J.A. McLaughlin, J. Phys.: Condens. Matter 12, 9201 (2000).
- (25) I. Ohlídal, D. Franta, E. Pinc̆ík, M. Ohlídal, Surf. Interface Anal. 28, (1999) 240.
- (26) X. Zhang, W.H. Weber, W.C. Vassell, T.J. Potter, and M.A. Tamor, J. Appl. Phys. 83, 2820 (1998).
- (27) Y. Lifshitz, Diamond and Related Mat. 8, 1659 (1999).