Tunneling spectra of layered strongly correlated -wave superconductors
Abstract
Tunneling conductance experiments on cuprate superconductors exhibit a large diversity of spectra that appear in different nano-sized regions of inhomogeneous samples. In this letter, we use a mean-field approach to the model in order to address the features in these spectra that deviate from the BCS paradigm, namely, the bias sign asymmetry at high bias, the generic lack of evidence for the Van Hove singularity, and the absence of coherence peaks at low dopings. We conclude that these features can be reproduced in homogeneous layered -wave superconductors solely due to a proximate Mott insulating transition. We also establish the connection between the above tunneling spectral features and the strong renormalization of the electron dispersion around and and the momentum space anisotropy of electronic states observed in ARPES experiments.
Introduction – Tunneling and angle-resolved photoemission spectroscopy (ARPES) are unique experimental techniques in that they probe the single electron microscopic physics of strongly correlated systems like the cuprate -wave superconductors (dSC). Even though both techniques support the presence of well defined Bogoliubov nodal quasiparticles in these materials, away from the nodes deviations from the BCS paradigm are encountered MS0302 ; HM0249 ; PO0182 ; HF0104 ; ML0505 ; HL0401 ; ZY0401 ; RS0301 ; YZ0301 . Simultaneously describing these deviations in ARPES and tunneling experiments is of utmost importance to understand the nature of the underlying strong local correlations.
In this letter, we focus on the differential conductance measured by scanning tunneling microscopy (STM) experiments on the cuprates. In particular, we address three key aspects observed in the data as the electron concentration is increased toward half-filling, namely, (i) an increasing asymmetry of spectra for large positive and negative bias; (ii) the ubiquitous absence of peaks caused by the underlying Van Hove (VH) singularities in the quasiparticle density of states (DOS); (iii) the gradual depletion of the superconducting (SC) coherence peaks.
First, we argue that BCS expectations for dSC are at odds with the above features. BCS theory generally predicts that tunneling spectra of quasi-2D SC materials display VH singularity peaks in addition to two SC coherence peaks QK8801 ; FK9342 . However, these VH peaks are not observed by experiments in different cuprate families (Bi2212 PO0182 ; ML0505 ; MZ9918 ; OH9735 ; OM0039 , Bi2201 KF0111 , LSCO OM0039 , YBCO MR9554 ). Notably, even the SC coherence peaks are absent in certain tunneling spectra PO0182 ; HF0104 ; ML0505 ; HL0401 ; KI0404 .
We then show that the aforementioned non-trivial spectral features are reproduced in homogeneous SC systems close to the Mott insulating state. Specifically, we use a mean-field (MF) theory of doped Mott insulators RW0501 ; RW_mf that accounts for many fingerprints of strong correlation physics in ARPES data, including the strong band renormalization close to and KS9498 and the sharp momentum space anisotropy of electronic states, known as the nodal-antinodal dichotomy ZY0401 ; RS0301 ; YZ0301 , which we show are intimately connected to STM data. We thus obtain a consistent theoretical microscopic description of ARPES and tunneling spectroscopy. Moreover, we explicitly show that the above deviations from BCS spectra follow from how the local electron Coulomb repulsion and the resulting short-range antiferromagnetic (AF) correlations affect the phenomenology of dSC.
Tunneling spectra of BCS -wave superconductors – We consider the tunneling across a normal-metal – insulator – superconductor junction in the case of a 2D superconductor. Assuming specular transmission across a thin planar junction within the elastic channel, the differential tunneling conductance perpendicular to the 2D layers can be essentially equated to the quasiparticle DOS BD6779 ; WT9850 and, at zero temperature, it is given by M90
| (1) |
where is the tunneling matrix element, is the normal-metal DOS, is the bias of the SC sample with respect to the metal and is the electron spectral function in the SC sample. The sum in (1) is over the 2D layer’s Brillouin zone.
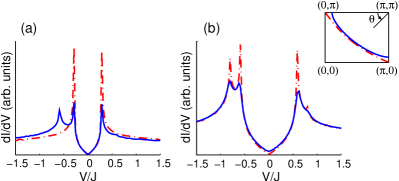
In Fig. 1 we use (1) together with the well known results for the BCS electron spectral function M90 to plot the BCS tunneling differential conductance. In particular, we take the normal state dispersion determined by the , and nearest-neighbor (NN) hopping parameters , and with HOP so that the normal state Fermi surface lies close to when the electron density is (inset of Fig. 1), as observed in LSCO IK0204 , Bi2201 TY0129 and in the antibonding sheet of Bi2212 BL0105 . In addition, we consider the -wave electron pairing gap function with . The resulting spectrum [see dash-dot line in Fig. 1(a)] depicts two sharp coherence peaks at due to the SC quasiparticle energy dispersion saddle-point at the SC gap energy. This behavior is consistent with experimental spectra around optimal doping PO0182 ; HF0104 ; ML0505 ; MZ9918 ; OH9735 ; OM0039 .
However, if the electron concentration is increased to the normal state Fermi surface intersects the line at a point, which we denote by , that moves away from (inset of Fig. 1). In this case, the VH singularity in at and shows up as a separate peak in the BCS tunneling spectrum at [Fig. 1(a)]. This additional peak appears behind the negative bias SC coherence peak unless or is so small that spectral broadening smears the VH and the SC coherence peaks into a single feature. However, as shown in Fig. 1(b), the above double peak structure still survives if, as expected for real materials upon increasing electron concentration, the -wave gap is doubled to and a broadening width is included BROADENING .
This behavior contrasts with the experimental observation that no such double peak structure occurs as the hole doping level is decreased PO0182 ; ML0505 ; MZ9918 ; OH9735 ; OM0039 and implies that the actual dispersion along in the cuprate materials is of the order of the SC gap energy scale, namely , which is an order of magnitude lower than . Such a flat dispersion in the antinodal region is supported by ARPES data in Bi2201, Bi2212 and YBCO KS9498 . Since ARPES observations also constrain the much larger nodal dispersion energy scale, as well as the curvature of the Fermi surface, several fine-tuned phenomenological parameters are required to fit the observed normal state dispersions [Fig. 2(a) displays the dispersions obtained by Norman et al. from experimental fits involving up to five hopping terms NR9515 ; N0051 ]. As Ref. DN9428, points out, the ubiquitous discrepancy between the energy scale of the nodal dispersion and that of the extended flat region around throughout the various cuprate families and doping levels suggests that interactions strongly renormalize the electron dispersion. Below, we argue that such phenomenological dispersions are natural to doped Mott insulators.
Renormalization of single electron properties – To discuss how the single electron dispersion relation and the momentum space distribution of spectral weight are renormalized in doped Mott insulators we consider the model, whose numerical calculations reproduce many spectral features of the cuprates TM0017 ; T0417 .
In the half-filled AF insulator, the electron dispersion is renormalized by the strong local AF correlations. In particular, NN hopping is heavily frustrated by the AF background and, for , holes hop coherently within the same sublattice by virtue of spin fluctuations KL8980 . As a result, the width of the nodal dispersion is reduced by a factor of from the bare value down to TM0017 . control the dispersion along and, since they describe intrasublattice hopping processes which are not frustrated by AF correlations, the dispersion width along this line is only renormalized by a factor TM0017 .
Away from half-filling, holes distort the AF spin background and change the surrounding spin configuration in order to coherently hop between NN sites and thus gain extra kinetic energy. Interestingly, exact diagonalization studies show that the resulting local spin correlations strongly renormalize and R0402 . This effect, which is predicted in spin liquids RW0301 , is consistent with the experimentally observed doping induced flatness of the dispersion in the antinodal region KS9498 since the dispersion along is controlled by and .
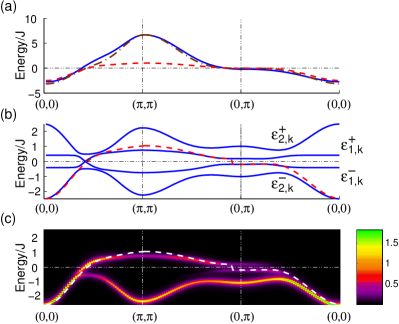
The “doped carrier” MF approach introduced in Refs. RW0501, ; RW_mf, accounts for the above interplay between the exchange energy of localized spins and the kinetic energy of delocalized holes. Here, we present only a qualitative description of the MF theory and defer the readers to the above references for formal details. This theory describes doped Mott insulators in terms of two different fermions: (i) “dopons”, which have the same charge and spin- as holes, describe vacancies surrounded by an AF spin configuration; (ii) “spinons”, which have no electric charge, describe spin- excitations of the spin background. The MF Hamiltonian thus has four fermionic bands: and [Fig. 2(b)]. If dopons and spinons do not hybridize the high energy bands describe the dynamics of holes in an AF background and, at MF level, the spinon bands do not contribute to electron spectral properties. The process of hybridizing dopons and spinons, which describes the change in spin correlations due to hole hopping, couples spin and charge dynamics and transfers electron spectral weight from to the lower energy bands [Fig. 2(c)]. This spectral weight transfer is not uniform in momentum space and reflects the dispersion of the dopon band, which has lower energy at than at . As a result, the band has more spectral weight near the nodal points than in the antinodal region RW0501 , in agreement with the nodal-antinodal dichotomy in ARPES data ZY0401 ; RS0301 ; YZ0301 . In conformity with other approaches to the related Hubbard model ST0401 , we conclude that this dichotomy results from short-range correlations, namely AF correlations RW_mf ; R0402 , in dSC.
The low energy dispersions derive from the spinon bands and, thus, from the spin exchange interaction. Therefore, they are controlled by a single energy scale, namely , which leads to an almost flat dispersion near the antinodal points. We thus find that the spin background strongly renormalizes the electron dispersion in the antinodal region. To explicitly compare the MF dispersion with the experimental fits to ARPES data we introduce the underlying normal dispersion such that equals: (i) at , and at the nodal point; (ii) at [Figs. 2(b) and 2(c)]. In Fig. 2(a) we plot for against the normal dispersion fits from Refs. NR9515, ; N0051, along major symmetry directions. Clearly, below the Fermi level captures the energy scale of the nodal dispersion and the flatness around antinodal points. ARPES does not probe the dispersion above the Fermi energy and both experimental fits use band calculation results to fix the energy at NR9515 , whence the mismatch between , obtained within the model context, and these fits above the Fermi level. Such a mismatch is supported by exact diagonalization calculations of the model which indicate that the dispersion above the Fermi level is less dispersive than expected from bare hopping parameters T0417 .
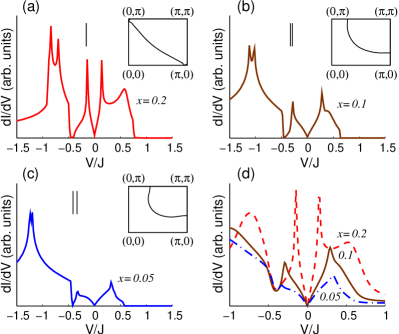
Tunneling spectra of strongly correlated -wave superconductors – We now consider the tunneling conductance for the above MF theory of doped Mott insulators. We use the same parameters as in Ref. RW0501, to obtain the curves at , and [Figs. 3(a)-3(c)]. We point out that the MF theory produces a sharp electron spectral peak at the band. However, we expect this spectral peak to be significantly broadened if one goes beyond the MF approximation since are high energy bands which have many channels to decay. Hence, in order to better compare to experiments, in Fig. 3(d) we depict the above spectra with a frequency dependent broadening given by .
Looking at Figs. 3(a)-3(c) we recognize the separate contribution to the tunneling DOS from bands , and . The positive energy band does not appear since it has vanishing spectral weight [see Fig. 2(c)]. The presence of the negative energy bands and leads to a peak-dip-hump in the curve as observed by experiments ML0505 ; MZ9918 . This negative bias hump, which moves to higher energy as doping is lowered ML0505 ; MZ9918 , derives from the lower Hubbard band and renders the tunneling conductance plots highly asymmetric for large positive and negative bias. At smaller values of the spectral weight in the and bands is transfered to the high-energy hump and, thus, the above bias sign asymmetry is enhanced upon underdoping as seen in STM data PO0182 ; ML0505 ; HL0401 ; KI0404 . In particular, the ratio of integrated spectral weight at positive bias over that at negative bias is , in perfect agreement with sum rules applicable to the generalized- model RS0501 . The above behavior is a hallmark of models where strong local Coulomb repulsion between electrons makes it easier to add a hole to the sample than to add an electron.
Figs. 3(a)-3(c) depict the doping evolution of the minimum gap locus, which reproduces experiments IK0204 , and denote the VH singularity and SC gap energies, and respectively, by the small vertical bars. Changing from to the wave vector distances from , yet remains extremely small since the dispersion is very flat in the antinodal region. Therefore, no extra peak develops next to the SC coherence peak, unlike the cases depicted in Fig. 1. The energy difference increases for , yet, we observe a strong suppression of the SC coherence peak in the tunneling spectrum of Fig. 3(c) instead of a double peak structure. Below, we explain this behavior, which is in stark contrast with weak coupling BCS predictions.
The curves in Fig. 3 show how the SC coherence peak evolves with doping level. The spectrum displays well defined SC coherence peaks, in agreement with spectra of samples around optimal doping PO0182 ; HF0104 ; ML0505 ; MZ9918 ; OH9735 ; OM0039 . In the underdoped spectrum the SC coherence peaks are pushed to higher energy due to the SC gap doping dependence and lose spectral weight, as seen in experiments PO0182 ; ML0505 ; MZ9918 ; OH9735 . The spectrum for the SC state at hardly resolves the SC coherence peaks as found in deeply underdoped Bi2212 ML0505 ; PO0182 and NaCCOC HL0401 ; KI0404 . The gradual depletion of the SC coherence peak intensity as the half-filled state is approached follows from the correspondingly gradual depletion of spectral weight in the antinodal region which underlies the formation of the low energy spectral weight arcs observed both in ARPES experiments ZY0401 ; RS0301 ; YZ0301 and in theoretical approaches RW0501 ; ST0401 . In our calculation, this behavior explicitly results from the presence of short-range AF correlations in dSC.
As we emphasize in Fig. 3(d), the doping evolution of the curves leads to qualitatively different line shapes around optimal doping and in the deeply underdoped regime. We refer to Fig. 2 of Ref. ML0505, to show that the above results reproduce experimental evidence for different types of spectra in SC cuprate materials. Since this STM spectral diversity occurs in samples which are inhomogeneous on the nano-scale PO0182 ; HF0104 ; ML0505 ; KI0404 ; FC0607 ; ML0548 , it has been proposed that these non-trivial line shapes are intrinsically related to the presence of the underlying sample inhomogeneity FC0607 . The possible relevance of coexisting orders ML0505 ; HL0401 and phase separation scenarios HF0104 ; KI0404 has also been pointed out in the literature. However, here we show that the aforementioned unusual and diverse spectra can be reproduced in homogeneous SC systems solely due to the presence of strong correlations that follow from a proximate Mott insulating state. This theoretical assertion supports that electron dynamics in these materials is, to a large extent, determined by properties which are local even when compared to the nano-sized sample inhomogeneities, in conformity with experimental results ML0548 .
Acknowledgements.
This work was supported by the Fundação Calouste Gulbenkian Grant No. 58119 (Portugal), by the NSF Grant No. DMR–01–23156, NSF-MRSEC Grant No. DMR–02–13282 and NFSC Grant No. 10228408 and by the DOE Grant No. DE-AC02-05CH11231.References
- (1) H. Matsui et al., Phys. Rev. Lett. 90, 217002 (2003).
- (2) J.E. Hoffman et al., Science 297, 1148 (2002).
- (3) S.H. Pan et al., Nature 413, 282 (2001).
- (4) C. Howald et al., Phys. Rev. B 64, 100504(R) (2001).
- (5) K. McElroy et al., Phys. Rev. Lett. 94, 197005 (2005).
- (6) T. Hanaguri et al., Nature 430, 1001 (2004).
- (7) X.J. Zhou et al., Phys. Rev. Lett. 92, 187001 (2004).
- (8) F. Ronning et al., Phys. Rev. B 67, 165101 (2003).
- (9) T. Yoshida et al., Phys. Rev. Lett. 91, 027001 (2003).
- (10) W.-M. Que and G. Kirczenow, Phys. Rev. B 38, 4601 (1988).
- (11) A.J. Fedro and D.D. Koelling, Phys. Rev. B 47, 14342 (1993).
- (12) N. Miyakawa et al., Phys. Rev. Lett. 83, 1018 (1999).
- (13) M. Oda et al., Physica. C 281, 135 (1997).
- (14) M. Oda et al., Supercond. Sci. Technol. 13, R139 (2000).
- (15) M. Kugler et al., Phys. Rev. Lett. 86, 4911 (2001).
- (16) I. Maggio-Aprile et al., Phys. Rev. Lett. 75, 2754 (1995).
- (17) Y. Kohsaka et al., Phys. Rev. Lett. 93, 097004 (2004).
- (18) T.C. Ribeiro and X.-G. Wen, Phys. Rev. Lett. 95, 057001 (2005).
- (19) T.C. Ribeiro and X.-G. Wen, cond-mat/0601174 (2006).
- (20) D.M. King et al., Phys. Rev. Lett. 73, 3298 (1994).
- (21) D.J. BenDaniel and C.B. Duke, Phys. Rev. 160, 679 (1967).
- (22) J.Y.T. Wei et al., Phys. Rev. B 57, 3650 (1998).
- (23) G.D. Mahan, Many-Particle Physics (Plenum, New York, 1990).
- (24) Generically, in the copper-oxide planes PD0103 .
- (25) E. Pavarini et al., Phys. Rev. Lett. 87, 047003 (2001).
- (26) A. Ino et al., Phys. Rev. B 65, 094504 (2002).
- (27) T. Takeuchi et al., J. Electron Spectrosc. Relat. Phenom. 114-116, 629 (2001).
- (28) P. Bogdanov et al., Phys. Rev. B 64, 180505(R) (2001).
- (29) is consistent with experiments OH9735 ; HF0104 .
- (30) M.R. Norman et al., Phys. Rev. B 52, 615 (1995).
- (31) M.R. Norman, Phys. Rev. B 61, 14751 (2000).
- (32) E. Dagotto et al., Phys. Rev. Lett. 73, 728 (1994).
- (33) T. Tohyama and S. Maekawa, Supercond. Sci. Technol. 13, R17 (2000).
- (34) T. Tohyama, Phys. Rev. B 70, 174517 (2004).
- (35) C. Kane et al., Phys. Rev. B 39, 6880 (1989).
- (36) T.C. Ribeiro, cond-mat/0605437.
- (37) T.C. Ribeiro and X.-G. Wen, Phys. Rev. B 68, 024501 (2003).
- (38) D. Sénéchal and A.M.S. Tremblay, Phys. Rev. Lett. 92, 126401 (2004).
- (39) M. Randeria et al., Phys. Rev. Lett. 95, 137001 (2005).
- (40) A.C. Fang et al., Phys. Rev. Lett. 96, 017007 (2006).
- (41) K. McElroy et al., Science 309, 1048 (2005).