Superconductivity and Lattice Instability in Compressed Lithium from Fermi Surface Hot Spots
Abstract
The highest superconducting temperature Tc observed in any elemental metal (Li with T 20 K at pressure P 40 GPa) is shown to arise from critical (formally divergent) electron-phonon coupling to the transverse phonon branch along intersections of Kohn anomaly surfaces with the Fermi surface. First principles linear response calculations of the phonon spectrum and spectral function reveal (harmonic) instability already at 25 GPa. Our results imply that the fcc phase is anharmonically stabilized in the 25-38 GPa range.
The recent observations of superconductivity in fcc Li up to Tc = 14 K in near-hydrostatic fcc-phase samples,schilling and as high as 20 K in non-hydrostatic pressure cells,shimizu ; struzhkin in the pressure range 20 GPa P 40 GPa provides almost as startling a development as the discoveryakimitsu in 2001 of Tc = 40 K in MgB2. Lithium at ambient conditions, after all, is a simple -electron metal showing no superconductivity above 100 K.finns What can possibly transform it into the best elemental superconductor known, still in a simple, monatomic, cubic phase? There is no reason to suspect a magnetic (or other unconventional) pairing mechanism, but it seems equally unlikely that it transforms into a very strongly coupled electron-phonon (EP) superconductor at readily accessible pressures.
The strength of EP coupling in Li has attracted attention for some time. Evaluations based on empirical pseudopotentialsallenLi early on suggested substantial coupling strength =0.56 and hence readily observable superconductivity (T 1 K); more recent calculations relying on the rigid muffin-tin approximation (RMTA) reached a similar conclusionjarlborg ; novikov and led to prediction of remarkably high T K under pressure.novikov None of these studies actually calculated phonon frequencies, relying instead on estimates of a representative phonon frequency based on the Debye temperature, which is only an extrapolation from the phonons. Linear response calculations of the phonons and EP couplingliu in bcc Li confirmed that superconductivity would occur in bcc Li ( = 0.45), but superconductivity is not observed due to the transformation into the 9R phase with 25% weaker coupling. Experimentally, superconductivity only appears above 20 GPa in the fcc phase.
In this paper we focus on the monatomic fcc phase that is stable in the 20-38 GPa range. After providing additional characterization of the previously discussedneaton ; iyakutti ; hanfland ; rodriguez evolution of the electronic structure under pressure, we analyze the implications of the Fermi surface (FS) topology for properties of Li. To study microscopically we focus on the decompositionallen into mode coupling strengths , where is the Brillouin zone (BZ) and phonon branch () average. We find that increase of pressure leads to very strong EP coupling to a specific branch in very restricted regions of momentum space determined by the FS topology; these features are directly analogous to the focusing of coupling strengthucd ; kortus ; kong in MgB2. Unlike in MgB2, tuning with pressure leads to a vanishing harmonic frequency at 25 GPa, beyond which the fcc phase is stabilized by anharmonic interactions.
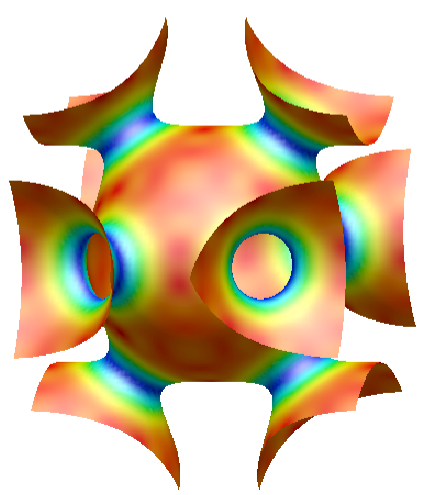
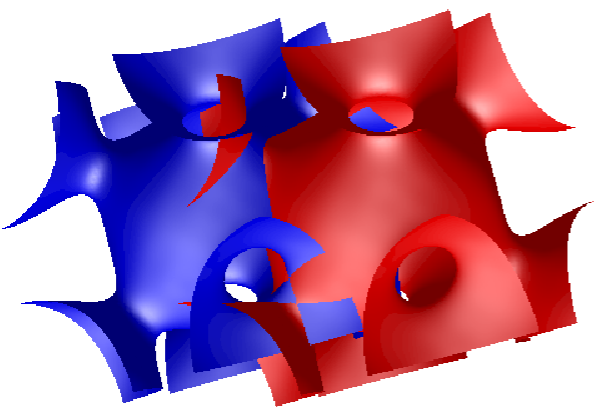
The volume at 35 GPa is 51% of that at P=0, so the conduction electron density has doubled. The shift in character from to is analogous to the crossover in the heavier alkali metals.mcmahan The occupied bandwidth increases by only 14%, much less than the free electron value -1 = 59%; this discrepancy is accounted for by the 55% increase in the k=0 band mass (=1.34 at P=0 to =2.08 at 35 GPa). At P=0 in the fcc phase the FSs are significantly nonspherical and just touch at the L points of the BZ; necks (as in Cu), where the character is strongest, grow with increasing pressure, and the FS at 35 GPa is shown in Fig. 1, colored by the Fermi velocity. The topology of the FS plays a crucial role in the superconductivity of Li, as we discuss below.
The coupling strength is the average of mode coupling constantsallen
| (1) |
with magnitude determined by the EP matrix elements and the nesting function describing the phase space for electron-hole scattering across the FS (EF=0),
| (2) |
Here the integral is over the line of intersection of the FS and its image displaced by , is the velocity, and N(0) is the FS density of states. Evidently gets large if one of the velocities gets small, or if the two velocities become collinear.
Note that = [N(0)]2; the topology of the FS simply determines how the fixed number of scattering processes is distributed in Q. For a spherical FS ; in a lattice it is simply a reciprocal lattice sum of such functions. This simple behavior (which would hold for bcc Li at P=0, for example) is altered dramatically in fcc Li, as shown in Fig. 2 for P=35 GPa (the nonphysical and meaningless divergence around should be ignored). There is very fine structure in that demands a fine k mesh in the BZ integration, evidence that there is strong focusing of scattering processes around the K point, along the -X line peaking at -XXK, and also a pair of ridges (actually, cuts through surfaces) running in each (001) plane in K-XK-K-XK-K-XK-K squares. Some additional structures are the simple discontinuities mentioned above, arising from the spherical regions of the FS.
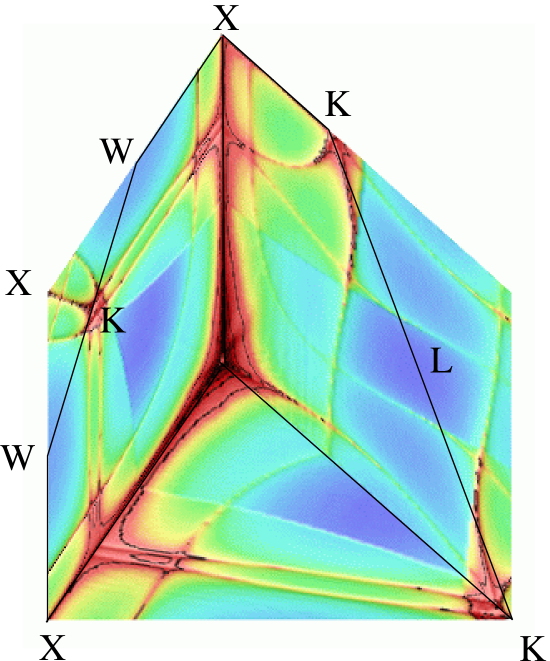
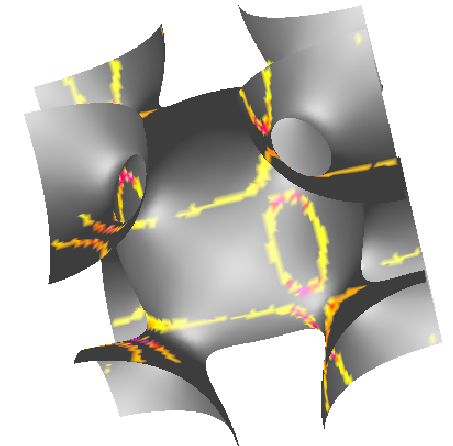
Structure in arises where the integrand in Eq. 2 becomes singular, i.e. when the velocities at and become collinear. The FS locally is either parabolic or hyperbolic, and the nature of the singularity is governed by the difference surface which also is either parabolic or hyperbolic. In the parabolic case (such as two spheres touching) has a discontinuity. In the hyperbolic case, however, diverges logarithmically. Such divergent points are not isolated, but locally define a surface of such singularities (or discontinuities, in the parabolic case). The ridges and steps visible in Fig. 2 are cuts through these singular surfaces (more details will be published elsewhere); the intensity at K arises from transitions from one neck to (near) another neck and is enhanced by the low neck velocity. Roth et al. have pointed out related effects on the susceptibilityroth (which will analogously impact the real part of the phonon self-energy), and Rice and Halperinrice have discussed related processes for the tungsten FS. In the susceptibility (and hence in the phonon renormalization) only FS nesting with antiparallel velocities gives rise to Q-dependent structure. This explains why the ridge in along the -X line (due to transitions between necks and the region between necks) does not cause much softening (see below); there will however be large values of because its structure depends only on collinearity.
Divergences of , which we relate to specific regions of the FS shown in the bottom panel of Fig. 1 (mostly distinct from the flattened regions between necks discussed elsewhererodriguez ), specify the Q regions of greatest instability. However, instabilities in harmonic approximation ( 0) may not correspond to physical instabilities: as the frequency softens, atomic displacements increase and the lattice can be stabilized to even stronger coupling (higher pressure) by anharmonic interactions. Thus, although we obtain a harmonic instability at QK already at 25 GPa, it is entirely feasible that the system is anharmonically stabilized beyond this pressure. We infer that indeed the regime beyond 25 GPa is an example of anharmonically stabilized “high Tc” superconductivity.
The phonon energies and EP matrix elements have been obtained from linear response theory as implemented in Savrasov’s full-potential linear muffin-tin orbital code.Sav Phonons are calculated at 72 inequivalent Q points (a 121212 grid), with a 404040 grid for the zone integration. To illustrate the evolution with pressure, we use the fcc lattice constants 8.00, 7.23, 6.80, and 6.41 bohr, corresponding approximately to 0, 10, 20, and 35 GPa respectively (and we use these pressures as labels).
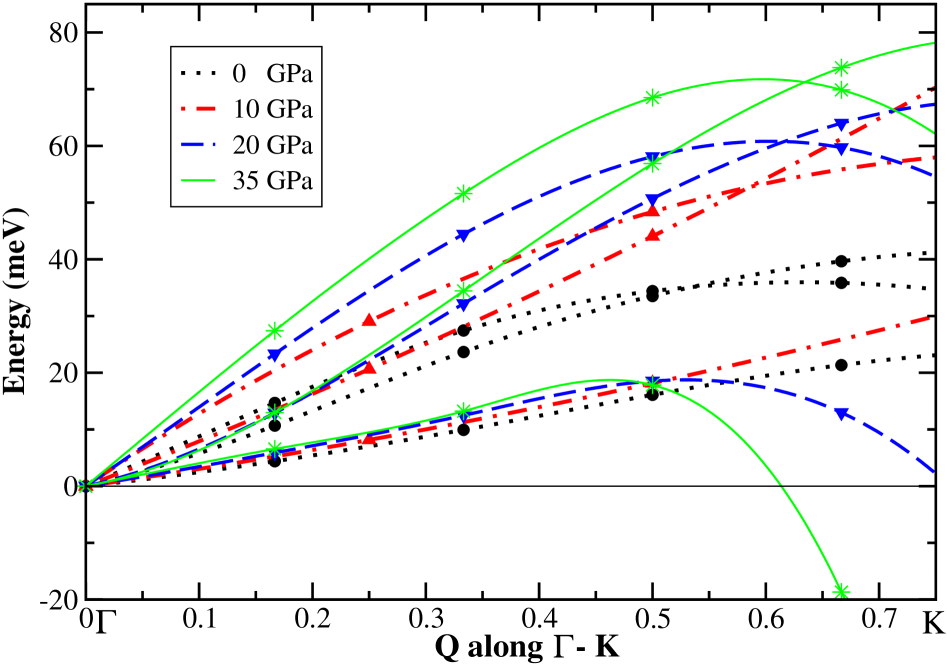
The phonon spectrum along -X behaves fairly normally. The longitudinal () branch at X hardens from 45 meV to 87 meV in the 0-35 GPa range, while the transverse () mode at X remains at 30-35 meV. Along -L the behavior is somewhat more interesting: again the branch hardens as expected, from 40 to 84 meV, but the branch remains low at 15-17 meV at the L point and acquires a noticeable dip near the midpoint at 35 GPa. The important changes occur along the (110) -K direction as shown in Fig. 3: the and branches harden conventionally, but the polarized branch softens dramatically around the K point, becoming unstable around 25 GPa. At 35 GPa this mode is severely unstable in a substantial volume near the K point (not only along the -K line).
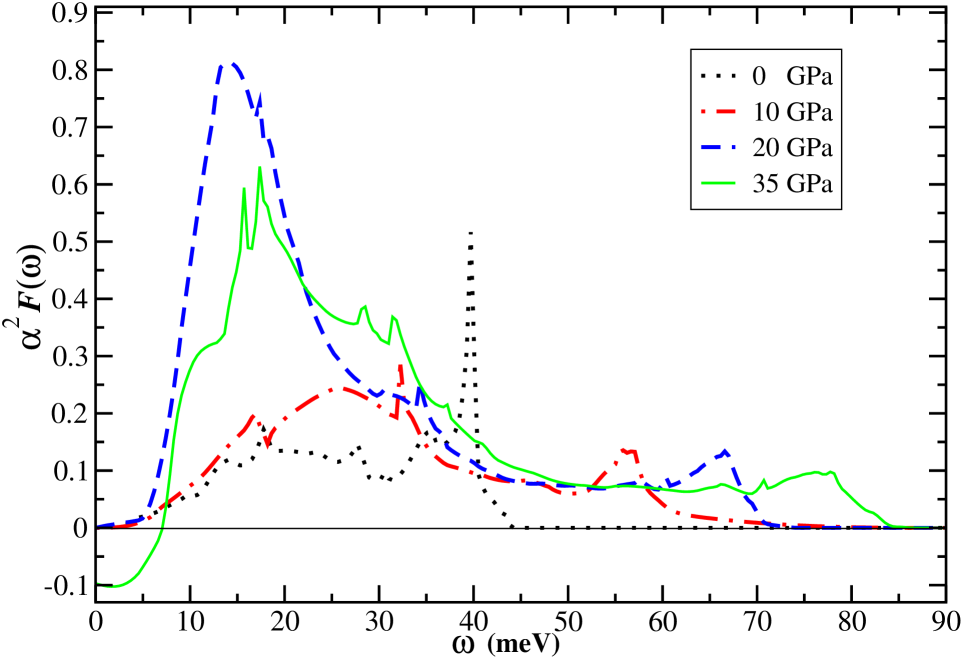
We have evaluated the EP spectral function using our mesh of 72 Q points and the tetrahedron method. Due to the fine structure in and hence in , numerically accurate results cannot be expected, but general trends should be evident. The resulting spectra are displayed in Fig. 3(b) for each of the four pressures, showing the hardening of the highest frequency mode with pressure (43 meV 83 meV). The most important change is the growth in weight centered at 25 meV (10 GPa) and then decreasing to 15 meV (20 GPa) beyond which the instability renders any interpretation at 35 GPa questionable. The growing strength is at low energy; note however that this region is approaching the energy 10 meV which Bergmann and Rainerrainer found from calculation of to be the optimal position to concentrate the spectral weight. These spectra give the values of , , and given in Table 1. The commonly chosen value in the Allen-Dynes equationalldyn (which describes the large regime correctly) gives observable values of Tc = 0.4-5 in the 1-10 GPa range, but Li is not fcc at these pressures. The 20 K obtained for 20 GPa is satisfyingly close to the range of observed Tc, and could be depressed to the observed value by anharmonic interactions or by a larger value of .
| Pressure | Tc | |||
|---|---|---|---|---|
| 0 | 209 | 277 | 0.40 | 0.4 |
| 10 | 225 | 301 | 0.65 | 5 |
| 20 | 81 | 176 | 3.1 | 20 |
We have shown how Fermi surface topology can concentrate scattering processes into specific surfaces in Q-space, and even in alkali metals can lead to very strong coupling to phonons with these momenta, and can readily drive lattice instability. To enhance , it is necessary in addition that the large regions of are accompanied by large EP matrix elements. We have verified that the Q= (unstable) phonon (near K) causes large band shifts with atomic displacement ( 5 eV/Å) near the FS necks, while for the stable mode band shifts are no more than 5% of this value. Thus the focusing of scattering processes is indeed coupled with large, polarization-dependent matrix elements.
This focusing of EP coupling strength makes accurate evaluation of the total coupling strength numerically taxing. The richness and strong -dependence of the electron-phonon coupling that we have uncovered may explain the overestimates of Tc in the previous work in Li, and may apply to the overestimates in boronboron . It is clear however that it is EP coupling and not Coulomb interactionjansen that is responsible for the impressively high Tc. Compressed Li thus has several similarities to MgB2 – very strong coupling to specific phonon modes, Tc determined by a small fraction of phonons – but the physics is entirely different since there are no strong covalent bonds and it is low, not high, frequency modes that dominate the coupling. Compressed Li is yet another system that demonstrates that our understanding of superconductivity arising from“conventional” EP coupling is far from complete, with different systems continuing to unveil unexpectedly rich physics.
We acknowledge important communication with K. Koepernik, A. K. McMahan, and S. Y. Savrasov. This work was supported by National Science Foundation grant Nos. DMR-0421810 and DMR-0312261. A.L. was supported by the SEGRF program at LLNL, J.K. was supported by DOE grant FG02-04ER46111, and H.R. was supported by DFG (Emmy-Noether-Program).
References
- (1) S. Deemyad and J. S. Schilling, Phys. Rev. Lett. 91, 167001 (2003).
- (2) K. Shimizu et al., Nature 419, 597 (2002).
- (3) V. V. Struzhkin et al., Science 298, 1213 (2002).
- (4) J. Nagamatsu et al. Nature 410, 63 (2001).
- (5) K. I. Juntunen and J. T. Tuoriniemi, Phys. Rev. Lett. 93, 157201 (2004).
- (6) P. B. Allen and M. L. Cohen, Phys. Rev. 187, 525 (1969).
- (7) T. Jarlborg, Phys. Scr. 37, 795 (1988).
- (8) N. E. Christensen and D. L. Novikov, Phys. Rev. Lett. 86, 1861 (2001).
- (9) A. Y. Liu et al., Phys. Rev. B 59, 4028 (1999).
- (10) J. B. Neaton and N. W. Ashcroft, Nature 400, 141 (1999).
- (11) K. Iyakutti and C. Nirmala Louis, Phys. Rev. B 70, 132504 (2004).
- (12) M. Hanfland, K. Syassen, N. E. Christensen, and D. L. Novikov, Nature 408, 174 (2000); N. E. Christensen and D. L. Novikov, Phys. Rev. Lett. 86, 1861 (2001).
- (13) A. Rodriguez-Prieto and A. Bergara, Proc. of the Joint 20th AIRAPT-43rd EHPRG 2005 Conference (unpublished); cond-mat/0505619.
- (14) J. An and W. E. Pickett, Phys. Rev. Lett. 86, 4366 (2001).
- (15) J. Kortus et al, Phys. Rev. Lett. 86, 4656 (2001).
- (16) Y. Kong et al., Phys. Rev. B 64, 020501 (2001).
- (17) P. B. Allen, Phys. Rev. B 6, 2577 (1972); P. B. Allen and M. L. Cohen, Phys. Rev. Lett. 29, 1593 (1972).
- (18) A. K. McMahan, Phys. Rev. B 29, 5982 (1984).
- (19) L. M. Roth, J. J. Zieger, and T. A. Kaplan, Phys. Rev. 149, 519 (1965).
- (20) T. M. Rice and B. I. Halperin, Phys. Rev. B 1, 509 (1970).
- (21) S. Y. Savrasov, Phys. Rev. B 54, 16470 (1996); S. Y. Savrasov and D. Y. Savrasov, ibid. 54, 16487 (1996).
- (22) G. Bergmann and D. Rainer, Z. Physik A 252, 174 (1972).
- (23) P. B. Allen and R. C. Dynes, Phys. Rev. B 12, 905 (1975).
- (24) S. K. Bose, T. Kato, and O. Jepsen, cond-mat/0507283.
- (25) L. Jansen, Physica A 332, 249 (2004).