Nonequilibrium steady states in a vibrated-rod monolayer : tetratic, nematic, and smectic correlations
Abstract
We study experimentally the nonequilibrium phase behaviour of a horizontal monolayer of macroscopic rods. The motion of the rods in two dimensions is driven by vibrations in the vertical direction. Aside from the control variables of packing fraction and aspect ratio that are typically explored in molecular liquid crystalline systems, due to the macroscopic size of the particles we are also able to investigate the effect of the precise shape of the particle on the steady states of this driven system. We find that the shape plays an important role in determining the nature of the orientational ordering at high packing fraction. Cylindrical particles show substantial tetratic correlations over a range of aspect ratios where spherocylinders have previously been shown [1] to undergo transitions between isotropic and nematic phases. Particles that are thinner at the ends (rolling pins or bails) show nematic ordering over the same range of aspect ratios, with a well-established nematic phase at large aspect ratio and a defect-ridden nematic state with large-scale swirling motion at small aspect ratios. Finally, long-grain, basmati rice, whose geometry is intermediate between the two shapes above, shows phases with strong indications of smectic order.
pacs:
61.30.Eb,45.70.-n1 Introduction
Our experiments study the orientational ordering of horizontal, quasi-two-dimensional assemblies of millimeter-sized, elongated particles driven into motion by external vibration in the vertical direction. Since the particles we study are rod-like and do not deform appreciably, the natural point of comparison is the phase behaviour of thermal equilibrium hard-rod systems in two dimensions. The experiments address some basic questions on how systems in driven, nonequilibrium steady states differ in their phase behaviour and dynamics from similar systems at thermal equilibrium: Can the nonequilibrium phase diagram be rationalized by a comparison to hard-rod Monte Carlo simulations [1] alone or must we invoke new physics? In thermal equilibrium, the ordering of hard-rod liquid crystals is determined solely by geometrical considerations of packing, which should apply equally in the molecular and macroscopic realms. On the other hand, thermal fluctuations are of no importance in the systems we report in this article, and all exploration of phase space is made possible only by means of external driving forces.
The nonthermal nature of the system has several implications: well-established extremal principles involving free energy and entropy cannot be invoked, the sources of fluctuation and dissipation are distinct, and nonequilibrium fluctuations may either help or hinder certain kinds of order. ‘Moving XY models’ of flocking [2, 3], for instance, have been shown to display true long-range order in two dimensions, unlike their equilibrium counterparts. Nonequilibrium steady states with strictly nematic order [4] are predicted to have anomalously large density fluctuations, and velocity autocorrelations that decay much slower than in corresponding thermal systems. There are also a number of papers [5, 6, 7, 8] on the dynamics of orientable systems that are motivated by the biologically important motor-microtubule system. These systems support a variety of nonequilibrium structures, in particular, rotating vortices, which have no equilibrium analogue. While the particles in these systems are polar in nature and therefore not directly comparable to our particles, they do show the possibilities of qualitatively new phases and defect behaviours in systems of self-driven orientable particles [9, 10].
In the context of nonthermal systems like granular media, Edwards and coworkers have taken an entirely different theoretical approach: they propose a statistical mechanics for granular systems by constructing an ensemble that includes with equal probability all mechanically stable realizations of a system. The phase behaviour of a system of anisotropic grains has been considered [11] within this framework. The theory predicts, remarkably, that elongated particles do not undergo an isotropic-to-nematic transition as a function of density.
There have also been some recent experiments and simulations on the packing of anisotropic granular particles under gravity. Monte Carlo [12] simulations of ellipses falling in 2-dimensions found that they tend to orient with their long axes perpendicular to gravity. Quasi-2D experiments and simulations [13] on cylinders showed similar results, with nematic ordering extending over two particle lengths. Villarruel et al. [14] studied the compaction of rods in 3-dimensions: rods were poured into a cylindrical container and compacted by ’tapping’ i.e. applying isolated vertical jolts. While quantitative measures of orientational order were not presented, it was observed that repeated tapping caused the rods to orient vertically, first at the walls and then in bulk, into smectic-like layers. Blair et al. [15] have studied vibrated systems of rods, contained in circular and annular geometries. At high packing fractions, the rods separated into regions where they are stacked horizontally, and regions in which rods came out of the horizontal plane and are only slightly tipped from the vertical; in the latter regions, vortices formed, rotating in a direction governed by the tilt of the rods. A phenomenological explanation for the formation and motions of the vortices was proposed in Ref. [16]. Although we do report on nonequilibrium dynamical effects such as these, our major preoccupation here is with static orientational ordering. Also, the role of gravity in our experiments is to be distinguished from those reported in Refs. [12, 13, 14]: while gravity is very important in the kinematics of the particle motion it does not play the role of an ordering field as in [12, 13, 14]. The ordering in our system arises purely from interparticle interactions. Measurements of the isotropic-nematic transition in a quasi-2D system of vibrated rods have also been reported by [17]. The focus in that paper is on understanding the long-wavelength distortions of the director in terms of competition between wall alignment and bulk elasticity.Experiments very similar in intent to ours have been performed by Fraden and coworkers [18].
While there are no firmly-founded theoretical predictions to guide the effort of charting out a nonequilibrium phase diagram for elongated particles, simulations of hard rods in equilibrium provide a valuable point of reference. Frenkel and others [1, 19] have performed Monte Carlo simulations in two dimensions, on spherocylinders of length and diameter . They find that nematic phases do not form for particle aspect ratio . Instead, they identify an isotropic phase at low number densities and a layered solid at high densities. For particles with a nematic phase intervenes at intermediate area fractions. In a grand canonical Monte Carlo study in two dimensions, Khandkar and Barma [20] confirm the quasi-long-range nature of nematic ordering in the “needle” (i.e., ) limit, and demonstrate that imposed gradients in the chemical potential suppress director fluctuations. A recent Monte Carlo simulation [21] studies the ordering of rectangles with and finds a transition from isotropic to tetratic order. In an earlier work, Veerman et al. [22] report the occurrence of a cubatic phase in a system of truncated spheres and more recently Borukhov et al. [23] find cubatics in linker-filament models for the cytoskeleton. While we are able to make a detailed comparison to these equilibrium simulations, due to the macroscopic nature of the particles we are also able to explore a new axis in the study of hard-rod systems: we can make essentially arbitrary variations in the shape of the particles by selectively etching cylindrical rods. We find a surprising dependence on the precise shape of the particle – objects with similar aspect ratios but dissimilar shapes order differently. It is not possible to determine on the basis of our work alone whether this shape-sensitivity is a nonequilibrium effect, however, we hope to stimulate more detailed investigations of these effects in hard-particle simulations.
Following this introductory section is an experimental section, 2 in which we describe the particles used in our study, the geometry of the cell, and the driving mechanism. The system is visualized by real-space images; the acquisition and analysis of the images is also outlined. A detailed description of our results is in section 3, but we summarize these briefly here: Strictly cylindrical particles show substantial tetratic (that is, four-fold orientational) correlations at both small () and large () aspect ratio. The length scale of the correlations increases as the number density is increased; however, we do not see long-range order (LRO) over the range of area fractions and vibration amplitudes we explore. Particles that are thinner at their tips (“rolling pins” or “bails”, see figure 1) show nematic ordering at high area fractions in the same range of aspect ratios. For shorter particles () we obtain a defect-ridden nematic state with large- scale swirling motion at the number densities we study in our experiment. For , we find at high densities, a phase with at least quasi-long-range nematic order (QLRO), that is, power-law decay of nematic correlations. We can induce transitions out of this nematic phase either by lowering number density or by increasing the intensity of the driving. Finally, long-grain, basmati rice, with an aspect ratio of , shows phases with strong indications of smectic order. We comment on this below in section 3.3. We also find intriguing dynamical phenomena, with clear signatures of nonequilibrium behaviour, as discussed at the end of section 3.
2 Experimental setup and procedure
Our experiments involve vertically shaking a horizontal layer of rod-like particles. The rods were confined to a single layer between an aluminium substrate and a lid that fit over the particles leaving them only a little vertical room to move in. In this section we describe the particles, the geometry of the experimental cell, the driving mechanism and, finally, the methods of image acquisition and analysis.
2.1 Particle Dimensions
| Aspect Ratio | Length (mm) | |
|---|---|---|
| Rice | 4.0 1.07 | 7.1 0.44 |
| Short cylinders | 4.9 0.42 | 3.7 0.11 |
| Short rolling pins | 5.2 0.59 | 4.6 0.16 |
| Long cylinders | 12.6 0.66 | 9.9 0.12 |
| Long rolling pins | 10.4 1.45 | 9.2 0.39 |
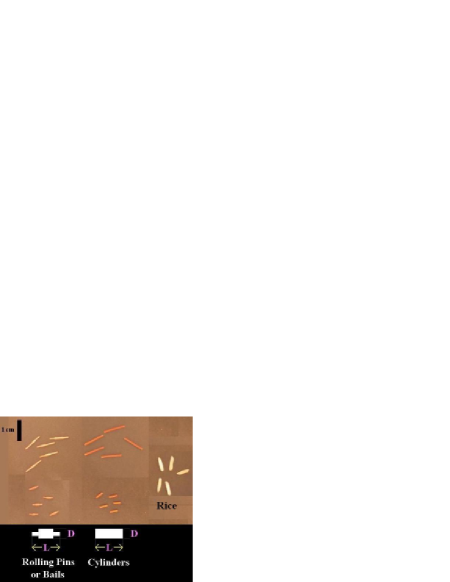
We used five different kinds of particles in the experiment. Figure 1 shows images of a few of each. The particles labelled “cylinders” are cut from a length of enamelled copper wire. The process of cutting introduces only a small degree of polydispersity (less than 5%) in the length of the cylinders. The particles labelled “rolling pins” (or “bails” [24]) are produced by etching the tips of the cylinders in ferric chloride solution. Since there are variations in the local etch rate, and in the exact length of rod that is exposed to the etchant, the degree of polydispersity in the bails is somewhat greater. The rice was used as purchased. Table 1 summarises the dimensions of the particles used in the experiment.
2.2 Geometry of the Cell
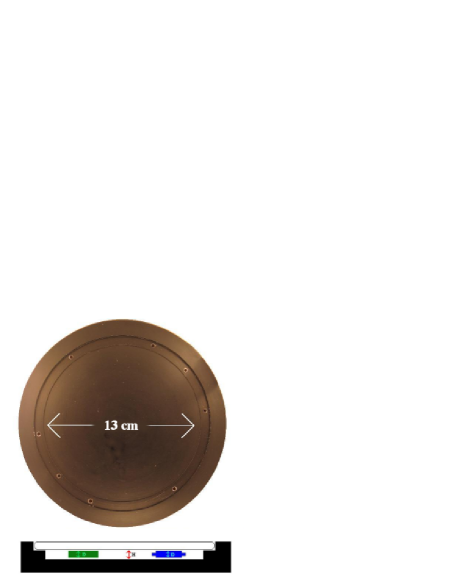
The particles were confined in a shallow circular geometry with a 13 cm diameter, as shown in figure 2. Whenever necessary, it was possible to further confine the particles to a square region inscribed within the diameter of the cell. The base of the cell is made of aluminium, anodized black to enhance optical contrast with the particles. The top of the cylinder is made of perspex, and is placed so as to leave a vertical space mm above the base. Since the particles have a diameter mm, this gives them about 25% of their thickness to explore in the vertical direction. Thus particles cannot pass over one another by moving out of plane. The vertical degree of motion allows the planar projection of the particles to overlap a little when they are being shaken; the horizontal component of the distance of closest possible approach of two particles is slightly less than . Thus, the vertical clearance can be seen as a parameter that tunes the particle interaction potential from hard- core repulsion () when the motion is strictly 2-dimensional, to slightly softened repulsion for . The shaking amplitude can then be seen as playing the role of temperature.
Another important feature of the cell is the boundary condition presented to the particles at the edge of the system. When the boundary is smooth, particles tend to lie parallel to the boundary. This occurs both when the boundary is a square or a circle since in the latter case the radius of curvature is much larger than the particle length. The parallel alignment is a consequence of dynamical stability: when a rod aligned with the wall collides with it at one end and rotates out of alignment, then the next wall-collision will be with the other end of the rod, which will tend to restore the alignment. No restoring torque of this nature exists for perpendicular alignment with the wall. In some situations, we induce perpendicular alignment by gluing a layer of rods normal to the wall. The tips of particles perpendicular to the wall tend to get trapped in the interstices between the tips of the glued particles. We found this procedure to be effective only for the bails, and not for the cylinders.
2.3 Excitation Mechanism
The cells were filled with particles to a known area fraction and then mounted on a permanent magnet shaker (LDS 406). For most of the experiments described here, the cell was shaken at a frequency and an amplitude resulting in a fixed peak acceleration, as measured by an accelerometer (PCB Piezotronics 352B02), of where is the acceleration due to gravity. The corresponding amplitude typically used was mm = , smaller than the clearance of between the top of the particle and the lid. However, the characteristic velocity of the plate () is sufficient to launch particles to a height of . In one instance we varied the acceleration between 5g and 8g to observe the effect it had on the degree of ordering.
2.4 Image acquisition and analysis
Dynamical features of the steady states were imaged with a high-speed video camera, however, for the majority of the results reported in this article, our primary interest was the instantaneous configurations of the particles. These were imaged using a consumer digital camera (Canon PowerShot G5) placed above the cell. Images were taken at a resolution of 2592 1944 pixels, at time intervals of approximately 15 secs. This interval was long enough for significant rearrangements of the particles to have taken place, and hence for each image to be a statistically independent sampling of the steady state arrangement of the particles. In the rest of this article, we will discuss data extracted from images that were taken while the sample was being continuously agitated by the shaker. Images taken by halting the drive (as was done in [18]) showed qualitatively similar behaviour but with noticeably greater disorder in the particle arrangement.
The images were analyzed within the ImageJ [26] analysis software. The images were subjected to a bandpass filter to remove pixel noise and long-wavelength variations in illumination, and then thresholded before identifying the centre of mass and orientation of each particle. The error in assigning the coordinates was about 0.5D (it was possible to reduce this error to 0.2D for the short cylinders) and the error in assigning the angles was less than . Figure 3 has bars indicating the centres of mass and orientation of the particles superimposed on the image. Typically 97% of the particles were successfully identified, the remaining particles being difficult to resolve as independent objects because of the high packing density, and the consequent lack of intensity gradient between particles. The other objects identified are mainly particle pairs; we are able to determine the position and orientation of some, but not all, by using information on the minor and major axes of the composite object. However, due to the relatively small number of such instances, they did not affect the results we report here.
3 Results
This section is organized in the following manner: the first half will be devoted to results obtained using the cylinders and the latter half to those with the rolling pins.
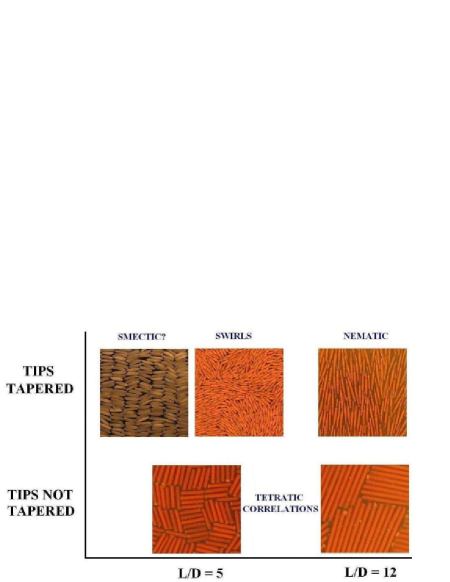
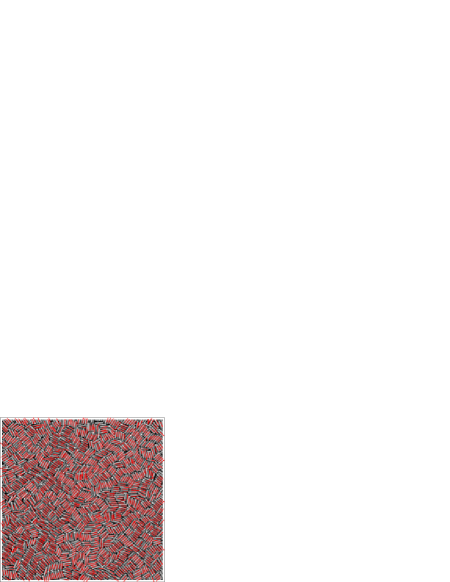
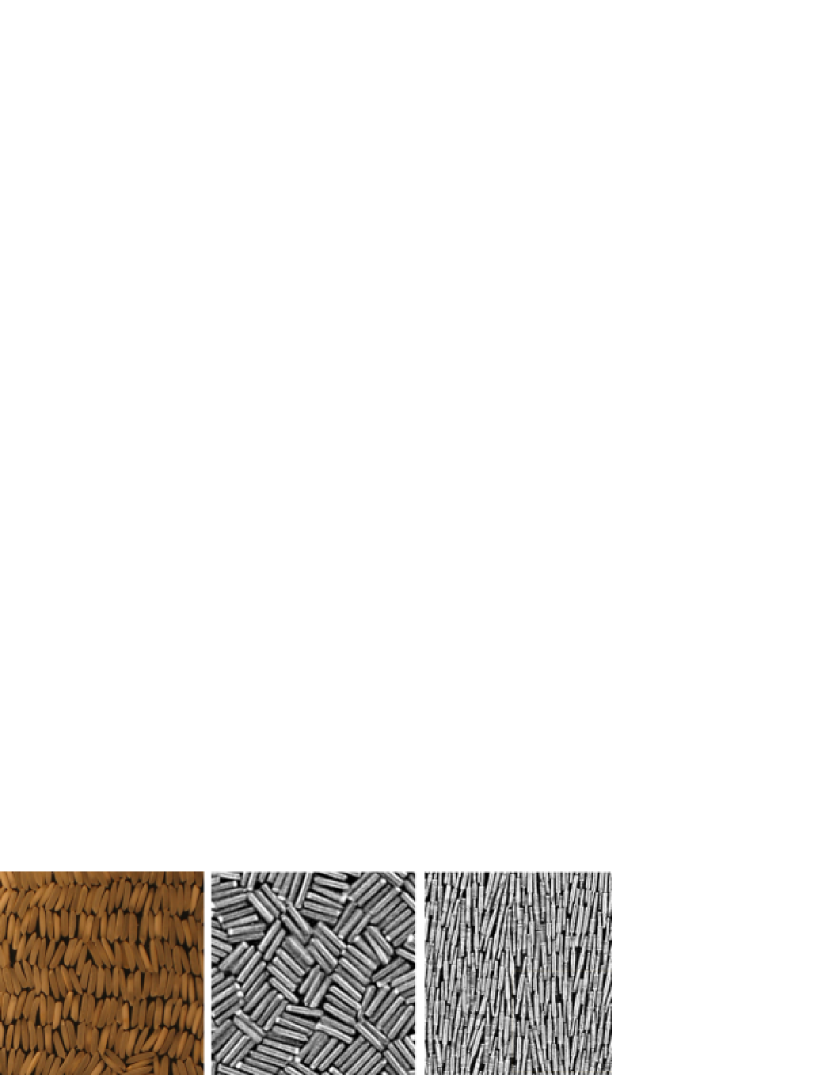
Figure 5 shows the region of phase space explored and gives us an overview of the results. The cylinders, irrespective of aspect ratio, displayed strong four-fold orientational, i.e., tetratic, correlations. Studies of the area-fraction-dependence of these correlations, presented in subsection 3.1, were done using the shorter rods: since the system size measured in terms of particle length was greater for the short particles, they were less sensitive to the nature of the boundary and offered better statistics. We observed short-ranged tetratic order, but with large correlation lengths. The high aspect ratio rolling pins formed nematic phases with quasi-long-range order with power-law decay of orientational correlations. The low aspect ratio rolling pins formed swirly states which we discuss in subsection 3.4.2. Common to both nematic and tetratic states, was the tendency to rotate globally and persistently in one direction, presumably in response to some asymmetry in the boundaries of the system. This distinguishes this phenomenon from that observed by [25] who also observe globally rotating phases, only the particles forming their phase are, unlike ours, intrinsically chiral. We discuss this in subsection 3.4.1. We also observed striped, smectic-like phases in experiments using rice grains. Interestingly, we have not been able to observe the stripes using bails or cylinders with the same aspect ratio as the rice.
3.1 Towards the tetratic phase
Over the range of concentration and other parameters explored, the strictly cylindrical particles (i.e., flat headed, neither tapered like the “bails” that showed nematic order, nor spherically capped like the spherocylinders widely studied in simulations) did not form ordered phases. However, their isotropic phase showed tetratic, that is, four-fold orientational, short-range order unaccompanied by nematic correlations. The range of tetratic correlations increased substantially with increasing area fraction. The correlation function evaluated was , where is the orientation of the rods with respect to some arbitrary, pre-selected axis. and are particle indices that run from 1 to the number of particles, N. The angular brackets are a time average, over pairs of particles separated by a distance . For each pair, we calculate as a function of and which are, respectively, the components of the separation vector between the rod centres perpendicular and parallel to the cylinders’ long axes. and are distinct for each particle in a given pair, they have to be evaluated for each particle, rather than each particle pair, as would have been sufficient if was evaluated as a function of the scalar distance, .
Both long () and short () cylinders showed tetratic correlations as shown in figure 6. The range of tetratic order is shorter (when distance is scaled by cylinder length) for the long cylinders, however, even a correlation length , as found for the long cylinders, indicates substantial tetratic ordering with clearly identifiable four-fold motifs as seen in Fig.5. When the experiments were performed in a square, rather than a circular frame, one might have expected four-fold orientational order to be in general enhanced, since alignment parallel to the walls is (see section 1) favoured by the mechanics of collisions with the wall. We find that this is true for both long and short cylinders but not at all for the bails.
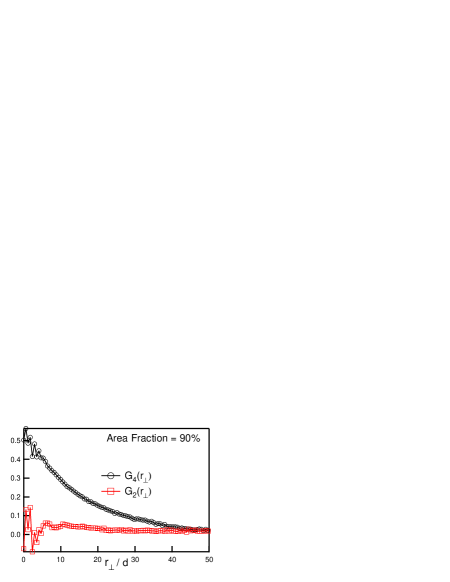
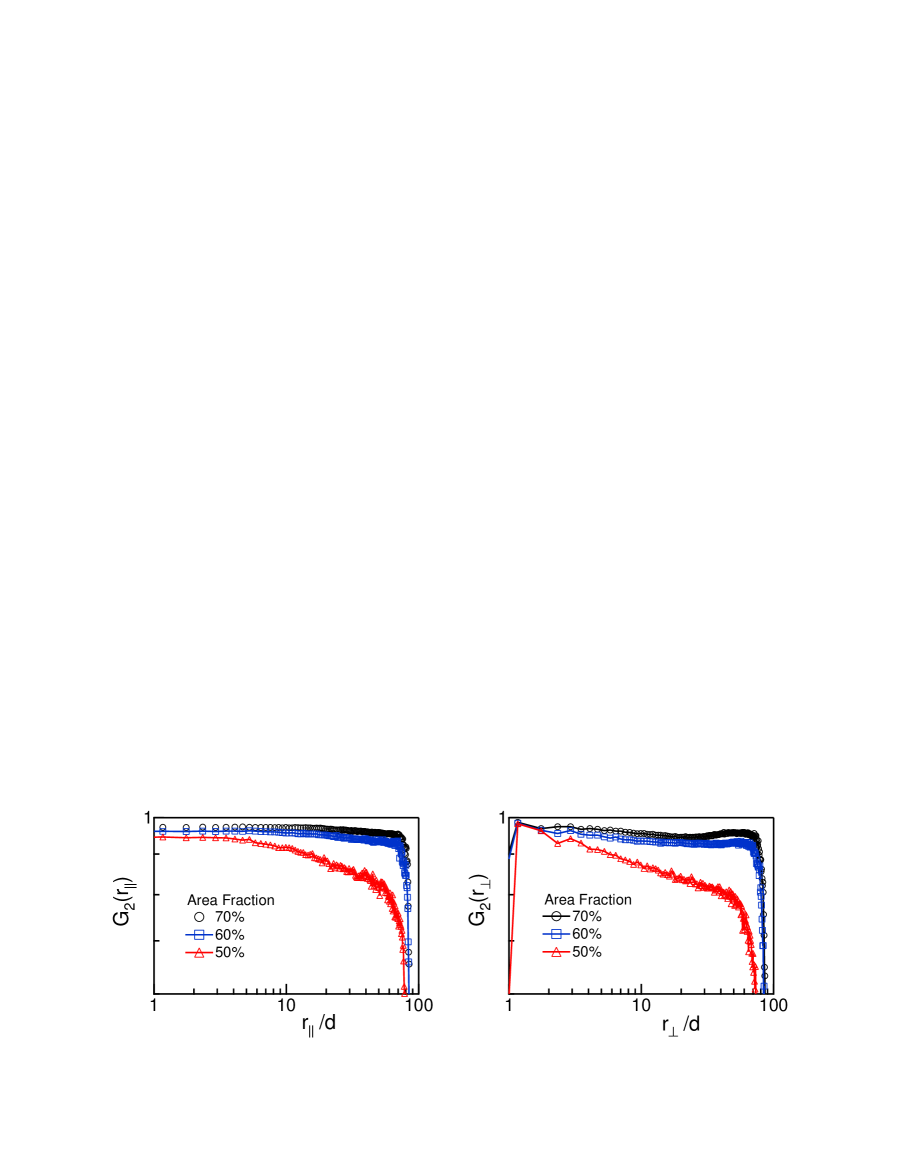
To distinguish between tetratic and nematic ordering, we have plotted for the short cylinders at area fraction 90% , and in Fig. 7; here quantifies the extent of nematic ordering. clearly dominates, and nematic correlations are negligible. This confirms what is apparent from the real space image of the tetratic phase, figure 4. We are thus seeing true four-fold correlations, not angular harmonics of 2-fold correlations.
We now present the dependence of the range of tetratic correlations on area fraction for the short cylinders (). Fig. 8 shows as a function of and for various area fractions. The range of tetratic correlations increases monotonically with area fraction, as shown in Fig. 9 which displays the correlation length, , extracted from Fig. 8. obtained from and show the same qualitative behaviour, but are slightly different in magnitude.
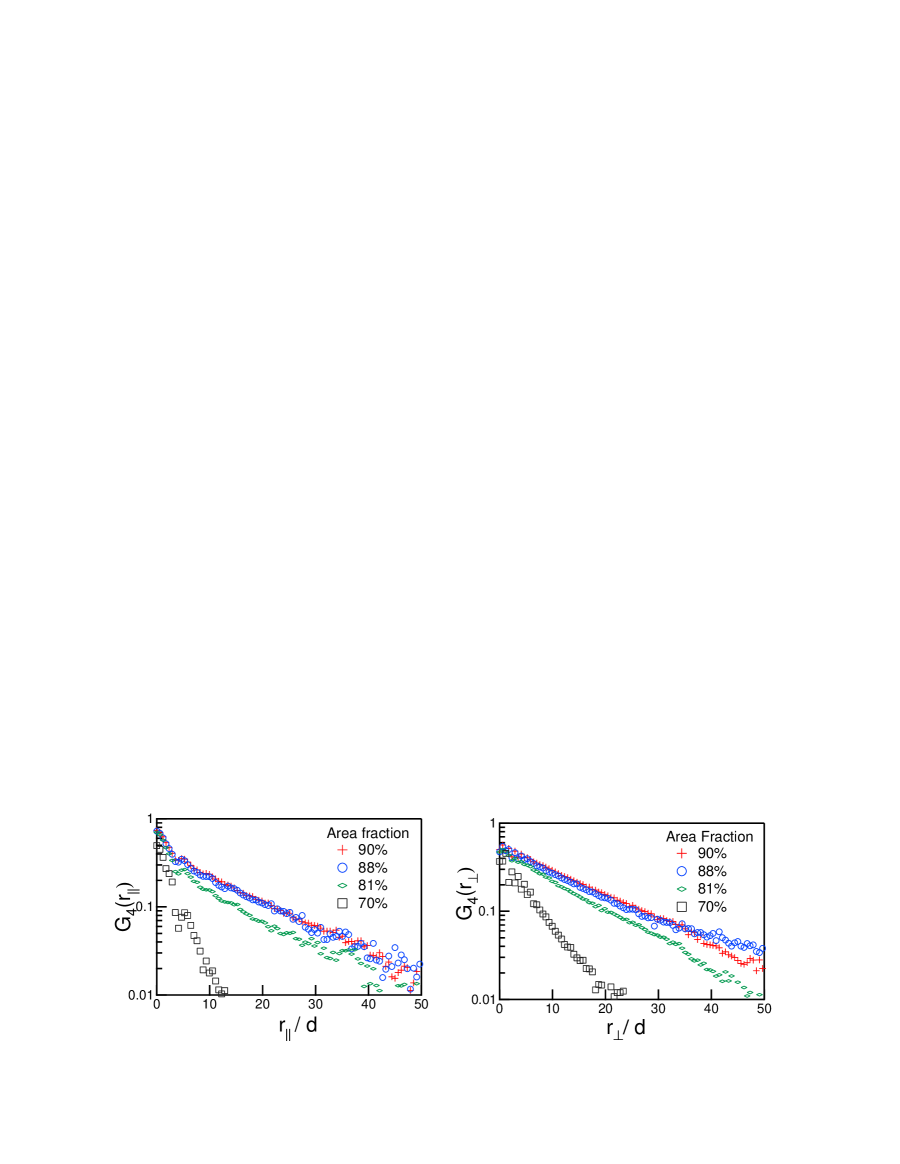
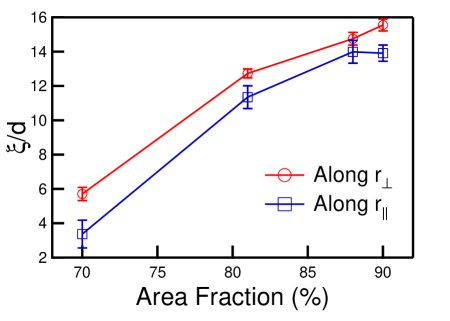
The correlation lengths are substantial at high area fractions, indicating a high tetratic susceptibility, and the likelihood that a quasi-long-ranged tetratic phase lurks nearby in parameter space. However, it remains to be determined which parameter – area fraction, confinement thickness, vibration amplitude or frequency – will most easily take the system across this conjectured isotropic-tetratic phase boundary. We reiterate that the tetratic ordering is a strong function of particle shape; by way of comparison, the equilibrium phase diagram of [1] for discorectangles at similar aspect ratios shows no tendency to tetratic order. They find isotropic, nematic, and crystalline phases, none of which we see with rectangles. This difference could be a nonequilibrium effect rather than a shape effect, however as we will see in section 3.2, tapered particles order differently. Also, Monte Carlo simulations of rectangles [21] at much smaller aspect ratio, , reveal a true tetratic phase. While it is not clear at all whether this equilibrium phase will survive to the large regime, we hope that our results will stimulate equilibrium simulations of this region of parameter space.
3.2 The nematic phase
Why do cylinders not show nematic order even when they are extremely long? Nematic order is typically investigated in simulations using spherocylinders, discorectangles or ellipsoids, all of which have narrower tips than waists and can thus interdigitate, promoting uniaxial alignment. This indicates that the rod tips needed to be tapered to obtain a nematic phase. We therefore used the particles labelled “bails” in figure 1, with aspect ratio , since equilibrium Monte Carlo studies tell us that is needed to produce a two-dimensional nematic.
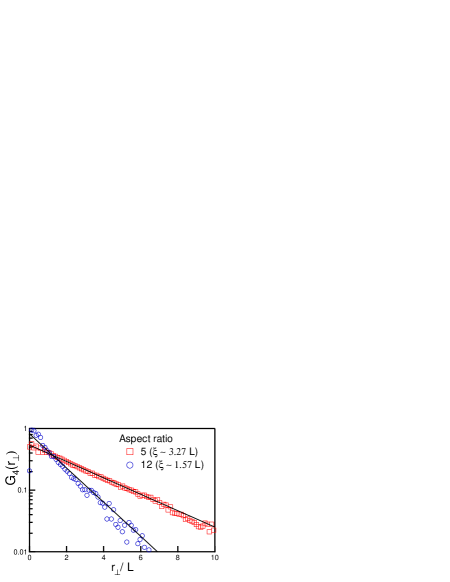
As is evident from the real space images (Fig. 4) the long bails do indeed show nematic correlations. The tendency to nematic order is quantified in Fig. 10 which shows as a function of and for 3 different area fractions . Here . The symbols are the same as defined in section 3.1. The system shows a high degree of order at each of these area fractions. The decay of was consistent with a power-law for all three values of , although the decay exponents (listed in Table 2) were exceedingly small for the two higher values of .
| Area Fraction | ||||
|---|---|---|---|---|
| 50% | 69 | 64 | - | - |
| 60% | - | - | 0.0113 4e-4 | 0.0182 8e-4 |
| 70% | - | - | 0.0066 3e-4 | 0.0140 5e-4 |
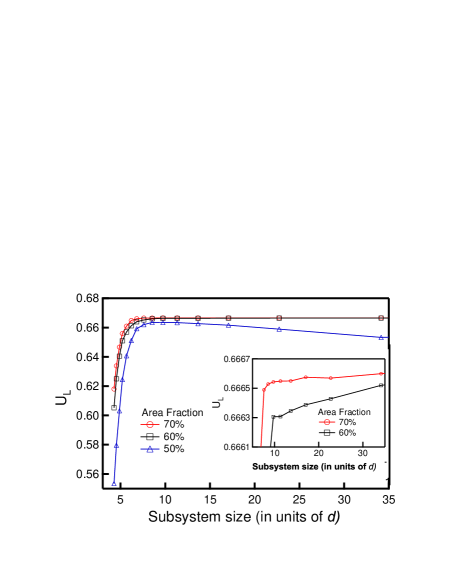
Given the small system sizes in our experiment, we expect strong finite size effects. In order to assess more precisely whether the correlations were long-ranged, power-law, or short-ranged with very long correlation lengths, we performed a subsystem analysis of the cumulants following [27]. The quantities evaluated were , where is the order parameter (, where runs over the number of particles within the subsystem defined by ) and is the linear size of the subsystem over which was evaluated, and . The Binder reduced cumulant, was then evaluated. The results are plotted as a function of area fraction, , for different subsystem sizes in figure 11.
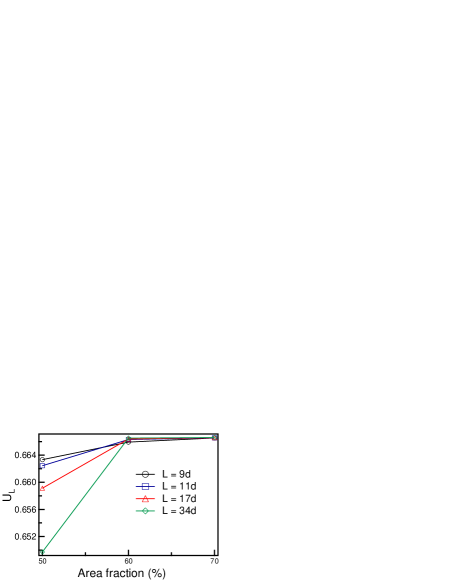
As shown in [27], for phases with LRO the curves for different system sizes will cross at a certain value of area fraction . If there is QLRO, the curves of vs for different should collapse onto a single line over an extended range of values of . The lower limit of this value will be , the isotropic-nematic transition value. Figure 11 suggests that the phases formed at the higher area fractions do show QLRO and the isotropic- nematic transition occurs at an area fraction somewhere between 50% and 60%. In Fig.12 we show the Binder cumulant as a function of subsystem sizes , for different area fractions, . The downturn at large for indicates short-range order. We show a greatly magnified version of this plot for the two higher area fractions as an inset. for 70% is slightly but systematically larger than that for 60%. This difference is at the edge of our resolution, but it leaves open the tempting possibility that these nonequilibrium nematics have true, rather than quasi- long-range order. Further measurements on large systems are required to settle this important question of principle.
3.2.1 Varying amplitude of oscillation
The presence of a third dimension into which the particle is lofted means that the 2-dimensional projections of the particles can overlap and that unlike hard particles, a temperature variable could be relevant to the order. As we said in subsection 2.2, the shaking amplitude could act as a kind of temperature. A natural dimensionless measure of how strongly the system is being shaken is , where and are, respectively, the oscillation frequency and the acceleration due to gravity. We studied the effect on the nematic order of changing acceleration while holding fixed the gap height, and particle diameter, ; changing these would have changed the inter-penetrability of the particles in two dimensions.
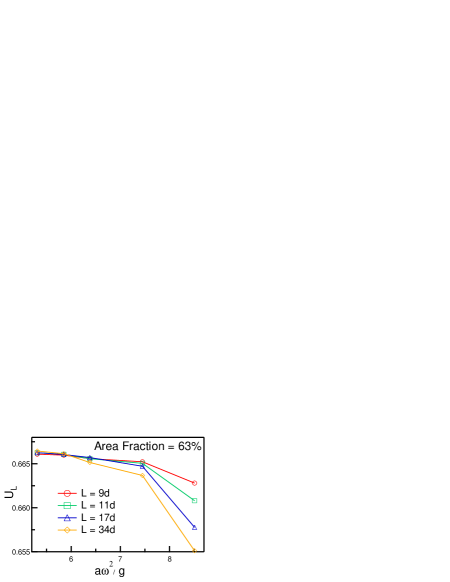
Figure 13 shows the Binder reduced cumulant of the phase as a function of dimensionless acceleration. The area fraction of the phase is about 63%, within the nematic regime identified in Fig.12. The acceleration is varied by holding the frequency, , fixed and varying the amplitude, . Even though over the entire range of amplitudes, the higher shaking amplitudes do affect the extent of order in the system. This is not entirely surprising: while is small, the ratio of the characteristic kinetic energy and the maximum possible potential energy varies from to over the range of the plot. However, as can be seen by the small range of vertical axis, the degree to which the phase disorders by increasing from 5 to 8 is much less than that achieved by reducing the area fraction from 70% to 50% .
3.3 Two-dimensional smectic order?
Our observations on basmati rice gave images with strong indications of striped, i.e., smectic order (see Fig. 4). In two-dimensional systems at thermal equilibrium, we know that thermal fluctuations render smectic order strictly short-ranged, while in three-dimensional systems it is quasi-long-ranged. These conclusions are based on derivations of the variance of layer displacement fluctuations from an elastic free-energy functional, in which, as a consequence of rotation-invariance, the cost of layer displacements with wavevector parallel to the layers varies as . Since the systems we are studying are driven, not thermal equilibrium, these arguments do not apply a priori, and the possibility of quasi-long-range (or, for that matter, true long-range) smectic order in our vibrated granular- rod monolayers remains open. We are studying this possibility theoretically [28]. Experimentally, however, our systems are not large enough for the type of analysis (see, e.g., [29, 30]) required to check whether the images we are seeing are true smectics, weakly ordered two-dimensional crystals, or smectics disordered by the presence a finite but small density of free dislocations (which would be nematics on large length scales).
3.4 Dynamical nonequilibrium phenomena
3.4.1 Collective, coherent rotation
All the phases showed a marked tendency to rotate globally. For the nematic phases, the square frame prevented them from rotating (except in certain cases, which we shall come to in the next paragraph), but we could not prevent the tetratic phase from rotating, in part because we did not use a square frame, since we wanted to see how strong the tetratic correlations were in the absence of such externally imposed four-fold alignment.
Since this is a nonequilibrium system, any stray chirality in the system, even at the boundary, should result [31] in macroscopic circulation. The observed global rotation is thus a signature of the driven nature of the system. A thermal equilibrium system, no matter how chirally asymmetric, would not display persistent currents. Our observed rotation rates were of the order of a degree in cycles of oscillation. In one instance, when we were using the bails in the square boundary (where, under normal circumstances, the rotations are curbed), the phase began rotating fast, turning through a degree in cycles of oscillation. The source of the asymmetry appeared to be a slight misalignment of the particles fixed at the boundary, because we were able to stop the rotation by aligning them more carefully. That this minor imperfection in boundary alignment could have such a strong effect was a surprise, and means the rotation phenomenon merits more serious investigation.
3.4.2 Swirls
Since basmati rice (aspect ratio ) showed smectic tendencies, we studied tapered copper rods with similar aspect ratio (aspect ratio ) but half the length of the rice grains, in the hope of getting a larger number of smectic layers in the sample cell. Unexpectedly, we found no sign of smectic layering. Instead, a very dynamic pattern of swirls appeared, reminiscent of bacterial swimming patterns [32]. The swirly state looks like a defect- ridden nematic, which is curious because equilibrium Monte Carlo studies on rods in two dimensions suggest that nematics should not form for aspect ratios less than 7. These swirls, which are strength disclinations, differ from those seen in [15]: the latter are strength 1, they have a core that looks like a crystalline packing of standing rods, and each defect is chiral because the rods have a systematic tilt in the direction of their tangential velocity orientation of the rods in the region outside the core. In our case, the circulation appears to be a result of the interaction between defects. It remains to be seen whether we are seeing coarsening towards a nematic, the disordering of a nematic (i.e., coarsening towards the isotropic phase), or simply a disordered, correlated, defect-turbulent steady state.
4 Conclusion and Discussion
This paper has presented an exploration of the collective properties of vibrated rods in two dimensions, focusing on orientationally ordered phases. Tapered particles lead to nematic order at large area fractions, in keeping with the thermal equilibrium Monte Carlo studies of [1], while strictly cylindrical particles, with flat tips, display strong tetratic correlations over a very broad range of aspect ratios. It remains to be established whether the strong sensitivity to particle shape is a nonequilibrium phenomenon or whether it can be reproduced in equilibrium simulations. We also observed some clearly nonequilibrium phenomena: persistent, systematic rotation of the entire phase, presumably as a result of stray chirality in the system, and also a rich pattern of circulating disclinations of strength 1/2. Detailed quantitative analyses of the dynamics of the swirls, of tagged-particle motion and time-dependent correlations of collective modes and other nonequilibrium effects will appear in a separate paper [28].
5 Acknowledgements
We thank P.R. Nott and V. Kumaran, Dept. of Chemical Engineering, IISc, and A.K. Raychaudhuri, Dept of Physics, IISc, for generously letting us use their experimental facilities. We thank S. Fraden for detailed and helpful comments and for sharing his unpublished results with us. We thank M. Barma, M. Khandkar, and D. Dhar for very valuable discussions. VN thanks Sohini Kar for help with some of the experiments. The work at UMass Amherst was supported by funds from NSF-DMR 0305396. The Centre for Condensed Matter Theory is supported by the Department of Science and Technology, India. VN and NM thank, respectively, the Department of Physics, University of Massachusetts, Amherst and the Department of Physics, Indian Institute of Science, for support and hospitality while part of this work was done. VN thanks the Council for Scientific and Industrial Research, India and the Indian Institute of Science for providing travel aid.
6 References
References
- [1] M.A. Bates and D. Frenkel, J. Chem. Phys. 112, 10034 (2000)
-
[2]
T. Vicsek, Phys. Rev. Lett. 75, 1226 (1995)
A. Czirok, H.E. Stanley and T. Vicsek, J. Phys A 30, 1375 (1990)
T. Vicsek, A. Czirok, E. Ben-Jacob, I. Cohen and O. Shochet, Phys. Rev. Lett. 75, 1226 (1995) -
[3]
J. Toner and Y. Tu, Phys. Rev. Lett. 75, 4326 (1995)
Y. Tu, M. Ulm and J. Toner, Phys. Rev. Lett. 80, 4819 (1998)
J. Toner and Y. Tu, Phys. Rev. E 58, 4828 (1998) - [4] S. Ramaswamy, R.A. Simha and J. Toner, Europhys. Lett. 62 (2) 196 (2003)
- [5] H. Y. Lee and M. Kardar, Phys. Rev. E 64, 056113 (2001)
-
[6]
B. Liverpool and M. C. Marchetti, Phys. Rev. Lett. 90, 138102
(2003)
http://arxiv.org/abs/cond-mat/0406276 - [7] S. Sankararaman, G. I. Menon and P. B. Sunil Kumar, Phys. Rev. E 70, 031905 (2004)
- [8] I. S. Aranson and L. S. Tsimring, Phys. Rev. E 71, 050901 (2005)
- [9] J. Toner, Y. Tu and S. Ramaswamy, Ann. Phys. 318, 170 (2005)
- [10] I. S. Aranson and L. S. Tsimring, http://arxiv.org/abs/cond-mat/0507419
- [11] C.C. Mounfield and S.F. Edwards, Physica A 210, 279 (1994)
- [12] B.K. Buchalter and R. Mark Bradley, Phys. Rev. A 46, 3046 (1992)
- [13] K. Stokely, A. Diacou and S.V. Franklin, Phys. Rev. E 67, 051302 (2003)
- [14] F.X. Villarruel, B.E. Lauderdale, D.M. Mueth and H.M. Jaeger, Phys. Rev. E 61, 6914 (2000)
- [15] D.L. Blair, T. Neicu and A. Kudrolli, Phys. Rev. E 67, 031303 (2003)
- [16] I.S. Aranson and L.S. Tsimring, Phys. Rev. E 67, 021305 (2003).
- [17] http://arxiv.org/abs/cond-mat/0508202
- [18] S. Fraden, private communication. These experiments were done with cylindrical particles in a 2-dimensional cell in a horizontal plane. The agitation was provided by repeated tapping in the plane of the cell, rather than by continuous vibration transverse to the cell as in our experiment.
- [19] M.C. Lagomarsino, M. Dogterom and M. Dijkstra, J. Chem. Phys. 119, 3535 (2003)
- [20] M. Khandkar and M. Barma, http://arxiv.org/abs/cond-mat/0502200 (Phys. Rev. E to appear)
- [21] A. Donev, J. Burton, F.H. Stillinger and S. Torquato, http://arxiv.org/abs/cond-mat/0508550
- [22] J. A. C. Veerman and D. Frenkel, Phys. Rev. A 45, 5632-5648 (1992)
- [23] I. Borukhov, R.F. Bruinsma, W.M.Gelbart and A.J. Liu, PNAS 102, 3673-3678 (2005)
- [24] The particles we call “bails” resemble a piece of cricket equipment of the same name.
- [25] J.-C. Tsai, Fangfu Ye, Juan Rodriguez, J. P. Gollub and T. C. Lubensky, Phys. Rev. Lett. 94, 214301 (2005)
- [26] http://rsb.info.nih.gov/ij/
- [27] H. Weber, D. Marx and K. Binder, Phys. Rev. B. 51, 14636 (1995)
- [28] V. Narayan, N. Menon and S. Ramaswamy, unpublished.
- [29] A. Caillé, C.R. Acad. Sci. Ser. B 274, 891 (1972)
- [30] C. R. Safinya, D. Roux, G. S. Smith, S. K. Sinha, P. Dimon, N. A. Clark and A. M. Bellocq, Phys. Rev. Lett. 57, 2718 (1986)
- [31] P. Curie, J. Phys. (Paris) 3 Serie (theorique et applique) t. III, 393 (1894).
- [32] C. Dombrowski, L. Cisneros, S. Chatkaew, R. Goldstein and J.O. Kessler, Phys. Rev. Lett. 93, 098103 (2004)