Persistence of Strong Electron Coupling to a Narrow Boson Spectrum in Overdoped Bi2Sr2CaCu2O8+δ Tunneling Data
Abstract
A d-wave, Eliashberg analysis of break junction and STM tunneling spectra on Bi2Sr2CaCu2O8+δ (Bi2212) reveals that the spectral dip feature is directly linked to strong electronic coupling to a narrow boson spectrum, evidenced by a large peak in . The tunneling dip feature remains robust in the overdoped regime of Bi2212 with bulk Tc values of 56 K-62 K. This is contrary to recent optical conductivity measurements of the self-energy that suggest the narrow boson spectrum disappears in overdoped Bi2212 and therefore cannot be essential for the pairing mechanism. The discrepancy is resolved by considering the way each technique probes the electron self-energy, in particular, the unique sensitivity of tunneling to the off-diagonal or pairing part of the self-energy.
pacs:
74.45.+c, 73.40.GkRecently, an important consensus has been reached among various spectroscopies which probe electron interactions in high Tc superconductors (HTS). For nearly optimal doped Bi2Sr2CaCu2O8+δ (Bi2212), tunneling1 ; 2 , angle-resolved photoemission (ARPES)3 ; 4 ; 5 and the Drude part of the optical conductivity6 ; 7 have all exhibited spectral evidence that the electrons which participate in superconductivity are coupled to a relatively narrow boson spectrum peaked at an energy of 35-43 meV. The nature of this boson mode[8] and its relevance to the high Tc mechanism remain under intense debate. Strong-coupling analyses of Bi2212 tunneling9 and related optical conductivity in YBa2Cu3O7 10 have shown that coupling to this mode alone is sufficient to explain high Tc superconductivity. However, in a doping-dependent optical conductivity study of Bi22127 , the mode’s importance has been downplayed since it seems to disappear into a broad background of excitations in the overdoped regime where Tc is still high, 60 K. To address this important issue we examine previously published break junction tunneling measurements on Bi2212, and some new data, that includes heavily overdoped crystals with Tc values of 56 K-62 K. A quantitative Eliashberg analysis shows that the tunneling spectral dip feature is directly linked to a relatively narrow, dominant peak in the electron-boson spectral function, . Tunneling data from different overdoped crystals show reproducibly that the dip (and therefore coupling to the mode) remains a robust feature, showing no evidence of disapppearing. This apparent contradiction with optical conductivity may be explained by considering the unique sensitivity of tunneling to the off-diagonal, or pairing part the electronic self-energy.
Each of the above electron spectroscopies reveals (within specific experimental limitations) the complex quasiparticle self-energy, a matrix which contains all information on electron interactions including, presumably, those responsible for superconductivity. In addition to the diagonal part, , a superconductor has an off-diagonal part, , due to the electron-paired condensate. Peaks in the real part of the optical self energy, , 6 ; 7 ; 10 , kinks and dips in ARPES 3 ; 4 ; 5 , and dips in tunneling conductance 1 ; 2 are all consistent with electrons coupling to a bosonic mode in HTS. The mode has been argued to be the resonance spin excitation 1 ; 2 ; 3 ; 4 ; 6 ; 7 found in neutron scattering, 11 the B1g optical phonon,5 or perhaps a magnetic polaron.6 One of the main causes of ambiguity in the interpretation of electron spectroscopies is that optimal doped Bi2212 presents a conspiracy of similar values for the energies of interest. The superconducting gap parameter, , the B1g phonon and the resonance spin excitation all have energies in the range 35 meV - 43 meV. On the other hand these quantities have distinct doping dependencies. Raman spectroscopy 12 has shown that the B1g phonon is essentially independent of hole concentration, remaining at 35 meV , whereas the resonance spin excitation is proportional to Tc.11 To extract the mode energy from any spectroscopy requires a realistic model and it is desirable that the experiment provide a direct measure of (as does tunneling) since this quantity also enters the quasiparticle self-energy and is known to have a strong doping dependence. 13
Here we present quantitative fits of published 1 ; 13 ; 14 ; 15 superconductor-insulator-superconductor (SIS) break-junction tunneling conductances and an SIN (N = normal metal) conductance obtained by scanning tunneling microscopy (STM), using a self-consistent Eliashberg theory and an electron-boson spectral function . For near optimal doped Bi2212 the resulting bears a strong resemblance to that extracted directly from ARPES data 4 thereby linking two different electron spectroscopies. Combining a new SIS tunneling conductance with published data on overdoped Bi2212 with values in the range of 17 meV - 19 meV, a robust and highly reproducible dip feature is established. This doping range corresponds to Tc 60 K, which is the value where the mode supposedly disappears in optical conductivity. A fit of the most overdoped Bi2212 SIS conductance demonstrates how changes in going from near optimal to heavily overdoped and the tunneling gives important insights into the discrepancies with optical conductivity.7
The analysis begins with a simultaneous, quantitative fit of a break junction SIS conductance1 and an SIN conductance9 obtained by STM. States-conserving normalization was accomplished by fitting the high bias conductance to a smooth polynomial as described in ref. 9 A self-consistent, d-wave Eliashberg formalism 9 was used to generate the quasiparticle density of states (DOS). Both data sets were obtained on slightly overdoped Bi2212 and thus a similar would be expected if indeed the dip feature were a strong-coupling effect. The data and fits are shown in Fig. 1 and the corresponding is shown as #1 in Fig. 3(a). The STM data set (Fig. 1 inset) was analyzed previously using the same procedure 9 but with an consisting only of a narrow, Lorentzian boson spectrum which was adjusted to best fit the data. In this analysis the #1 includes a broad, higher energy spectrum out to 160 meV in addition to the sharp mode peaked at 39 meV as suggested in both ARPES 4 and optical conductivity. 7 The DOS fit to the normalized STM data is improved by including this higher energy tail in in that the dip strength is more closely matched. The fit also captures the shoulder, or strong coupling onset feature, in the STM data, which is due to the low frequency threshold in #1 near 17 meV.
The same #1 provides a good fit of the SIS break junction conductance 1 in Fig. 1. A particular break junction was chosen which had a similar gap value as the STM data but also had a peak height to background ratio (PHB) which was not too large ( 3) for reasons which will become clear shortly. To accommodate the slight differences in values the SIS data and fit are plotted on a rescaled voltage axis which is in units of . While further fine-tuning of could be done, the fits in Fig. 1 prove sufficiently that the dip structure is reproducible among different junction types and can be treated quantitatively as a strong coupling effect. The shape and strength of the dip determines, self-consistently, the measured gap parameter, .
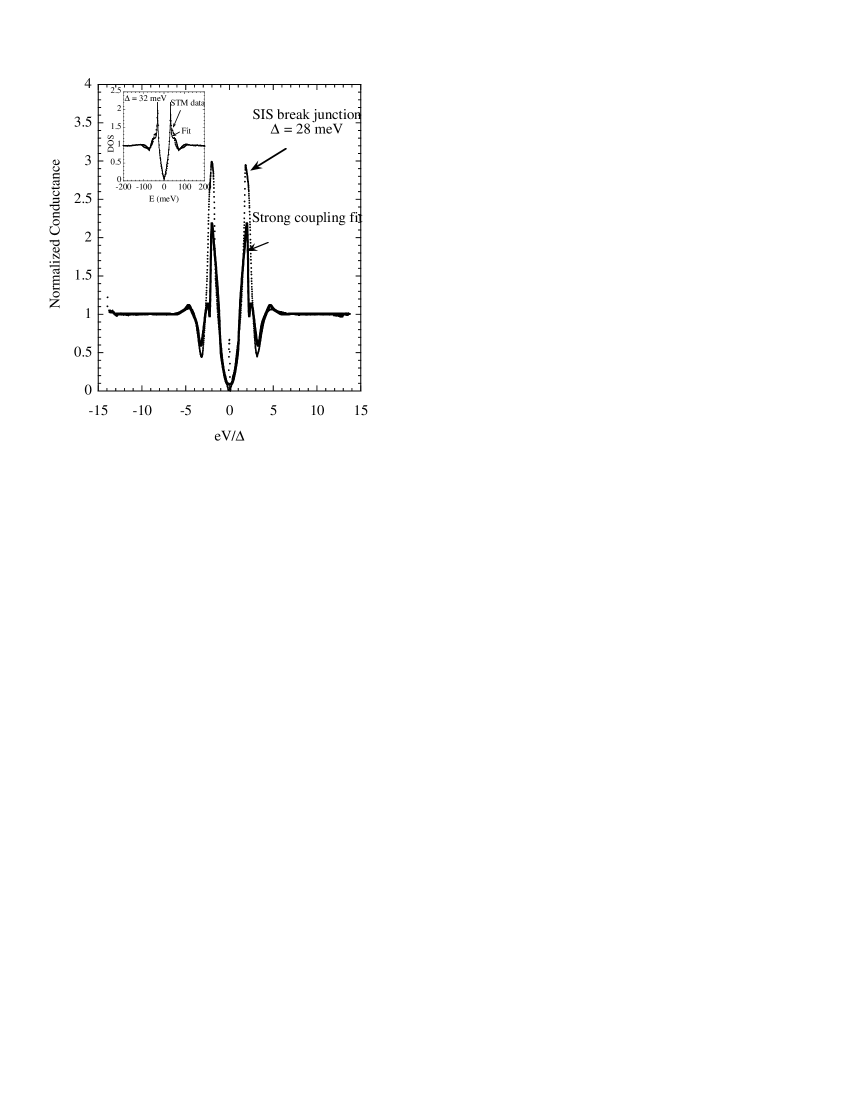
Note the enhancement in the dip strength for the SIS calculation and experiment compared to the SIN result which is due to the convolution of the two DOS in the SIS conductance.16 This points out a particular advantage of SIS tunneling for probing electron interactions, but at a cost of not knowing the particle-hole symmetry of the DOS. However, the consistency of the SIN and SIS fits of Fig. 1 suggests that the symmetric dip features of the present STM data are intrinsic to the DOS and the common observation of asymmetries in the dip strength, e.g. in point-contact SIN tunneling, 13 likely originate from some other effect. Contributions to the tunnel conductance from asymmetric pseudogaps near defects, which exhibit a broad peak at positive bias, may be the cause as discussed in ref.9 .
An obvious difference between data and theory is in the PHB ratio which is typically 2 for SIS calculations which use a d-wave DOS as in Fig. 1 inset. We have previously pointed out 1 ; 14 ; 15 that measured SIS break junctions often display much larger PHB ratios and that these most likely arise from the tunneling matrix element which favors tunneling along the (,0) momentum or the anti-node directions. In our Eliashberg model, the complex gap parameter = cos(2) where is the polar angle in momentum space.9 Preferential tunneling along the antinode (=0) will thus increase the dip strength since this is the direction of maximum amplitude of . The inclusion of a tunneling weighting factor in the calculation of the SIS conductance in Fig. 1, will increase both the PHB ratio and the dip strength which will improve the fit to the data. However, here we chose not to include this additional parameter in the SIS fit so that the bare dip strength from the Eliashberg model could be observed. It is evident from Fig. 1 that preferential tunneling is not necessary for the observation of strong dip features.
The model also shows that the energy of the dip minimum relative to the gap edge provides a good estimate of the energy of the sharp mode, , in . The STM data fit leads to = 32 meV and = 39 meV while the break junction in Fig. 1 has the values = 28 meV and = 34 meV. While the dominant feature in is the sharp boson mode, and this predominantly determines the dip strength, the inclusion of a broad, higher energy spectrum improves the fit and suggests that electron coupling to these excitations is also relevant to understanding superconductivity.
The detailed, quantitative analysis described above provides an understanding of the tunneling conductances observed in heavily overdoped Bi2212. Three normalized break junction tunneling conductances, both published1 ; 14 and unpublished, from three different overdoped crystals (Tc = 56-62 K) are shown in the inset of Fig. 2. Junctions have been chosen which have values in the range 17 meV - 19 meV to examine the reproducibility of dip features for a given value of . What is evident is that the three junctions exhibit a high degree of reproducibility in the shape, strength and characteristic voltage of the dip feature. Based on the similarity of the overall conductance shapes to the SIS data analyzed in Fig. 1, it can be inferred directly that will have a sharp peak characterized by an energy 30 meV, obtained from the dip minimum position. Temperature dependent measurements 15 lead to an estimated Tc 60 K for these junctions, which is the value for which optical conductivity data 7 indicates the disappearance of the sharp boson mode in overdoped Bi2212. The tunneling data show no evidence of such disappearance.
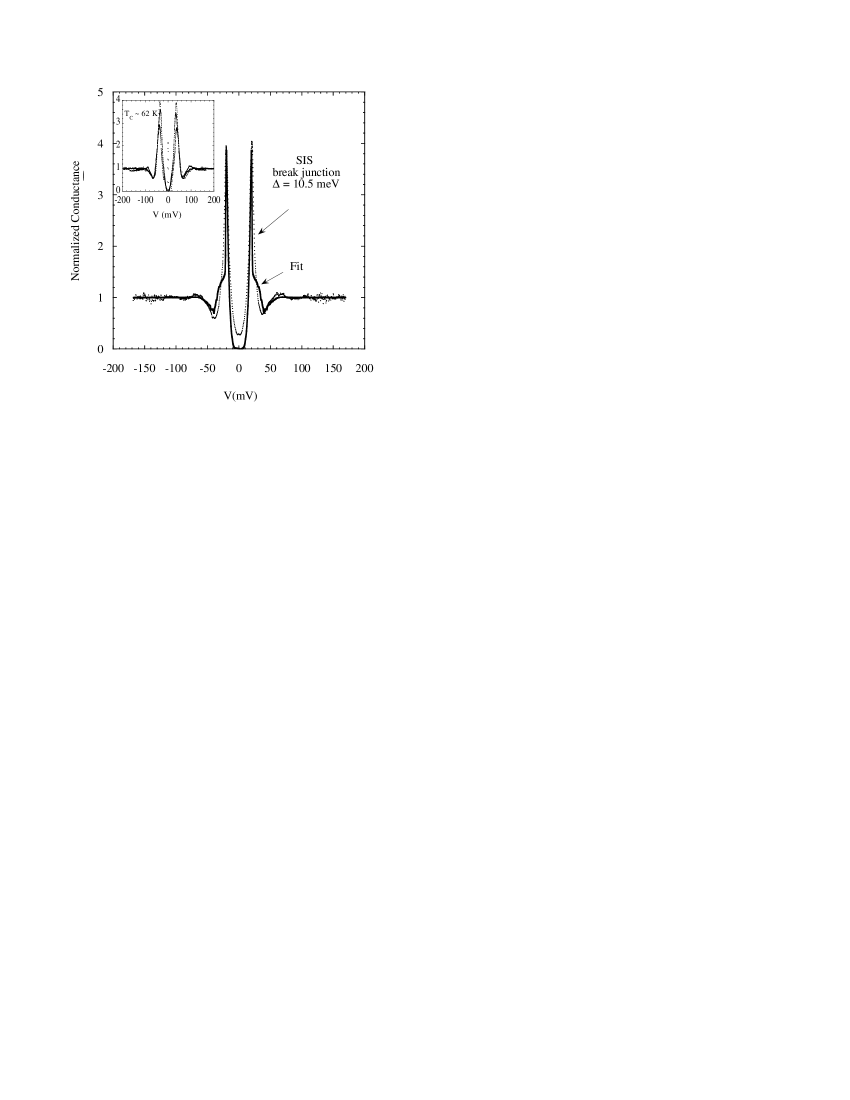
The main panel of Fig. 2 shows normalized published data and strong-coupling fit for a very heavily overdoped Bi2212 junction which has a measured junction Tc 56 K. 15 This junction exhibits a gap parameter = 10.5 meV, which to our knowledge is the smallest value reported for Bi2212. The dip features are adequately fit by the Eliashberg model, and this leads to the #2 shown in Fig. 3(a). Again, self-consistency is obtained as #2 leads directly to the measured gap. Here we have used a tunneling weighting factor (see ref. 15) to achieve the PHB ratio. The #2 demonstrates that even in this very heavily overdoped crystal, the electronic coupling to the boson mode has not disappeared and in fact dominates the spectral function.
The principal issue raised by this study is why such a discrepancy exists between tunneling and optical conductivity spectra for overdoped Bi2212. Both experiments probe the entire Fermi surface so arguments based on momentum selectivity (e.g. ARPES [18]) do not apply. To compare with ARPES and optical conductivity, we plot -2 for the two spectra in Fig. 3(b). The curve #1 corresponds to #1 and bears a remarkable resemblance to -2 determined directly from the low temperature nodal quasiparticle spectral weight in ARPES.4 Furthermore, the peak has an amplitude near 500 cm-1 which corresponds to the difference between superconducting and normal -2 in optical conductivity.7 This implies that electron interactions are showing up in the optical conductivity that are not seen in the tunneling spectra.
We believe the reason for the discrepancy lies in the way tunneling probes the electron self-energy. In conventional, s-wave superconductors, the tunneling DOS where and the pairing self-energy, , primarily gives rise to the phonon fine structure.19 ; 20 Above Tc, and the tunneling DOS is flat and featureless (as found in experiment). Also beyond a cutoff frequency, , effectively decoupling superconductivity (and tunneling spectra) from higher frequency electron interactions. The d-wave, Eliashberg model9 used here has an additional momentum dependence, but the sensitivity to the pairing self-energy remains. Therefore the tunneling , generated along with , contains only those electron interactions which participate in pairing.
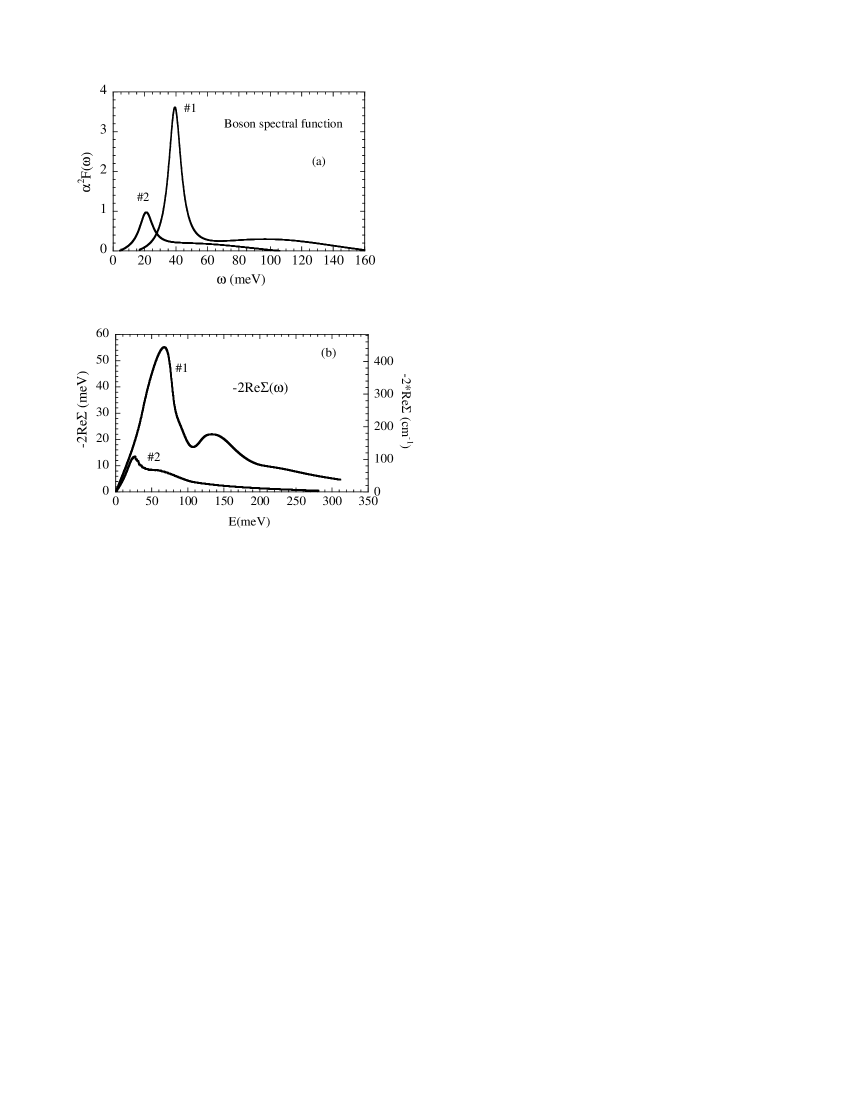
On the other hand, optical conductivity probes the scattering rate and will reflect all electron interactions which enter the full diagonal self-energy . The large size of the broad, high energy background relative to the resonance mode observed in optical self-energy is not compatible with the or found in Fig. 3. This implies that a large fraction of the high energy boson continuum indeed couples to electrons but is not relevant to superconductivity. This is reminiscent of conventional superconductors where the high frequency part of the coulomb interaction plays no role in the superconductivity and this repulsive interaction enters as , reduced from the total electron-electron coupling constant, . 19 ; 20 Thus the tunneling data indicate that the mode has not disappeared in the optical conductivity. Rather, Fig. 3(b) shows that (-2 # 2 from tunneling is considerably reduced in size compared with # 1 and the mode becomes unresolved in a broad spectrum of excitations which do not participate in superconductivity.
In summary, SIS break junction tunneling data on near optimal and heavily overdoped Bi2212 have been analyzed quantitatively to provide the electron-boson spectral function and the diagonal self-energy . The robust dip feature is directly linked to strong electronic coupling to a narrow boson spectrum, a peak in , which drives the superconductivity and shows no evidence of disappearing with overdoping. This fundamental disagreement with optical conductivity can be resolved by considering the way each experiment probes the electron self-energy. Tunneling directly measures the pairing part,, and the resulting and reflect only those electronic interactions which participate in pairing. The more detailed analysis presented here confirms previous reports1 that the mode energy decreases substantially with overdoping which seems to rule out the B1g phonon and favors the resonance spin excitation as its origin.
Acknowledgements This work was supported in part by US Department of Energy, Division of Basic Energy Sciences - Materials Science under contract no. W-31- 109-ENG-38.
References
- (1) J.F Zasadzinski et al, Phys. Rev. Lett. 87, 067005 (2001)
- (2) B. W. Hoogenboom, C. Berthod, M. Peter, O. Fischer, A.A. Kordyuk, Phys. Rev. B 67, 224502 (2003)
- (3) J.C. Campuzano et al, Phys. Rev. Lett. 83, 3709 (1999)
- (4) P.D. Johnson, T. Valla, A.V. Fedorov, Z. Yusof, B. O. Wells, Q. Li, A. R. Moodenbaugh, G. D. Gu, N. Koshizuka, C. Kendziora, Sha Jian and D. G. Hinks, Phys. Rev. Lett. 87, 177077 (2001)
- (5) T. Cuk et al, (unpublished) cond-mat 0403521
- (6) J.J. Tu, C.C. Homes, G.D. Gu, D.N. Basov and M. Strongin, Phys. Rev. B 66, 144514 (2002)
- (7) J. Hwang, T. Timusk, G. D. Gu, Nature 427, 714 (2004)
- (8) For simplictiy we use the term boson mode and narrow spectrum of excitations interchangeably
- (9) J.F. Zasadzinski, L. Coffey, P. Romano, Z. Yusof, Phys. Rev. B 68, 180504, (2003)
- (10) J. P. Carbotte, E. Schachinger and D.N. Basov, Nature (London) 401, 354 (1999)
- (11) For a review of the resonance mode see Y. Sidis, S. Pailhes, B. Keimer, P. Bourges, C. Ulrich and L.P. Regnault, Phys. Stat. Sol (2003)
- (12) C. Kendziora and A. Rosenberg, Phys. Rev. B 52, 9867 (1995)
- (13) N. Miyakawa, J.F. Zasadzinski, L. Ozyuzer, P. Guptasarma, D. G. Hinks, C. Kendziora, K.E. Gray, Phys. Rev. Lett. 83, 1018 (1999)
- (14) L. Ozyuzer, J.F. Zasadzinski, C. Kendziora, K.E. Gray, Phys. Rev. B61, 3629 (2000)
- (15) L. Ozyuzer, J.F. Zasadzinski, K.E. Gray, C. Kendziora, N. Miyakawa, Europhys. Lett. 58, 589 (2002)
- (16) The SIS fit also shows an additional, sharper dip feature between the peak and dip which arises from the strong coupling onset in the DOS. While no such sharp structure has ever been observed in the break junction conductances, it is not uncommon to observe a shoulder in SIS conductances just beyond the peak, which might be related to this effect. It must be remembered that these break junctions are macroscopic and any inhomogeneities will broaden such sharp features.
- (17) Lack of agreement in the sub-gap region may be due in part to an incipient Josephson current. Well-defined Josephson currents are typically observed in moderately overdoped SIS break junctions.
- (18) T. Cuk, A.D. Gromko, Zhe Sun, Z.-X. Shen, D.S. Dessau (unpublished) cond-mat 0403743
- (19) E. L. Wolf, Principals of Electron Tunneling Spectroscopy (Oxford University Press, Oxford, 1985)
- (20) W. L. McMillan and J.M. Rowell, in Superconductivity edited by R.D. Parks, ( Dekker, New York, 1969)