What is moving in silica at 1 K? A computer study of the low-temperature anomalies
Abstract
Though the existence of two-level systems (TLS) is widely accepted to explain low temperature anomalies in many physical observables, knowledge about their properties is very rare. For silica which is one of the prototype glass-forming systems we elucidate the properties of the TLS via computer simulations by applying a systematic search algorithm. We get specific information in the configuration space, i.e. about relevant energy scales, the absolute number of TLS and electric dipole moments. Furthermore important insight about the real-space realization of the TLS can be obtained. Comparison with experimental observations is included.
pacs:
61.43.Fs, 63.50.+x,Most kinds of disordered solids show anomalous behavior at very low temperatures (Kelvin regime and below) as compared to their crystalline counterparts. Many of the observed features can be explained by the Standard Tunneling Model (STM) Phillips (1972); Anderson et al. (1972) and its generalization, which is the Soft-Potential Model Karpov et al. (1983); Buchenau et al. (1991). The basic idea of the STM is to postulate the possibility of localized transitions between different configurations, i.e. adjacent minima of the potential energy landscape. Such a transition can be described by a double-well potential (DWP), characterized by an asymmetry , potential height V and distance between both configurations. From a quantum-mechanically perspective at low temperatures the system is tunneling between both configurations and the DWP is characterized by the lowest two eigenstates. If their energy difference E is in the Kelvin regime, these DWP may contribute to the low-temperature anomalies. Then one may speak of Two Level Systems (TLS). The TLS can couple to strain and electric fields and therefore show up in observables like thermal conductivity, sound absorption and dielectric response P. Esquinazi (1998) (ed.). Recently, even observations about the interaction of different TLS have been reported Natelson et al. (1998); Classen et al. (2000); Rosenberg et al. (2003).
So far it has not been possible to derive a theory of the low-temperature anomalies of real glass-forming systems from first principles, except for mean-field models Kühn (2003) and random first order transition theory Lubchenko and Wolynes (2001). Thus for a prototype system like SiO2 the STM has to be basically considered as phenomenological. Important questions emerge. (Q1) How many TLS are present? This is, of course, a central experimental observables. (Q2) What are the energetic properties of the TLS, e.g. typical barrier heights? (Q3) What is the average microscopic nature of the TLS?
Computer simulations may help to shed some light on the nature of the low-temperature anomalies. In previous work on SiO2 the trajectories, generated either by molecular dynamics Trachenko et al. (1998a, b) or by the activation-relaxation technique Mousseau et al. (2000), have been analyzed with respect to transition events between different structures. Both approaches yield some interesting insight into the nature of relaxation processes in SiO2. (Q1), however, requires a systematic search procedure, and (Q2) and (Q3) a sufficiently large number of characteristic DWP and thus an efficient search method. This has not been the scope of previous simulations on SiO2.
In recent years we have developed a set of simulation techniques which allow us to approach these questions Reinisch and Heuer (2004a, b). (Q1) Starting from representative low-energy structures we systematically search for adjacent minima of the potential energy landscape, i.e. DWP. It is possible to formulate an intrinsic completeness criterion to check whether an existing adjacent minimum has indeed been found Reinisch and Heuer (2004a). If this criterion is fulfilled we have access to the absolute number of TLS. Saddles are determined via a robust saddle-search algorithm Doliwa and Heuer (2003). (Q2) The typical interatomic energy scale and thus the typical range of DWP asymmetries is of the order 1 eV. Thus via a direct search it is impossible to find a set of DWP with asymmetries in the Kelvin regime. In the Soft-Potential Model a DWP is parametrized by a quartic polynomial , thereby reproducing the values for and . If not mentioned otherwise, corresponds to the mass-weighted distance, obtained from a straight connection of both minima with the transition state. Using this parametrization we can first determine distribution functions from our set of numerically found DWP and then generate an arbitrary large number of DWP with the same statistics. Thus it is possible to estimate the DWP distribution function over a broad range of parameters and in particular to get important information about the properties of nearly symmetric DWP, i.e. TLS. (Q3) Due to the effectiveness of the search algorithm we find a sufficiently large number of DWP to perform a reasonable statistical analysis with respect to microscopic properties. All technical aspects and in particular the justification of the parametrization approach can be found in Reinisch and Heuer (2004a, b). So far we have successfully applied these methods to Lennard-Jones model systems Heuer and Silbey (1996, 1993); Doliwa and Heuer (2003); Reinisch and Heuer (2004a, b); see also Oligschleger and Schober (1995) and chapter 8 of Ref.P. Esquinazi (1998) (ed.).
In this paper these techniques are for the first time applied to pure SiO2, modelled by the BKS-potential van Beest et al. (1990). Despite the enormous numerical effort, involved in these calculations, we were able to obtain detailed results about the central questions (Q1)-(Q3), introduced above.
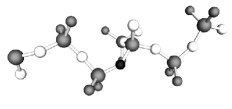
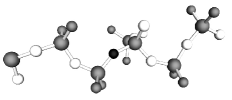
We have analyzed system sizes of 150 and 600 particles with the standard density of 2.3 and a short-range cutoff for the BKS-potential of 8.5 Å. The starting configurations for the systematic search correspond to equilibrium configurations at 3000 K, which subsequently were minimized. We have obtained starting structures with and without defects, i.e. deviations from a perfect tetrahedral coordination. It turned out that the properties of DWP are totally different in both cases because a defect is very likely related to DWP with high barriers Mousseau et al. (2000) and a stronger spatial localization. Experimental silica samples, however, freezing in at the calorimetric , do not show a high number of defects Horbach and Kob (1999). Therefore we have only considered structures without defects. Actually, these non-defect structures are very similar to those one would obtain from simulations at much lower temperatures Saksaengwijit et al. (2004). Furthermore we have only taken into account DWP with K. This already corresponds to the symmetric side of the asymmetry distribution Mousseau et al. (2000). With this constraint we have been able to produce a set of 250 DWP for 150 particles and 50 DWP for 600 particles. One example is shown in Fig. 1. On average we have found one DWP per 14 defect-free starting structures. The completeness criterion is fulfilled. To a good approximation the distribution of asymmetries is constant (data not shown). Thus the number of DWPs with K can be estimated via where is the length of the simulation box.
For the 600 particle system the search procedure is complicated by the occurrence of independent DWP, which makes a systematic search much more time-consuming. Due to the better statistics we report results for the 150 particle system. We checked, however, that apart from minor variations in the participation ratio (see below) all properties, discussed in this work, are identical for both system sizes within statistical uncertainty. This is compatible with our previous result that the thermodynamics of BKS-SiO2 with only 99 particles is, apart from trivial scaling, basically identical to that of a macroscopic system Saksaengwijit et al. (2004).
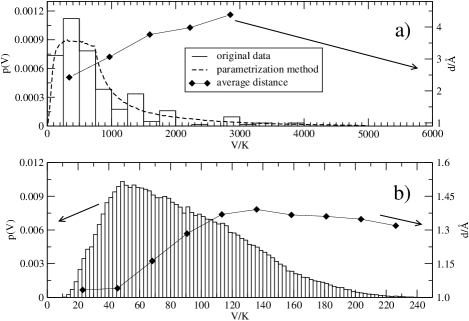
In Fig. 2a we show the distribution of barrier heights. Using the parametrization method we obtain the full distribution of DWP, i.e. . Interestingly, the typical barrier heights agrees well with the value of approx. 500 K, estimated from Brillouin scattering experiments Tielbürger et al. (1992). Using the same constraint K the original distribution is reproduced; see also Fig. 2a. Next we have estimated the tunneling matrix element for every DWP in the full distribution , using the WKB approximation Phillips (1987), and calculated the energy splitting of the two lowest eigenfunctions and the relaxation rate Phillips (1987). The subset of DWP with K and s, which from now on we denote TLS, is relevant in the Kelvin regime. The distribution of barrier heights of the TLS is presented in Fig. 2b. This distribution shows a maximum around 50 K. The average distance between both minima varies with increasing potential height. More generally, one observes that very nearby minima have smaller asymmetries and barrier heights. This correlation has been also observed for the Lennard-Jones system Reinisch and Heuer (2004a, b).
The effective density of states is accessible, i.e, by sound absorption experiments Berret and Meissner (1988). Based on our distribution and our systematic search procedure we can estimate this value from first principles. Again, for the necessary technicalities we have to refer the reader to the corresponding analysis of Lennard-Jones systems Reinisch and Heuer (2004a); Heuer and Silbey (1993). We obtain for pure defect free silica that
| (1) |
which is of the same order as the value from the simple estimation, reported above. K) can be directly compared to experimental Sahling et al. (2002) values between for Suprasil W (205 ppm impurities) and for Suprasil I(1250 ppm impurities). The dependence on energy is weak but significant and can be regarded as a correction to the STM. Although for a first principle analysis the agreement of K) with the experimental data is already remarkable the remaining differences can be (at least partly) related to different aspects: (i) Using a Frank-Condon factor for the multidimensional renormalization and taking into account the entropic effects, obtained from a harmonic analysis of the transition state and the minima, may increase the presented value by a factor of 1.5 according to our estimation. (ii) The remaining defects, present even at , may have some impact on this number. Since for pure SiO2 the number of defects is only roughly known it is difficult to estimate this contribution Horbach and Kob (1999). Since, however, defects are very efficient in forming DWP (data not shown) even a concentration of 100 ppm contributes to . (iii) The impurities in real silica systems contribute additional extrinsic DWP.
In the remaining part of this paper we would like to discuss the real-space properties of the DWP found in our simulation. For the DWP in Fig. 1 the tetrahedra, involved in the main displacement, basically form a 1D-chain. Visual inspection of about 50 DWP indicates that this reduced dimensionality of the transition is a generic feature. One can also see that the number of participating particles is rather small. Interestingly, only two oxygens per tetrahedron move significantly. In what follows we will present a statistical analysis of all DWP to extract the average behavior.
For the average participation ratio different definitions can be used Reinisch and Heuer (2004a). We obtain (both for N=150 and N=600) , and . For this specific analysis describes the euclidian distance between two configurations. is the displacement of particle and the displacement of the most displaced particle. Actually, very similar values are reported in Trachenko et al. (1998b) and in Ekunwe and Lacks (2002) where the tetrahedra relaxation upon applied pressure has been monitored. The most displaced particle is oxygen in all analyzed cases (which is further denoted as central oxygen) and the 4 most displaced particles are exclusively oxygen in over of all analyzed cases. Averaged over all particles, the mean square displacement of oxygen is 2.3 times larger than that of silicon. Furthermore, we have checked that the participation ratio decreases with decreasing distance in analogy to the Lennard-Jones system Heuer and Silbey (1993); Reinisch and Heuer (2004a). One can estimate that the above values for the participation ratio decrease by approx. 25% when evaluated for distances of Å for typical TLS rather than Å for typical DWP (see Fig. 2). Furthermore, the TLS have an electric dipole moment which is also accessible experimentally. Using the partial charges of the BKS potential we obtain an average dipole moment of 0.65 D which is in excellent agreement with the experimental value of 0.5 D Golding et al. (1979).
In the next step we have analyzed the average local environment of the central oxygen. It turns out that before and after the flip its average Si-O-Si angle is whereas at the transition state it is approx. 160∘. Thus to a good approximation the Si-O-Si bond performs a flip rather than a simple rotation. Actually, the average Si-O-Si angle for all bonds is 152∘ in the BKS-system Yuam and Cormack (2003), which indicates a structural anomaly around the central oxygen. The observed strong dependence of the density of states on the inter-tetrahedral structure Liu et al. (1995) fits in this picture, since the relevant Si-O-Si angle is the most important parameter for the inter-tetrahedral structure.
Furthermore, also the O-Si-O angles vary during the transition. The most displaced tetrahedra shows variations of the O-Si-O angles of 2.7∘ which is nearly half of the overall equilibrium variation of intra-tetrahedral angles; see also Ekunwe and Lacks (2002). However, for this quantity no structural anomalies could be observed. One may speculate that these distortions are an important process of dampening the motion and thus to localize the DWP.

Another structural anomaly can be seen from comparing the radial distribution functions around the central oxygen at the transition and two minima positions with that of an average oxygen; see Fig. 3. First, we observe a shortening of the Si-O bond during the transition. Thus the Si-O-Si bond flip is achieved by a squeezing of the oxygen through the two adjacent Si atoms. Second, and even more important, the Si-O bond lengths for the typical DWP minima is significantly smaller than observed for the bulk, and their distribution is narrower.
In order to minimize the energy variation during the transition it is essential that the total amount of particle displacement is as small as possible. Thus tetrahedra rotations around the threefold axis, giving three equally large oxygen displacements, should be very unfavorable. A better choice would be rotation around one of the tetrahedral edges, thus moving only two oxygen atoms. This type of motion has already been indicated in Fig. 1, where only two oxygens at most tetrahedra are largely displaced.
To establish a statistical picture of the typical tetrahedron rotation the average displacements of the 4 oxygen atoms at each tetrahedron have been investigated. In Fig. 4 results are presented for the 10 most displaced tetrahedra averaged over all TLS. To give a better impression of the rotation the three differences of the displacements are shown. The first dot in each section corresponds to the difference of the displacements of the two most displaced oxygens and so on.
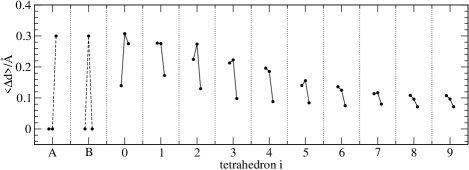
In agreement with expectation the nature of the rotations is quite different to case A (rotation around threefold axis). Interestingly, the most displaced tetrahedron indeed shows a rotation with some similarity to the proposed rotation axis along a tetrahedral edge (case B in Fig. 4). All other rotations follow a different scheme, which involves four different displacements for the oxygen atoms. This can be possibly interpreted as a transition to a statistical (low-amplitude) displacement with no symmetry criterion for the rotation axis.
One can compare the observed rotation scheme with the proposed motion of five connected tetrahedra by Buchenau et al. which is often used as a microscopic visualization for SiO2-TLS Buchenau et al. (1984). The different displacements for all oxygens connected to a tetrahedron as well as the Si-O-Si flip motion fully agree with our results. There are, however, some important modifications suggested by this work: (i) the individual tetrahedron rotation axes does not always go through an oxygen or silicon atom, (ii) tetrahedron distortion should be considered, (iii) the spatial structures are one dimensional rather than three dimensional. It might be also interesting to compare these modes in detail with the localized vibrational modes studied, e.g., in Taraskin and Elliott (1999).
In summary, for the first time it is possible to obtain a systematic numerical description of the TLS for BKS-SiO2. The density of TLS and the electric dipole moment are in semi-quantitative agreement with experimental data. Important microscopic properties of the TLS like structural anomalies and the nature of the displacements have been gained. In principle, microscopic information about TLS is also available from recently performed experiments on magnetic field dependent polarization echoes. Thus, with the complementary views from experiment and simulation a detailed microscopic picture of the low-temperature anomalies will hopefully emerge.
We like to thank U. Buchenau, C. Enss, B. Doliwa, H. Lammert, A. Saksaengwijit, H.R. Schober and M.Vogel for fruitful discussions and the NRW International Graduate School of Chemistry for funding.
References
- Phillips (1972) W. A. Phillips, J. Low Temp. Phys. 7, 351 (1972).
- Anderson et al. (1972) P. W. Anderson, B. I. Halperin, and C. M. Varma, Phil. Mag. 25, 1 (1972).
- Karpov et al. (1983) V. G. Karpov, M. I. Klinger, and F. N. Ignatiev, Sov. Phys. JETP 57, 439 (1983).
- Buchenau et al. (1991) U. Buchenau, Y. M. Galperin, V. L. Gurevich, and H. R. Schober, Phys. Rev. B 43, 5039 (1991).
- P. Esquinazi (1998) (ed.) P. Esquinazi (ed.), Tunneling Systems in Amorphous and Crystalline Solids (Springer, 1998).
- Natelson et al. (1998) D. Natelson, D. Rosenberg, and D. D. Osheroff, Phys. Rev. Lett. 80, 4689 (1998).
- Classen et al. (2000) J. Classen, T. Burkert, C. Enss, and S. Hunklinger, Phys. Rev. Lett. 84, 2176 (2000).
- Rosenberg et al. (2003) D. Rosenberg, P. Nalbach, and D. D. Osheroff, Phys. Rev. Lett. 90, 195501 (2003).
- Kühn (2003) R. Kühn, Europhys. Lett. 62, 313 (2003).
- Lubchenko and Wolynes (2001) V. Lubchenko and P. G. Wolynes, Phys. Rev. Lett. 87, 195901 (2001).
- Trachenko et al. (1998a) K. Trachenko, M. T. Dove, K. D. Hammonds, M. J. Harris, and V. Heine, Phys. Rev. Lett. 81, 3431 (1998a).
- Trachenko et al. (1998b) K. Trachenko, M. T. Dove, M. J. Harris, and V. Heine, J. Phys.: Condens. Matter 12, 8041 (1998b).
- Mousseau et al. (2000) N. Mousseau, G. T. Bakema, and S. W. de Leeuw, J. of Chem. Phys. 112, 960 (2000).
- Reinisch and Heuer (2004a) J. Reinisch and A. Heuer, J. Low. Temp. Phys. 137, 267 (2004a).
- Reinisch and Heuer (2004b) J. Reinisch and A. Heuer, Phys. Rev. B 70, 064201 (2004b).
- Doliwa and Heuer (2003) B. Doliwa and A. Heuer, Phys. Rev. E 67, 031506 (2003).
- Heuer and Silbey (1996) A. Heuer and R. J. Silbey, Phys. Rev. B 53, 609 (1996).
- Heuer and Silbey (1993) A. Heuer and R. J. Silbey, Phys. Rev. Lett. 70, 3911 (1993).
- Oligschleger and Schober (1995) C. Oligschleger and H. R. Schober, Solid State Comm. 93, 1031 (1995).
- van Beest et al. (1990) B. W. van Beest, G. J. Kramer, and R. A. van Santen, Phys. Rev. Lett. 64, 1955 (1990).
- Horbach and Kob (1999) J. Horbach and W. Kob, Phys. Rev. B 60, 3169 (1999).
- Saksaengwijit et al. (2004) A. Saksaengwijit, J. Reinisch, and A. Heuer, Phys. Rev. Lett. 93, 235701 (2004).
- Tielbürger et al. (1992) D. Tielbürger, R. Merz, R. Ehrenfels, and S. Hunklinger, Phys. Rev. B 45, 2750 (1992).
- Phillips (1987) W. A. Phillips, Rep. Prog. Phys. 50, 1657 (1987).
- Berret and Meissner (1988) J. F. Berret and M. Meissner, Z. Phys. B 70, 65 (1988).
- Sahling et al. (2002) S. Sahling, S. Abens, and T. Eggert, J. Low. Temp. Phys. 127, 215 (2002).
- Ekunwe and Lacks (2002) N. Ekunwe and D. J. Lacks, Phys. Rev. B 66, 212101 (2002).
- Golding et al. (1979) B. Golding, M. v. Schickfus, S. Hunklinger, and K. Dransfeld, Phys. Rev. Lett. 43, 1817 (1979).
- Yuam and Cormack (2003) X. Yuam and A. C. Cormack, J. Non-Cryst. Solids 319, 31 (2003).
- Liu et al. (1995) X. Liu, H. Löhneysen, G. Weiss, and J. Arndt, Z. Phys. B 99, 49 (1995).
- Buchenau et al. (1984) U. Buchenau, N. Nücker, and A. J. Dianoux, Phys. Rev. Lett. 53, 2316 (1984).
- Taraskin and Elliott (1999) S. Taraskin and S. Elliott, Phys. Rev. B 59, 8572 (1999).