Cooperative Phenomenon of Ferromagnetism and Unconventional Superconductivity in UGe2: A 73Ge-NQR Study under Pressure
Abstract
We report on a cooperative phenomenon of ferromagnetism and unconventional superconductivity (SC) in UGe2 through the measurements of 73Ge nuclear-quadrupole-resonance (NQR) under pressure (). The NQR spectra evidenced phase separation into ferromagnetic and paramagnetic phases in the vicinity of GPa, pointing to a first-order transition. The measurements of nuclear-spin-lattice-relaxation-rate revealed that SC emerges under the background of ferromagnetism, but not of the paramagnetic phase.
Recently, superconductivity (SC) has been observed under a background of ferromagnetism (FM) in UGe2 [1, 2] and URhGe [3]. Since FM and SC have been generally believed to be exclusive from each other, the coexsistence of FM and SC in these compounds is a great surprise. Figure 1(a) shows the pressure () versus temperature () phase diagram of UGe2 established from various measurements [1, 2, 7, 4, 5, 8]. The ferromagnetic transition temperature at ambient pressure ( = 0) decreases monotonically from = 52 K with increasing and seems to suddenly vanish around GPa. SC was discovered in the range of = 1 to 1.5 GPa, exhibiting the highest transition temperature K at GPa. Upon cooling below , ferromagnetic moments increase markedly [1, 2, 5]. The high-- and the low-- phases are denoted as FM1 and FM2 respectively, as indicated in the phase diagram. At , the first-order transition from FM2 to FM1 emerges as a function of and at as a function of in the case of . Here, is a terminal point of the first-order transition [8, 11].
By contrast, it should be noted that both SC and FM1 are simultaneously suppressed at a ferromagnetic critical pressure . This suggests that SC and FM in UGe2 are cooperative phenomena. Indeed, the 73Ge-NQR measurements have revealed that both FM1 and FM2 coexist uniformly with the unconventional SC with a line node-gap in the vicinity of [9, 10, 11]. It is surprising that the 5 electrons of uranium contribute to the onset of the uniform coexistent phase of FM and SC. This phenomenon is difficult to understand in terms of the spin-singlet pairing framework for the Cooper pairs. Therefore, this fact suggests that SC in UGe2 may be in a spin-triplet pairing state under the background of FM. In order to address the intimate interplay between FM and SC in UGe2 near GPa where FM seems to collapse, we here report on the microscopic characteristics of FM and SC near and over revealed by the measurements of nuclear-quadrupole-resonance (NQR) of enriched 73Ge under at zero magnetic field () .

A polycrystalline sample enriched with 73Ge was prepared and crushed into powder to allow a maximal penetration of oscillating magnetic field into the sample. The NQR experiment was performed by the conventional spin-echo method at in the frequency () range of 5 to 12 MHz at = 1.5, 1.7 and 2.0 GPa. Hydrostatic pressure was applied by utilizing a NiCrAl-BeCu piston-cylinder cell filled with Daphne oil (7373) as a pressure-transmitting medium. In order to calibrate each value of at low temperatures, the dependence of of Sn metal was measured by resistivity measurement. A 3He-4He dilution refrigerator was used to reach the lowest temperature, 40 mK. Figure 1(b) shows the NQR spectra for the paramagnetic phase (PM) at K and GPa. They reveal a structure consisting of significantly separated peaks associated with three inequivalent Ge sites in one unit cell (see Figure 1). The number of Ge1 in one unit cell is two times as large as the number of either Ge2 or Ge3 in one unit cell. The Ge1 site is closely located along the uranium (U)-zigzag chain, while the other two sites Ge2 and Ge3 are located out of this zigzag chain. The values of NQR parameters at the Ge1, Ge2 and Ge3 sites were estimated on the basis of the band calculation by one of authors (H. Harima) [11].
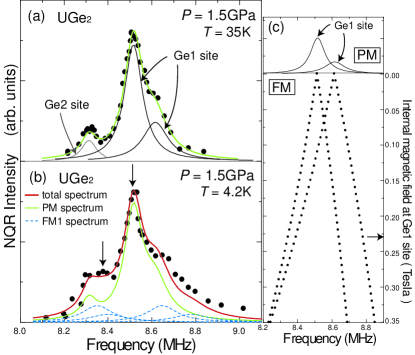
Figure 2(a) indicates the spectra for the PM at K and GPa where FM1 collapses. Over the range of = 8.2 to 8.8 MHz there are two NQR spectra for the Ge1 site (middle and right) and one NQR spectrum for the Ge2 site (left). Note that the spectra at the Ge1 site almost overlap due to the asymmetry parameter . As temperature decreases below 10 K, the spectral shape becomes slightly broadened as seen for the spectra at K in Figure 2(b), although the overall shape remains unchanged, suggesting that the system remains mostly in PM. This result shows that PM and FM1 are separated at 1.5 GPa. By contrast, the NQR spectra at and 2.0 GPa beyond reveal that the system remains in PM down to 0.5 K. Here we focus on the change in NQR spectra caused by the small size of that is induced at the Ge1 site due to the onset of FM1. This is because the Ge1 site is located near the uranium zigzag chain responsible for FM1 and that the number of the Ge1 site is twice larger than that of the Ge2 and Ge3 sites in one unit cell. The dotted lines in Figure 2(c) indicate the variation in frequencies for the two peaks in the spectra at the Ge1 site in PM, which are separated as increases for FM1. The spectra in Figure 2(b) are reproduced by assuming = 0.23 T at K for FM1, as marked by the arrow in Figure 2(c) and also assuming the ratio of PM to FM1 of 7:3. This means that the phase separation into PM and FM1 takes place.
Thus, the first-order transition from FM1 to PM is evidenced around 1.5 GPa from a microscopic point of view. It is noteworthy that in the previous work, both FM1 and FM2 coexist in a certain range lower than just below GPa as well [11].
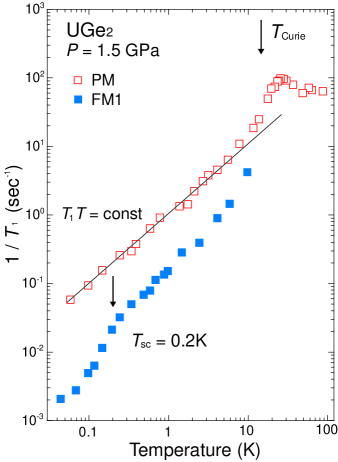
Figure 3 shows the dependence of at 1.5 GPa and = 0. As temperature decreases below 10 K, the two components in appear in association with the onset of FM1 because the phase separation into PM and FM1 is evidenced from the NQR spectra below K. The ’s for FM1 and PM are measured at the respective frequencies 8.37 MHz and 8.51 MHz, which are marked by the arrows in Figure 2(b). Note that the at 8.51 MHz is uniquely determined by the theoretical recovery curve of NQR relaxation at the Ge1 site in the case of [11]. On the other hand, the careful analysis of at 8.37 MHz is required because the spectra of FM1 overlap with those arising from the Ge1 and Ge2 sites remaining in the PM. Noting that the NQR intensity in the spectrum simulated as arising from the Ge2 in Figure 2(a) is very small at 8.37 MHz and that the intensity ratio of FM1 to PM for the Ge1 site is estimated to be 6:4 at 8.37 MHz, the respective values of and for FM1 and PM are reasonably deduced from fitting a measured recovery curve of nuclear magnetization, , to a theoretical one, (with and ) . Here, , where and are the respective values at the thermal equilibrium state and at a time after saturation pulses. The theoretical relaxation curve for transition is given by . A notable result is that the (solid squares) associated with FM1 decreases below 0.2 K. This decrease in may be ascribed to a superconducting transition emerging for FM1. This is because the anomalies related to the onset of SC at K were actually observed near in the other measurements [1, 2, 7, 6]. Remarkably, no trace for SC is seen in the (open squares) for PM, indicating that the SC in UGe2 sets in under the background of FM.
Figure 4(a) and 4(b) indicate the dependence of for the FM1 at GPa and GPa and for the PM at 1.5, 1.7 and 2.0 GPa, respectively. At low temperatures, the value of remains constant. It is remarkable that the dependence of is scaled to that of the -linear coefficient in heat capacity (open squares), as presented in Figure 4(c).
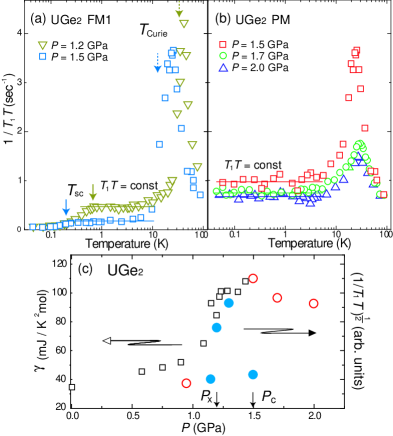
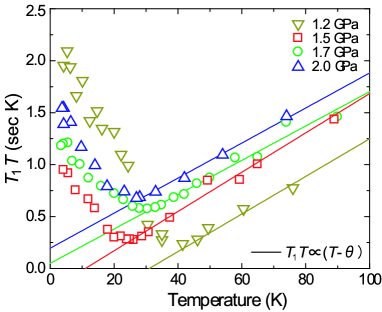
Here the data of are taken from ref. 6. This coincidence between the dependencies of and points to the intimate -derived variation of the effective density of states (DOS) at the Fermi level. Note that the DOS for FM1 and FM2 increases suddenly around 1.2 GPa where the first-order transition from FM2 to FM1 occurs, whereas it decreases at GPa, exhibiting a sharp peak around GPa. Note that the peak in at GPa arises from PM separated from FM1. Interestingly, the DOS at GPa for FM1 is comparable to that for FM2 at GPa, and then the respective SC sets in at and 0.35 K for FM1 and FM2. In the vicinity of GPa, where the DOS for FM1 has its peak, the SC undergoes the highest 0.7 K [8, 11]. It is the peak in DOS around 1.2 GPa that leads to be highest . We remark, however, that a larger DOS for PM than for FM1 at GPa does not always lead to the onset of SC. It is evident that the onset of SC takes place under the background of FM in the range of = 1.15 to 1.5 GPa. As can be seen in Figure 4(a), at GPa has a peak at K due to the critical slowing down of spin fluctuations associated with the FM1 ordering. However, as seen in Figure 4(b), at GPa also exhibits a peak at around K. This temperature is higher than the phase-separation temperature 15 K. Furthermore, even at = 1.7 and 2.0 GPa, where FM1 completely collapses, it is unusual that a broad peak in is observed at around K for PM. In the paramagnetic state well above and , is expected to be expressed by , which is predicted by the self-consistent renormalization (SCR) theory for weakly itinerant ferromagnets [12]. Here, is the uniform susceptibility. Actually, the data at GPa and GPa follow the relation , with K and 11 K, respectively, as shown in Figure 5. Note here that K at GPa is close to 15 K, but it is significantly lower than K, where the unexpected peak in is observed, as seen in Fig.4(a). At = 1.7 and 2.0 GPa, where FM1 completely collapses, seems to be valid as predicted for nearly ferromagnetic metals, with and K, respectively. If an isotropic spin-fluctuation regime was dominant in these nearly ferromagnetic systems, then this relation should be valid down to low . For UGe2 at = 1.7 and 2.0 GPa, however, the broad unexpected peak emerges around K, as seen in Figure 4(b). It is suggested that this suppression of spin fluctuations below may be caused by anisotropic spin fluctuations of electrons because of the Ising-like uniaxial magnetic properties in UGe2, which are reported in the literature [13]. If such anisotropic character in the dynamical susceptibility of spin fluctuations reduces the transversal components of hyperfine fields at the Ge sites, the nuclear relaxation rate might be suppressed. This anisotropic character of spin fluctuations in PM may be relevant with the metamagnetic increase in magnetization upon increasing [4, 8]. This is also consistent with the fact that the magnetization in either FM1 or FM2 exhibits the Ising uniaxial anisotropy along the a-axis. Interestingly, in FM1 the application of a magnetic field makes the upper critical field jump rapidly and in zero field seems to be enhanced, whereas applying pressure decreases . On the other hand, even though PM undergoes the metamagnetic increase in magnetization and enters the field-induced FM1, but supeconductivity does not take place near GPa. Noting that the SC in UGe2 exhibits the highest at the that is the termination point of first-order transition from FM2 to FM1, the longitudinal fluctuations of ferromagnetic polarization emerging in either FM1 or FM2 are thought to play a role in mediating the Cooper pairs in UGe2 because the stiffness of Ising-like ferromagnetic moments becomes soft at .
In conclusion, the 73Ge-NQR measurements on UGe2 have revealed that FM1 and PM are separated at GPa.
A notable result is that the SC at 0.2 K emerges only under the background of FM1, but not of PM near GPa. Furthermore, the results at pressures exceeding have suggested that the spin fluctuations at low possess the Ising-like character even in the -induced PM. This anisotropic character of spin fluctuations in PM may be relevant to the metamagnetic increase in magnetization upon increasing . Noting that the field-induced FM1 that is caused by the metamagnetic increase in magnetization does not reveal supeconductivity, it is expected that the onset of SC in UGe2 is mediated by the longitudinal fluctuations of ferromagnetic polarization in FM, which become significantly soft near where the first-order transition from FM2 to FM1 occurs.
This work was supported by a Grant-in-Aid for Creative Scientific Research i15GS0213), MEXT, and the 21st Century COE Program supported by Japan Society for the Promotion of Science. One of the authors (S. K.) has been supported by a Research Fellowship of the Japan Society for the Promotion of Science for Young Scientists.
References
- [1] S. S. Saxena, P. Agarwal, K. Ahilan, F. M. Grosche, R. K. W. Haselwimmer, M. J. Steiner, E. Pugh, I. R. Walker, S. R. Julian, P. Monthoux, G. G. Lonzarich, A. Huxley, I. Sheikin, D. Braithwaite and J. Flouquet: Nature 406 (2000) 587.
- [2] A. Huxley, I. Sheikin, E. Ressouche, N. Kernavanois, D. Braithwaite, R. Calemczuk and J. Flouquet: Phys. Rev. B 63 (2001) 144519.
- [3] D. Aoki, A. D. Huxley, E. Ressouche, D. Braithwaite, J. Flouquet, J. P. Brison, E. Lhotel and C. Paulsen: Nature 413 (2001) 613.
- [4] Y. Haga, M. Nakashima, R. Settai, S. Ikeda, T. Okubo, D. Araki, T. C. Kobayashi, N. Tateiwa and Y. Ōnuki: J. Phys.: Condens. Matter 14 (2002) L125.
- [5] N. Tateiwa, K. Hanazono, T. C. Kobayashi, K. Amaya, T. Inoue, K. Kindo, Y. Koike, N. Metoki, Y. Haga, R. Settai and Y. Ōnuki: J. Phys. Soc. Jpn. 70 (2001) 2876.
- [6] N. Tateiwa, T. C. Kobayashi, K. Hanazono, K. Amaya, Y. Haga, R. Settai and Y. Ōnuki: J. Phys.: Condens. Matter 13 (2001) L17.
- [7] T. C. Kobayashi, K. Hanazono, N. Tateiwa, K. Amaya, Y. Haga, R. Settai and Y. Ōnuki: J. Phys.: Condens. Matter 14 (2002) 10779.
- [8] C. Pfleiderer and A. D. Huxley: Phys. Rev. Lett. 89 (2002) 147005.
- [9] H. Kotegawa, S. Kawasaki, A. Harada, Y. Kawasaki, K. Okamoto, G.-q. Zheng, Y. Kitaoka, E. Yamamoto, Y. Haga, Y. Ōnuki, K. M. Itoh and E. E. Haller: J. Phys.: Condens. Matter 15 (2003) 2043.
- [10] H. Kotegawa, S. Kawasaki, A. Harada, Y. Kawasaki, K. Okamoto, G.-q. Zheng, Y. Kitaoka, E. Yamamoto, Y. Haga, Y. Ōnuki, K. M. Itoh and E. E. Haller: J. Magn. Magn. Mater. 272-276 (2004) E27.
- [11] H. Kotegawa, A. Harada, S. Kawasaki, Y. Kawasaki, Y. Kitaoka, Y. Haga, E. Yamamoto, Y. Ōnuki, K. M. Itoh, E. E. Haller and H. Harima: J. Phys. Soc. Jpn. 74 (2005) 705.
- [12] T. Moriya: J. Magn. Magn. Matter. 100 (1991) 261.
- [13] A. D. Huxley, S. Raymond and E. Ressouche: Phys. Rev. Lett. 91 (2003) 207201.