Line Widths of Single–Electron Tunneling Oscillations: Experiment and Numerical Simulations
Abstract
We present experimental and numerical results from a real-time detection of time-correlated single-electron tunneling oscillations in a one-dimensional series array of small tunnel junctions. The electrons tunnel with a frequency , where is the current and is the electron charge. Experimentally, we have connected a single-electron transistor to the last array island, and in this way measured currents from 5 fA to 1 pA by counting the single electrons. We find that the line width of the oscillation is proportional to the frequency . The experimental data agrees well with numerical simulations.
Keywords:
Coulomb blockade, single-electron tunneling, SET, array of tunnel junctions, time correlation, RF-SET:
03.75.Lm, 73.23.Hk, 74.81.Fa, 85.35.Gv1 Introduction
We have recently reported a measurement of a very small electrical current, , (5 fA–1 pA) by direct counting of the single electrons that tunnel through a one-dimensional series array of metallic islands separated by small tunnel junctions Bylander et al. (2005). At low temperature, and when the array junction resistance is greater than the Klitzing resistance, , charge is localized and an excess electron charge, , on one island polarizes the neighboring islands, thus repelling other electrons Likharev et al. (1989); Bakhvalov et al. (1989). This potential profile, extending over a distance of islands, is often called a ”charge soliton”; here and are the junction capacitance and island stray capacitance, respectively. Electrostatic repulsion creates a lattice of solitons in the array, which above a certain threshold voltage starts to move as a whole, leading to an oscillation of the potential of any island inside the array with the mean frequency
| (1) |
In Bylander et al. (2005), the current was injected through a tunnel junction from the array into the island of a single-electron transistor (SET) Likharev (1987); Fulton and Dolan (1987), a sensitive electrometer. The SET was embedded in a resonant circuit and operated in the radio-frequency mode (RF-SET) Schoelkopf et al. (1998). By monitoring the output signal from the RF-SET, we were able to detect the single-electron tunneling events in real time, and the power spectrum showed a peak at the frequency (1), thus demonstrating time correlation.
This type of electron counter can potentially be used to measure small currents with very good accuracy, and without any need for calibration since the only parameter involved in (1) is a natural constant.
In this paper we compare the measured spectral line widths with those obtained from a computer simulation.
2 Experimental techniques
We made the device out of Al/AlOx with an SET resistance of and charging energy K, where is Boltzmann’s constant. We obtained a small-signal charge sensitivity of and a bandwidth of MHz at an RF carrier frequency of MHz. The junction array, with junction parameters , fF and fF, had the charging energy K per junction, and a soliton size of islands (that is, ).
We performed the experiments in a dilution refrigerator at K and a parallel magnetic field of mT. The device was superconducting, but with a suppressed gap, K. At this field, the Josephson coupling energy is very small in our junctions: . Therefore Cooper pair tunneling is strongly suppressed, and we see only quasiparticles. Furthermore, we take advantage of the subgap resistance, , for an electron temperature K, estimated using parameters for electron–phonon coupling and Kapitza resistance Verbrugh et al. (1995). This makes the onset of current more gradual than in the normal state, thus reducing the sensitivity to bias voltage fluctuations.
3 Numerical methods
We have numerically simulated the electron transport in the array using a direct Monte Carlo method Likharev et al. (1989); Bakhvalov et al. (1989). We calculate the tunnel rates in each junction by using the ”orthodox” theory of single electron tunneling Averin and Likharev (1991), where the probability of a tunneling event per unit time is fully determined by the change in free energy of the system. The time step between such events is determined by a random variable that mimics the stochastic nature of tunneling. Below the superconducting gap, , we have phenomenologically introduced the subgap resistance, . For simplicity, however, we disregard the superconducting density of states above the gap. The simulations are idealized in the way that we disregard disorder and external noise, as well as bias fluctuations or drift.
We model the charge detection by sampling the potential of the last array island at a rate corresponding to the bandwidth of the circuit.
4 Results and discussion
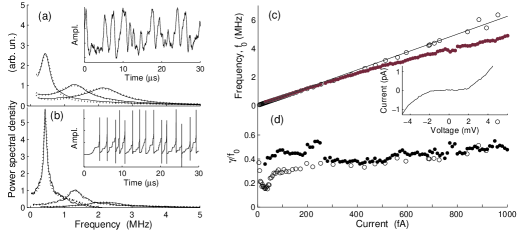
From the experimental data we have subtracted a background to account for amplifier and external noise, including an approximate term. Then, both experimental and numerical power spectra are fitted to the function,
| (2) |
a Lorentzian around a center frequency , with a half width , see Fig. 1(a–b). We find that agrees with (1), see Fig. 1(c), and that is proportional to the current: , see Fig. 1(d).
For fA, the measured peak is broad compared to the simulation, likely due to the difficulty in maintaining a stable bias for very small currents. We estimate the noise from the biasing circuitry and thermal EMF to be of the order of V, causing a current fluctuation of a few fA during the measurement time. The deviation from (1) in Fig. 1(c) for fA arises probably because of an increasing asymmetry of the peak, which causes the fit (2) to underestimate the frequency.
In conclusion, we have shown that the line width of the single-electron tunneling oscillations is proportional to the frequency, and that the line width extracted from our simulations agrees well with the experimental data.
References
- Bylander et al. (2005) J. Bylander, T. Duty, and P. Delsing, Nature, 434, 361–364 (2005).
- Likharev et al. (1989) K. Likharev, N. Bakhvalov, G. Kazacha, and S. Serdyukova, IEEE Trans. Magn., 25, 1436–1439 (1989).
- Bakhvalov et al. (1989) N. S. Bakhvalov, G. S. Kazacha, K. K. Likharev, and S. I. Serdyukova, Sov. Phys. JETP, 68, 581–587 (1989).
- Likharev (1987) K. Likharev, IEEE Trans. Magn., 23, 1142–1145 (1987).
- Fulton and Dolan (1987) T. A. Fulton, and G. J. Dolan, Phys. Rev. Lett., 59, 109–112 (1987).
- Schoelkopf et al. (1998) R. J. Schoelkopf, P. Wahlgren, A. A. Kozhevnikov, P. Delsing, and D. E. Prober, Science, 280, 1238–1242 (1998).
- Verbrugh et al. (1995) S. M. Verbrugh, M. L. Benhamadi, E. H. Visscher, and J. E. Mooij, J. Appl. Phys., 78, 2830–2836 (1995).
- Averin and Likharev (1991) D. V. Averin, and K. K. Likharev, in Mesoscopic phenomena in solids, edited by B. L. Altshuler, P. A. Lee and R. A. Webb, Amsterdam: Elsevier, 1991, pp. 173–272.