The glass transition of glycerol in the volume-temperature plane
Abstract
We assess the relative importance of spatial congestion and lowered temperature in the slowing dynamics of supercooled glycerol near the glass transition. We independently vary both volume, , and temperature, , by applying high pressure and monitor the dynamics by measuring the dielectric susceptibility. Our results demonstrate that both variables are control variables of comparable importance. However, a generalization of the concept of fragility of a glass-former shows that the dynamics are quantitatively more sensitive to fractional changes in than . We identify a connection between the fragility and a recently proposed density-temperature scaling which indicates that this conclusion holds for other liquids and polymers.
pacs:
64.70.Pf, 77.22.GmWhen a liquid is cooled below its melting point its viscosity increases very rapidly with decreasing temperature until it turns into a glass, with solid-like properties. For instance, glycerol, a typical glass-former, shows a remarkable increase in viscosity and relaxation time of 14 orders of magnitude as it is cooled from 350K to 180K at 1 atmosphere menon . There are two broad classes of explanations for this rapid increase of viscosity. One set of ideas identifies density as the crucial variable, arguing that the constraints on molecular rearrangements imposed by the dense packing in a liquid progressively increase due to the thermal contraction that accompanies cooling, until finally all motions are arrested in the glassy state. By this argument, the driving force for the rapid increase of viscosity in the case of glycerol would primarily be the 10% decrease in volume upon cooling. The second class of explanations for the slowing dynamics emphasizes the role of temperature: lowered temperature renders molecules too inactive to move around and surmount the energy barriers that impede exploration of their environment. In order to resolve the issue of whether it is temperature, , or volume, , that is the dominant variable in this phenomenon, experiments are required that independently control these variables. However, data of this kind are relatively sparse roland . The objective of the experiments reported in this Letter is to distinguish unambiguously the effects of constrained volume and lowered temperature, by using high pressure as a mean of independently changing the density of the liquid.
Glycerol is a widely-studied glass-former with broad industrial use. It is also an experimentally convenient sample: it has a high dielectric constant and does not easily crystallize. Moreover, some complementary high pressure data exist for glycerol herbst ; cook ; johari ; paluch . These studies are principally isothermal experiments in which temperature is fixed and pressure is varied in discrete steps; as such, these data are not optimal for studying temperature dependence. They also appear to disagree with each other on the temperature dependence of the relaxation frequency near the glass transition temperature, , defined as the temperature at which Hz. The temperature dependence is often characterized by the fragility, , defined by angell . The fragility thus quantifies deviation from the Arrhenius, or thermally-activated behaviour, and categorizes the temperature dependence of glass-formers under isobaric cooling as strong (small ) and fragile (large ). One set of high pressure experiments cook finds that the fragility of glycerol increases with high pressure while another johari finds no pressure dependence of the fragility. These results are not necessarily contradictory since they are taken in different frequency regimes, involving different degrees of extrapolation to infer the behaviour at . The present measurements go down to Hz, obviating the need to extrapolate down to in order to infer fragility. We have also performed an isobaric experiment by controlling pressure, , and studying the temperature dependence in detail. We have restricted ourselves to pressures below 1 GPa and taken data at several closely separated pressures to study changes in dynamics as functions of and as well.
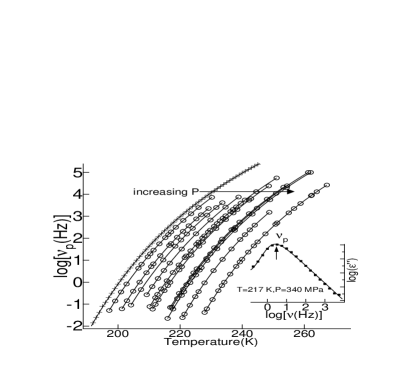
We employ a standard Teflon cap technique, widely used in high-pressure experiments walker . The pressure is inferred from the resistivity of a manganin coil immersed in the liquid. Manganin is an alloy whose resistivity as a function of and is known andersson . After the liquid is squeezed to a high pressure at room temperature, we cool it down to low temperatures. The dynamics of the liquid is studied by measuring the capacitance of a coaxial capacitor immersed in the liquid. We obtain the complex dielectric susceptibility for ranging from to Hz at each temperature. An example of the imaginary part of the response, is displayed in the inset of Fig. 1. We extract the characteristic relaxation frequency, , defined as the frequency of the peak in , at each and . In addition to the characteristic frequency, also yields the distribution of relaxation times and the ionic conductivity kzw_nm . In this Letter we focus on the dependence of on , , and . In Fig. 1 we display vs. for 12 different pressures. As is evident from the figure, pressure has a strong effect on relaxation dynamics: our maximum pressure of about 1 GPa decreases the relaxation frequency at a fixed temperature by about seven decades.
Turnbull and Cohen turnbull proposed a theory in which the slowing dynamics in a supercooled liquid is due to reduced free volume at low temperature. Free-volume theory predicts that the viscosity at a fixed temperature is given by where is the molecular volume and the free volume. The temperature dependence of was computed by Cohen and Grest cohen who derived a formula for the viscosity at a fixed pressure. Using the Einstein-Debye relation, , where is a constant with the dimension of volume, we compare this prediction to the data in Fig. 1. While the fit is good, the fit parameters lead to a prediction for a mean molecular volume of Å3, in excess of length scales from neutron scattering dawidowski or even of a simple estimation of Å3 from the mass density and molar mass.
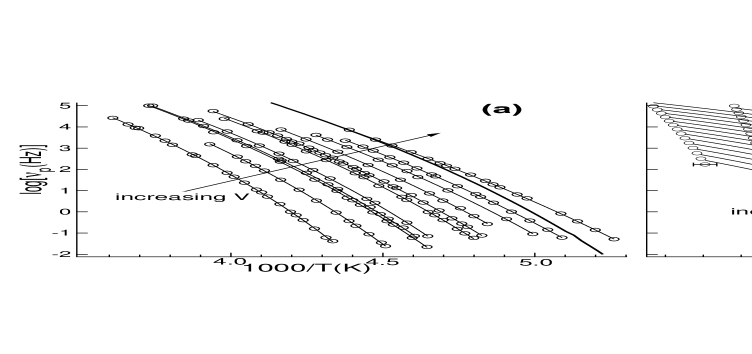
A much more direct way to test free-volume theory is to study the dynamics when the volume – and therefore the free volume – is held fixed. Using an empirical equation of state for glycerol we calculate kzw_nm the volume corresponding to each and in Fig. 1. This yields the isochoric and isothermal plots shown in Fig. 2. Free-volume theory predicts turnbull that the viscosity varies only weakly with temperature () at constant volume. Fig. 2(a) shows that the isochoric change of with respect to temperature is a factor of , much faster than the factor of predicted by the free volume model.
It is clear from Fig. 2(a) that even when the volume is constant, the dynamics remains strongly temperature dependent. Indeed, we observe from Fig. 2(a) that the 1 atmosphere isobaric curve has only a slightly stronger temperature dependence compared to nearby isochoric curves. This means that there is only a small volume contribution to the slowing dynamics when the liquid is supercooled along the 1 atmosphere isobar. This observation has led Ferrer et al. ferrer to conclude that temperature is overwhelmingly more important than volume. Does this more generally imply that temperature is the dominant variable in the glass transition and that the effects of volume are secondary?
To address this question we isolate the role of volume that of temperature by in an isothermal plot, such as the one shown in Fig. 2(b) in which volume is varied, holding fixed. We observe in Fig. 2(b) that changes strongly with , faster than . There appears to be greater variation in in the isochoric cases, however we point out that increases only 14% in Fig. 2(b) whereas increases by 54% in Fig. 2(a).
To assess the relative contribution of and it is therefore important to take into account equivalent fractional changes in these variables. To this end we compare for some with for the same . This leads us to consider the variables, and . When evaluated at Hz, is the isothermal fragility with respect to and the isochoric fragility with respect to . We call these quantities the generalized fragilities by analogy to the traditional fragility, , which compares glass formers with different because measures the rate of slowing dynamics only after scaling out the material-dependent . Likewise and compares the rate of change of in and directions only after scaling out the relevant variables. Furthermore, the variables and are manifestly symmetric in and .
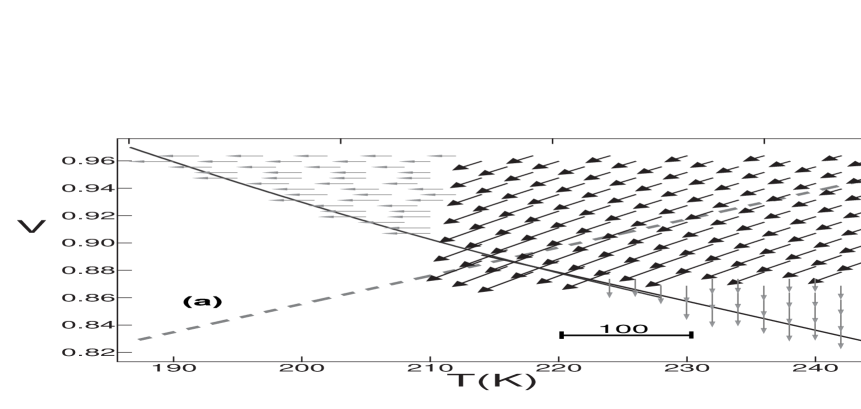
We display in Fig. 3(a) the vector field plotted in the V-T plane. At all places where we can evaluate and , they are comparable: . Thus the effects on relaxation frequency of equal fractional changes in volume or temperature are comparable over the entire experimental range, and neither variable can be neglected. While neither variable is overwhelmingly dominant, it is clear that over the experimentally accessible region. Thus relaxation frequencies are more sensitive to fractional changes in than everywhere in the V-T plane. In particular, the data indicate that this is also true for the 1 atmosphere isobaric glass transition at K, . While we can only directly measure at (192,0.959) a linear extrapolation of to the smallest temperature in Fig. 3(a) shows that .
There are two opposing factors affecting the fragilities as one moves along the glass line towards high densities: increasing reduces fragility while decreasing makes it bigger. It is clear from Fig. 3(a) that the latter effect dominates, inasmuch isochoric and isothermal fragility both increase along the glass transition line towards lower or lower . The increase of isochoric fragility, , with density is an additional indicator of greater sensitivity to changes in than . We have observed that the width of the relaxation too, increases more rapidly in the direction than the direction kzw_nm .
Are these results specific to glycerol? We address this issue by means of a density-temperature scaling suggested by Casalini and Roland casalini and also Alba-Simionesco et al. alba . For several liquids and polymers they found that where and the function are material dependent. Next, we observe that this scaling exponent is equal to the ratio of the generalized fragilities: . This scaling for our data is shown in the Fig. 3(b) with ; this is less than 1.8 obtained using the data of Cook et al. cook by Ref. dreyfus . The scaling in Fig. 3(b) is by no means perfect, reflecting the fact that is not constant. For a power-law potential, , the scaling is exact. However, in the more complicated situation of a molecular liquid, one should not be surprised if the scaling is inexact because changes in density – and consequently the intermolecular spacing – will emphasize different parts of the potential. Nevertheless, to the extent that this scaling is even approximately successful over a limited range of data, implies that . There are 25 liquids with and only one (sorbitol) with roland . Therefore is observed for a wide range of liquids. The greater sensitivity of relaxation dynamics to fractional volume changes is thus not limited to glycerol, and appears to be typical rather than exceptional.
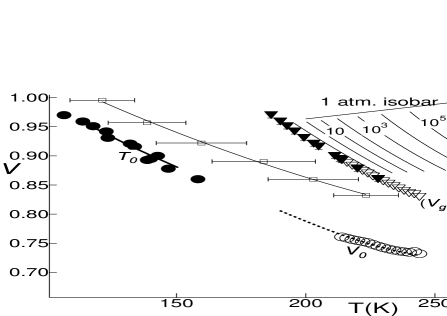
We summarize the new data for glycerol in Fig. 4 as a set of constant relaxation frequency curves in the V-T plane. The glass transition line (0.01 Hz) is formed by and extracted from Fig. 2. The constant frequency curves get denser towards lower frequencies. Apart from the constant frequency lines in the experimentally accessible regime we also indicate in Fig. 4 extrapolations to the zero frequency limit. The solid circles represent from VFTH fits to isochoric data and the open circles from Doolittle fits to isothermal data. While the existence of a finite temperature or finite volume structural arrest depend solely on extrapolations, it is worth pointing out that these two independent extrapolations support each other in that they appear to produce a continuous curve. With the available data the value of appears to be increasing in an unbounded way at high densities. This agrees with the expectation that an extremely compressed system will resemble a hard sphere liquid, where . This limit is approached along a concave curve, as in attractive colloidal systems trappe . Clearly, even broader explorations in the V-T plane of both dynamics and of the Kauzmann entropy crisis would be useful in assessing the role of and . We end by recapitulating our principal result: neither axis on this plane may be neglected in understanding supercooled glycerol.
We acknowledge support from the NSF-DMR and the MRSEC at UMass. We thank R. Krotkov, S. Brown, I. R. Walker, A. Husmann, and J. Hu for conversations regarding experimental issues and W. Pollard for his skilled machining. Manganin was generously supplied by Isabellenhütte, Germany, via their U.S. distributor, Isotek. N.M. gratefully acknowledges several inspiring discussions with D. Kivelson. K.Z.W. thanks C. M. Roland and R. Casalini for useful conversations.
References
- (1) N. Menon, K. P. O’Brien, P. K. Dixon, L. Wu, S. R. Nagel, B. D. Williams, and J. P. Carini, Jour. Non-Crys. Solids. 141, 61 (1992).
- (2) C. M. Roland et al., Rep. Prog. Phys. 68, 1405 (2005).
- (3) C. A. Herbst, R. L. Cook, and H. E. King Jr, Nature 361, 518 (1993).
- (4) R. L. Cook et al., J. Chem. Phys. 100, 5178 (1993).
- (5) G. P. Johari and E. Whalley, Faraday Symp. Chem. Soc. 6, 23 (1972).
- (6) M. Paluch et al., J. Phys.: Condens. Mat. 8, 10885 (1996).
- (7) C. A. Angell in Relaxations in Complex Systems, K. L. Ngai and G. B. Wright Eds. (U.S. Dept. of Commerce, Springfield, 1985), p. 3.
- (8) Kyaw Zin Win and Narayanan Menon, in preparation.
- (9) I. R. Walker, Rev. Sci. Instrum. 70, 3402 (1999).
- (10) O. E. Andersson and B. Sundqvist, Rev. Sci. Instrum. 68, 1345 (1997).
- (11) D. Turnbull and M. H. Cohen, J. Chem. Phys. 31, 1164 (1959).
- (12) M. H. Cohen and G. S. Grest, Phys. Rev. B. 20, 1077 (1979).
- (13) J. Dawidowski et al., Phys. Rev. E. 53, 5079 (1996).
- (14) M. L. Ferrer et al., J. Chem. Phys. 109, 8010 (1998).
- (15) R. Casalini and C. M. Roland, Phys. Rev. E. 69, 062501 (2004).
- (16) C. Alba-Simionesco et al., Europhy. Lett. 68, 58 (2004).
- (17) C. Dreyfus et al., Eur. Phys. J. B 42, 309 (2004).
- (18) V. Trappe et al., Nature 411, 772 (2001).