Disproportionation and Critical Interaction Strength in NaxCoO2: Concentration Dependence
Abstract
We present results of studies of charge disproportionation (CD) and spin differentiation in NaxCoO2 using the correlated band theory approach (local-density approximationHubbard U:LDA+U). The simultaneous CD and gap opening can be followed through a first order charge disproportionation transition. By comparison with experiments, we propose a value of the Coulomb repulsion strength U() that has significant dependence on the carrier concentration , for which we obtain a phase diagram. The connection between the oxygen height and effects of on-site correlation is also reported.
pacs:
71.20.-b,71.20.Be,71.27.+aSince the discovery of superconductivity with Tc 4 K in water-intercalated NaxCoO2 (NxCO) by Takada et al. in the early of 2003,takada several hundred papers have been published. The system shows several similarities to high Tc superconducting cuprates: layered transition metal oxide; vicinity of (presumed) Mott insulator CoO2; variation with carrier concentration ; a “superconducting dome.” However, it also has differences from cuprates: electron-doped system from Mott insulator phase, actually nonmagnetic metallic sister phase, triangular lattice which can be frustrated, different superconducting dome shape, and low Tc.
In addition to its interesting properties in view of superconductivity, its normal state has a rich phase diagram depending on carrier concentration .foo For the Pauli-like susceptibility has been observed, while for the susceptibility shows local moment (Curie-Weiss) behavior. For , NxCO shows antiferromagnetic (AFM) alignment of ferromagnetically ordered CoO6 layers.x075 Specifically at =0.5, the system has been observed to undergo a charge disproportionation (2Co Co3++Co4+) and metal-insulator transition at 50 K, while the rest of the phase diagram is metallic.foo
We have focused on normal state electronic and magnetic structure of NxCO, with specific interest in ordering near the ground state, and characterizing the strength and consequences of correlation effects. In transition metal oxides in general, the mechanism of charge ordering or charge disproportionation (CD) is an important issue, and our work provides new inroads in the understanding of the mechanisms of disproportionation.
Our calculations were based on the supercell approach,prb04 ; prb05 using the full-potential local-orbital method (FPLO).klaus Both popular schemes for LDA+U functional were monitored. (The intra-atomic exchange integral =1 eV was left unchanged.) Both have the same Hubbard-like density-density interaction, but differ in just how to subtract out “double counting” of the pair interaction. One way, the so-called Fully Localized Limit (or Atomic Limit),ldau1 is an atomic-like treatment and is appropriate for large on-site Coulomb repulsion U, e.g. strong localization of the correlated orbital. Another is often called the Around Mean Fieldldau2 and is more appropriate when U is not so strong. In this sodium cobaltate, our calculations have shown similar results from both schemes.
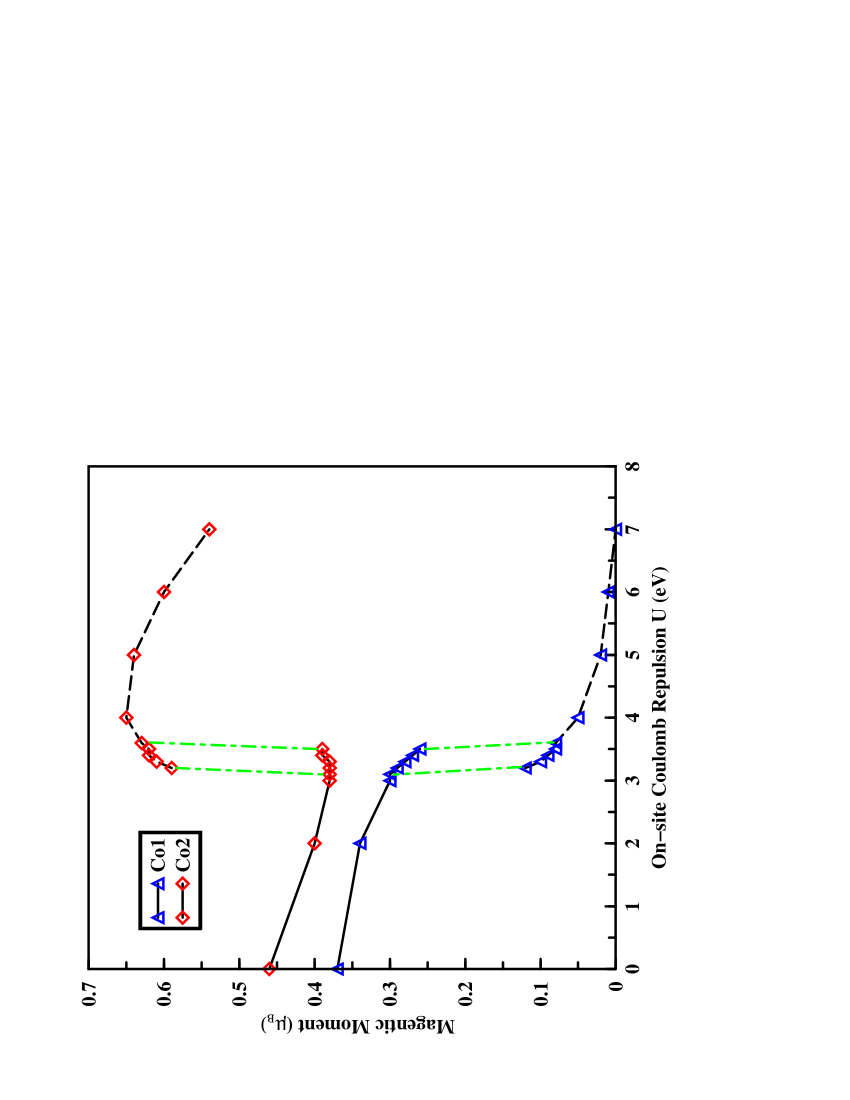
Within the local density approximation (LDA), all Co magnetic moments are nearly equivalent, that is, there are only Co(4-x)+ ions. The distorted Co-O6 edge-sharing and the layered structures make t2g manifold split into ag+e. Upon introducing U (there is no agreement on the best values), both magnetic moments decrease linearly at small U. At a critical value Uc, the moments change discontinuously due to a first-order transition: the state with similar magnetic moments no long is a solution, and the new state shows changes in moments just as expected from charge disproportionation Co(4-x)+Co3++Co4+. This change occurs simultaneously with metal-insulator transition associated with the Mott transition of the orbital. Before CD, the band has a similar band center and width as the doubly degenerate e band.
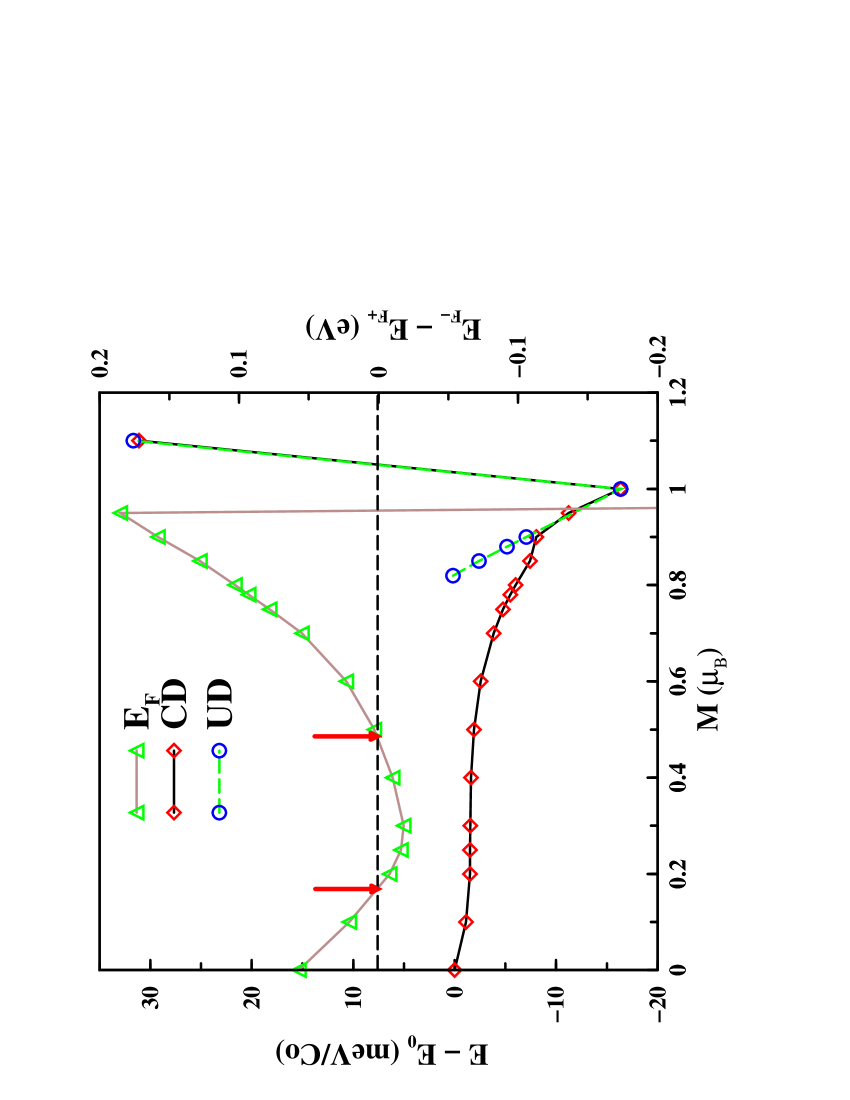
One example of this CD is shown in Fig. 1 for , note that it is possible to follow hysteresis within the region 3.2 3.6 eV and outside this range only one of the states, CD or undisproportionated (UD), is obtained. The two solutions can be observed in another way, using fixed spin moment (FSM) calculations within LDA+U in the critical region (bottom panel of Fig. 1). In this method, the energy is calculated versus a constrained value of the total moment, and the energy versus total magnetic moment plot becomes two curves, in which one state or the other is reached depending on starting point. Compared with LDA FSM results by Singh,singh our LDA+U FSM shows two differences that are worthy of note. First, at , this system is antiferromagnetic (AFM) with Co magnetic moment 0.34 ; Singh started from a nonmagnetic state at =0 and kept all Co ions identical. Secondly, at small , the energy vs. total moment plot is nearly flat, but having two extrema [stable at and unstable at ]. Due to the miniscule energy barrier, this small net moment minimum will not be accessible experimentally.
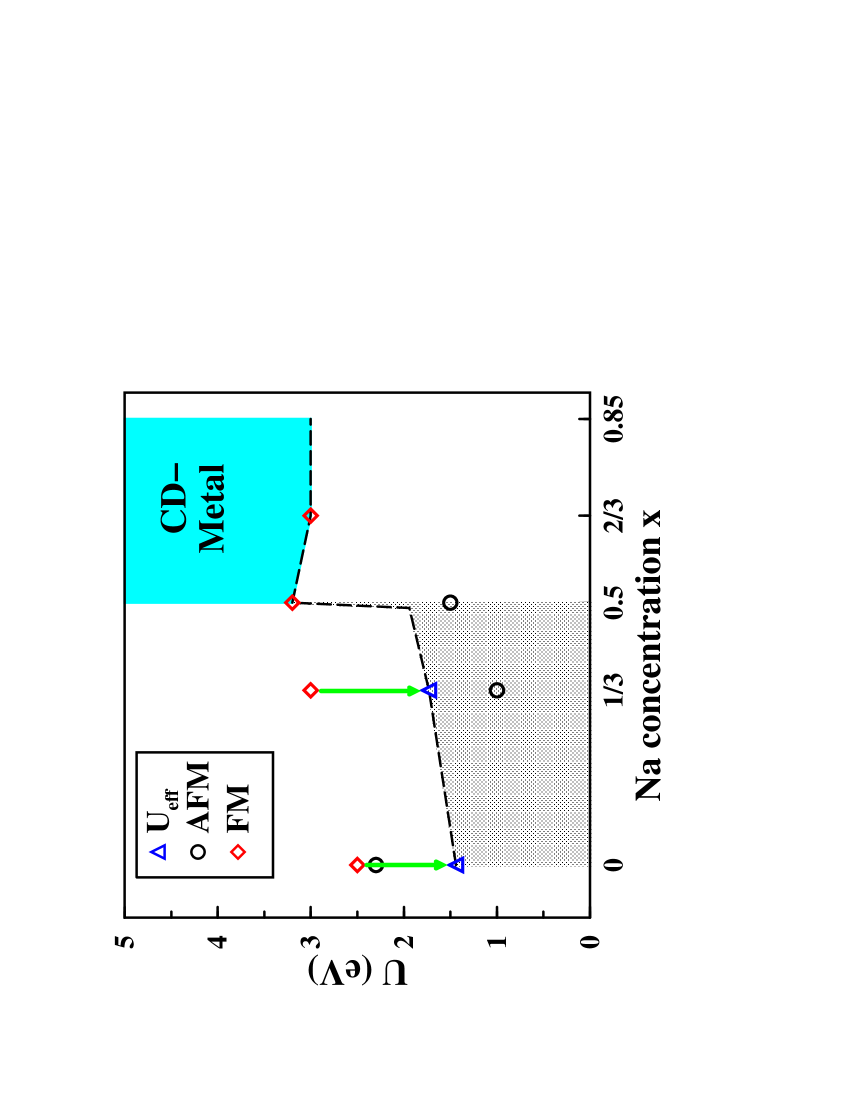
As shown in Fig. 2 and described in the caption, the critical value Uc for disproportionation depends on the carrier concentration and the type of magnetic order. In the lower half of the range , Uc increases linearly for ferromagnetic (FM) ordering. However, allowing AFM ordering, Uc() shows somewhat complicated behavior. While Uc for both FM and AFM is almost identical at , the value for presumed AFM order decreases sharply for x0. From Fig. 2, Uc for AFM is smaller by 2 eV than that of FM for =1/3 and =1/2. (note Uc 1 eV for AFM at 1/3). [The supercells we used do not allow for combined disproportionation and AFM ordering for 2/3.]
Furthermore, comparison with experiments suggests that U() is significantly dependent on the carrier concentration . First, no observation of CD nor any significant correlation effects at all for indicates that U() is less than Uc. However, the study of Gunnarsson and coworkers shows that in a N-multiband system the effective Coulomb repulsion becomes Ueff=U/.gunnarsson Below Uc, the band is only distinguishable from the manifold (in energy) by lying slightly higher, and hosting most of the holes. As a result the system at maintains multiband (three-band) behavior, resulting in U=Uc/ 1.4 eV and 1.7 eV for and , respectively. Since only a tiny band gap ( 15 meV) is observed at ,wang U() must be near the minimum value for CD, i.e. eV. For , the observed Curie-Weiss susceptibility indicates Co4+ and Co3+ ions, so that the charge is disproportionated even though the system is a good metal.mukhamedshin Thus, U() is above 3 eV, perhaps over 4 eV. We will discuss this =0.5 state elsewhere. It remains for further research to decide how accurately LDA+U should be for the band gap, or whether dynamics of the correlations are important.
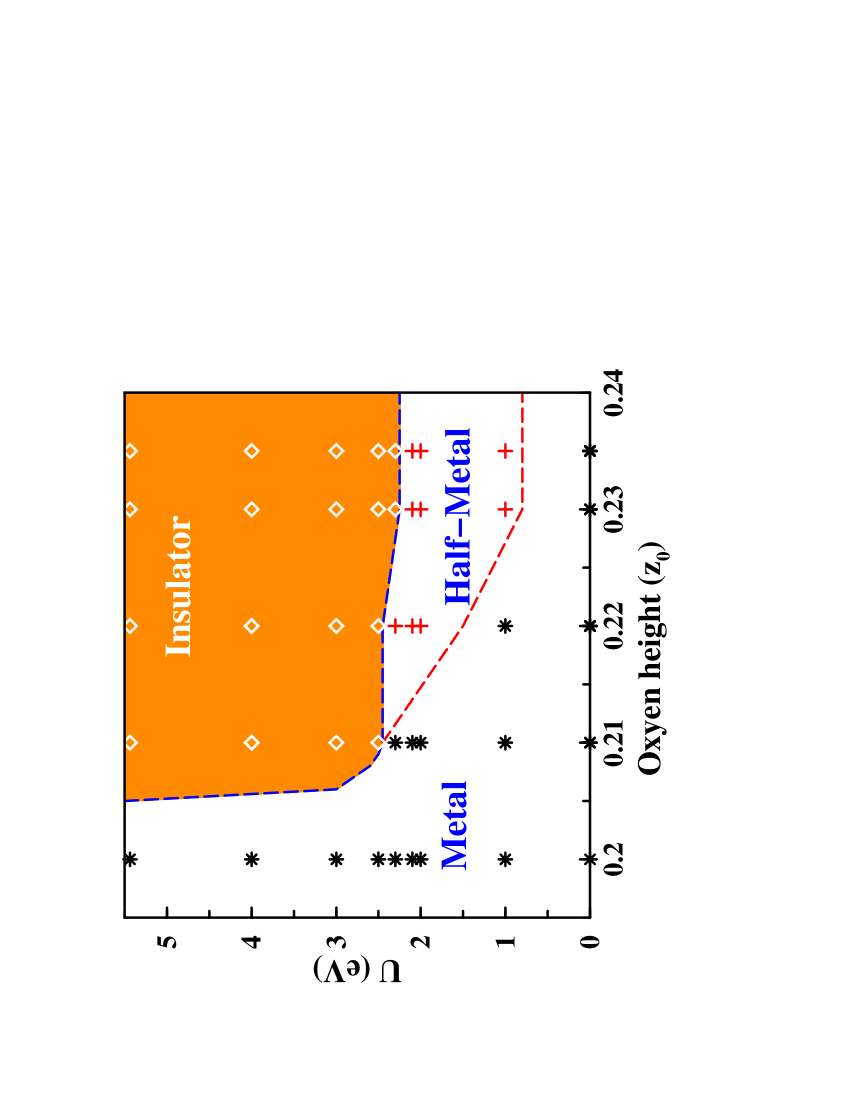
Another issue which is drawing attention in these cobaltates is whether the change of O height (i.e., Co-O bond-length) is important as the carrier concentration increases. Johannes et al. have calculated the oxygen height by energy minimization, and concluded that the change has little effect in the range .johannes However, their calculations, and therefore conclusions, are confined to the local density approximation results and predictions. We have carried out a study at =0 to address whether correlation effects described by the LDA+U method are affected by the oxygen height. Figure 3 shows phase diagram in the relevant portion of the U - plane in the relevant range of U and allowing FM ordering of the system.
For , the system undergoes a metal-insulator transition, implying CD, as U is increased. The critical value Uc depends little on O height. In fact, Uc is only 0.1 eV between and , which is the same variation of O height as measured between and . This result suggests that the critical value Uc for CD is little affected by O height in this system. In addition, it is worthwhile to note that a metal to half-metal transition occurs even for very small U before the transition to insulator (for example, at U=1 eV for ).
Note however that for a height =0.20, no CD is obtained for U up to 5.5 eV, much different from the behavior for . So while this bondlength lies outside the accessible range, it does show that there is a regime where correlation effects depend very strongly on the Co-O bond length, and that the system is not so far from that regime. Finally, we note that the transitions with varying U discussed here should be of special interest for high pressure research because, for a system near Uc, varying U will be analogous to applying pressure to change U/W ratio (W is the correlated orbital’s bandwidth).
We acknowledge important collaboration with J. Kuneš in the earlier stages of this work, and have had helpful communications with M. D. Johannes, P. Novak, R. T. Scalettar, D. J. Singh, R. R. P. Singh, and J. M. Tarascon. This work was supported by DOE grant DE-FG03-01ER45876 and DOE’s Computational Materials Science Network. W. E. P. acknowledges support of the Department of Energy’s Stewardship Science Academic Alliances Program.
References
- (1) K. Takada et al., Nature 422, 53 (2003).
- (2) M. L. Foo et al., Phys. Rev. Lett. 92, 247001 (2004).
- (3) L. M. Helme et al., Phys. Rev. Lett. 94, 157206 (2005); S. P. Bayrakci et al., Phys. Rev. Lett. 94, 157205 (2005).
- (4) K.-W. Lee et al., Phys. Rev. B 70, 045104 (2004); Phys. Rev. Lett. 94, 026403 (2005).
- (5) K.-W. Lee and W. E. Pickett, cond-mat/0505606 (2005).
- (6) K. Koepernik and H. Eschrig, Phys. Rev. B 59, 1743 (1999).
- (7) M. T. Czyzyk and G. A. Sawatzky, Phys. Rev. B 49, 14211 (1994).
- (8) V. I. Anisimov et al., Phys. Rev. B 48, 16929 (1993).
- (9) D. J. Singh, Phys. Rev. B 68, 020503 (2003).
- (10) K.-W. Lee and W. E. Pickett, unpublished.
- (11) O. Gunnarsson et al., Phys. Rev. B 56, 1146 (1997).
- (12) N. L. Wang et al., Phys. Rev. Lett. 93, 147403 (2004).
- (13) I. R. Mukhamedshin et al., Phys. Rev. Lett. 94, 247602 (2005).
- (14) M. D. Johannes et al., Europhys. Lett. 68, 433 (2004); Phys. Rev. B 71, 214410 (2005).