Behavior of rod-like polyelectrolytes near an oppositely charged surface
Abstract
The behavior of highly charged short rod-like polyelectrolytes near oppositely charged planar surfaces is investigated by means of Monte Carlo simulations. A detailed microstructural study, including monomer and fluid charge distribution, and chain orientation, is provided. The influence of chain length, substrate’s surface-charge-density and image forces is considered. Due to the lower chain-entropy (compared to flexible chains), our simulation data show that rod-like polyelectrolytes can, in general, better adsorb than flexible ones do. Nonetheless, at low substrate-dielectric-constant, it is found that repulsive image forces tend to significantly reduce this discrepancy.
pacs:
82.35.Gh, 82.35.Rs, 61.20.Qg, 61.20.JaI Introduction
Polyelectrolyte (PE - i.e., charged polymer) adsorption on charged surfaces is a versatile process having industrial as well as biological applications. In particular, the case of rod-like (stiff) PEs, which corresponds to the situation of short DNA fragments or other similar biomaterials, has some relevance for biological processes such as gene therapy Raedler_Science_1997 or biotechnology. Fodor_Science_1997 ; Pfohl_Langmuir_2001 ; Pfohl_ChemPhChem_2003
From a theoretical viewpoint, the behavior of stiff PEs near an oppositely charged surface has been studied by various authors on a mean-field level. Hoagland_Macromol_1990 ; Menes_EPL_1998 ; Menes_EPJE_2000 ; Sens_PRL_2000 ; Fleck_PRE_2001 ; Netz_JPCM_2003 ; Cheng_JCP_2003 Menes et al. Menes_EPJE_2000 considered the interaction between two infinitely long charged rods near a salty surface in the framework of the Debye-Hückel theory. Due to the low dimensionality of the system they reported an algebraic decay for the effective interaction that was confirmed by their Brownian dynamics simulations. Menes_EPJE_2000 The more simple and fundamental situation of a single and infinitely long charged rod in the vicinity of a charged surface was investigated by several authors. Menes_EPL_1998 ; Sens_PRL_2000 ; Fleck_PRE_2001 The problem of the so-called “counterion release” (i.e., “Manning decondensation”) from a rigid PE approaching an oppositely charged was examined by Sens and Joanny Sens_PRL_2000 and by Fleck and von Grünberg Fleck_PRE_2001 using Poisson-Boltzmann Theory. In a similar spirit, Menes et al. Menes_EPL_1998 found that the screening of the adsorbed charged rod’s field, due to counterions and mobile surface charges, is highly sensitive to the degree of membrane’s surface charging. The adsorption of short rod-like PEs was also considered by some researchers. Hoagland_Macromol_1990 ; Cheng_JCP_2003 Recently, Cheng and Olvera de la Cruz Cheng_JCP_2003 investigated the adsorption/desorption transition including lateral correlations by assuming a regular flat lattice for the adsorbed charged rods. This latter assumption is only valid when the electrostatic rod-surface binding is strong enough. Closely related to our problem, Hoagland Hoagland_Macromol_1990 analyzed the monomer concentration profile as well as the chain-orientation with respect to the charged substrate’s surface for a single short rod-like PE. The notorious complication of image forces stemming from the dielectric discontinuity between the substrate and the solvent was also addressed by some authors. Sens_PRL_2000 ; Netz_JPCM_2003 ; Netz_Macrom_1999 More specifically, for low dielectric constant (i.e., repulsive image forces) and fixed surface-ions of the substrate: (i) Sens and Joanny Sens_PRL_2000 showed that the condensed counterions are not always released as the stiff PE approaches the substrate and (ii) Netz Netz_JPCM_2003 showed an extra decrease of the charge dissociation of the stiff PE (i.e., charge regulation in salty solution nearby an uncharged polarized interface).
Since those studies Hoagland_Macromol_1990 ; Sens_PRL_2000 ; Netz_JPCM_2003 were realized in the framework of the Poisson-Boltzmann theory and for a single chain, the relevant phenomenon of charge reversal of the substrate’s surface-charge by the adsorbed PEs can not be captured.
In this paper, we propose to elucidate the microstructural behavior of (very) short rod-like PEs near an oppositely charged surface by using Monte Carlo (MC) computer simulations. The effect of image forces is also systematically investigated. To better understand the effect of chain-entropy, a comparison with the previous work of Messina Messina_PRE_2004 concerning fully flexible PEs is carried out. Our article is organized as follows: The simulation model is detailed in Sec. II. Our results are presented in Sec. III, and concluding remarks are provided in Sec. IV.
II Model and Parameters
II.1 Simulation model
The model system under consideration is similar to that recently investigated for the adsorption of flexible chains. Messina_macromol_2004 ; Messina_PRE_2004 Within the framework of the primitive model we consider a PE solution near a charged hard wall with an implicit solvent of relative permittivity (i.e., water at ). The substrate located at is characterized by a relative permittivity which leads to a dielectric jump (when ) at the interface (positioned at ) defined as
| (1) |
The negative bare surface-charge density of the substrate’s interface is , where is the (positive) elementary charge and is the number of charges per unit area. The latter is always electrically compensated by its accompanying monovalent counterions of charge (i.e., monovalent cations with ) of diameter . Rod-like PE chains are made up of monovalent positively charged monomers () of diameter . The bond length is also set to so that the length of a rod-like PE is . The counterions (monovalent anions: ) of the PEs are also explicitly taken into account with the same parameters, up to the charge-sign, as the substrate’s counterions. Hence, all the constitutive microions are monovalent () and monosized with diameter . All these particles are immersed in a rectangular box. Periodic boundary conditions are applied in the directions, whereas hard walls are present at (location of the charged interface) and (location of an uncharged wall). It is to say that we work in the framework of the cell model.
The total energy of interaction of the system can be written as
where the first (single) sum stems from the interaction between a microion [located at with ] and the charged interface, and the second (double) sum stems from the pair interaction between microions and with . All these contributions to in Eq. (II.1) are described in detail below.
Excluded volume interactions are modeled via a hardcore potential defined as follows
| (3) |
for the microion-microion one, and
| (4) |
for the interface-microion one.
The electrostatic energy of interaction between two microions and reads
| (5) |
where is the Bjerrum length corresponding to the distance at which two protonic charges interact with , and is given by Eq. (1). The first term in Eq. (5) corresponds to the direct Coulomb interaction between real microions, whereas the second term represents the interaction between the real microion and the image of microion . By symmetry, the latter also describes the interaction between the real microion and the image of microion yielding an implicit prefactor in Eq.(5). The electrostatic energy of interaction between a microion and the (uniformly) charged interface reads
| (6) |
The second term in Eq.(6) stands for the self-image interaction, i.e., the interaction between the microion and its own image. An appropriate and efficient modified Lekner sum was utilized to compute the electrostatic interactions with periodicity in two directions. Brodka_MolPhys_2002 This latter technique was already successfully applied to the case of PE multilayering Messina_macromol_2004 and polycation adsorption. Messina_PRE_2004 To link our simulation parameters to experimental units and room temperature (K) we choose Å leading to the Bjerrum length of water Å. In order to investigate the effect of image forces we take a value of for the dielectric constant of the charged substrate (which is a typical value for silica or mica substrates Malinsky_JPCB_2001 ) and for that of the aqueous solvent yielding . The case of identical dielectric constants () corresponds to the situation where there are no image charges.
| Parameters | |
|---|---|
| room temperature | |
| charge number of the substrate | |
| dielectric discontinuity | |
| microion valence | |
| Å | microion diameter |
| Å | Bjerrum length |
| -box length | |
| -box length | |
| number of rod-like PEs | |
| number of monomers per rod-like chain |
All the simulation parameters are gathered in Table 1. The set of simulated systems can be found in Table 2. The equilibrium properties of our model system were obtained by using standard canonical MC simulations following the Metropolis scheme. Metropolis_JCP_1953 ; Allen_book_1987 In detail:
-
•
Single particle (translational) moves were applied to the counterions (i.e., anions and cations) with an acceptance ratio of .
-
•
As far as trial moves for the rod-like PEs are concerned and given the anisotropy of these objects, random translational moves as well as rotational ones were performed at the same frequency. Blaak_JCP_1999 Random rotational moves were achieved by choosing randomly new orientation-vectors of the rod-like particles. This method is (i) computationally not too demanding, (ii) leads to an efficient configurational space sampling and (iii) fulfills the rules of detailed-balance. The acceptance ratio was also set to .
The total length of a simulation run is set to MC steps per particle. Typically, about MC steps were required for equilibration, and MC steps were used to perform measurements.
| System | |||
|---|---|---|---|
II.2 Measured quantities
We briefly describe the different observables that are going to be measured. In order to study the PE adsorption, we compute the monomer density that is normalized as follows
| (7) |
To further characterize the PE adsorption, we also compute the total number of accumulated monomers within a distance from the charged interface that is given by
| (8) |
It is useful to introduce the fraction of adsorbed monomers, , which is defined as follows
| (9) |
The orientation of the rod-like PEs can be best monitored by the angle formed between the -axis and the PE-axis. Hoagland_Macromol_1990 A convenient quantity is provided by its second order Legendre polynomial:
| (10) |
where corresponds to the smallest wall-monomer distance for a given PE. Thereby
| (11) |
takes the values , 0, and +1 for PEs that are perpendicular, randomly oriented, and parallel to the -axis, respectively.
Another relevant quantity is the global net fluid charge which reads
| (12) |
where and stand for the density of all the positive microions (i.e., monomers and substrate’s counterions) and negative microions (i.e., PEs’ counterions), respectively. The corresponding reduced surface charge density is given by:
| (13) |
Thereby, corresponds, up to a prefactor , to the net fluid charge per unit area (omitting the surface charge density of the substrate) within a distance from the charged wall. At the uncharged wall, electroneutrality imposes . By simple application of the Gauss’ law, is directly proportional to the mean electric field at . Therefore can measure the screening strength of the substrate by the neighboring solute charged species.
III Results and discussion
It is well known that the effects of image forces become especially relevant at low surface charge density of the interface. Furthermore, it is also clear that the self-image interaction (repulsive for , as is presently the case) is higher the higher the charge of the ions (polyions). Hence, we are going to study (i) the influence of chain length (Sec. III.1) and (ii) that of surface charge density (Sec. III.2). For the sake of consistency, we set the total number of monomers to meaning that the monomer concentration is fixed leading to a PE volume fraction (see also Table 2).
III.1 Influence of chain length
In this part, we consider the influence of chain length at fixed surface-charge-density parameter . The latter would experimentally correspond to a moderate Tulpar_JPCB_2004 surface charge density with . The chain length is varied from up to (systems , see Table 2). We have ensured that, for the longest chains with , finite size effects are not important since there which is significantly smaller than or .
III.1.1 Monomer distribution
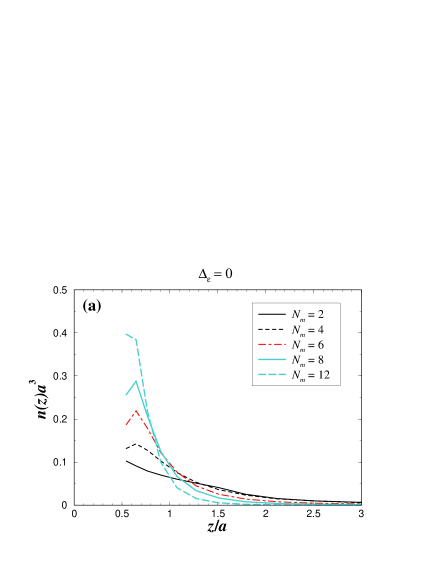
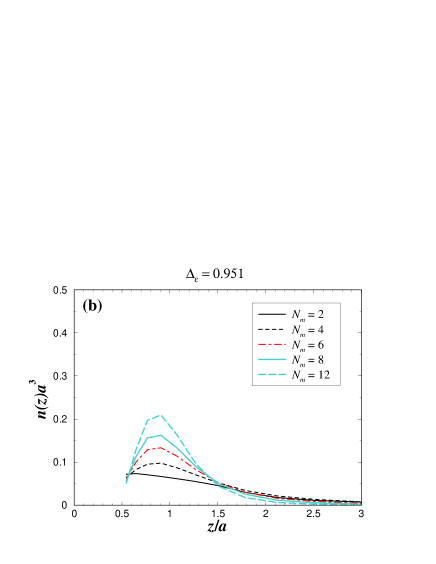
The profiles of the monomer distribution can be found in Fig. 1 and the corresponding microstructures are sketched in Fig. 2. When no image charges are present [ - Fig. 1(a)], the monomer-density profile exhibits a monotonic behavior for very short rigid chains (here ). For longer chains there exits a small monomer depletion near the charged wall for an intermediate regime of (here ). At high enough enough (here ) our simulation data reveal again a monotonic behavior of . This interesting behavior is the results of two antagonistic driving forces, namely (i) chain-entropy and (ii) the electrostatic wall-monomer attraction. More precisely, the mechanisms responsible for this -induced reentrant behavior at are as follows:
-
•
For very short chains (here ) chain-entropy effects are negligible so that one gets a similar behavior to that of point-like counterions with the usual monotonic decaying -profile.
-
•
The chain-entropy loss (per chain) by adsorption should typically scale like whereas the electrostatic wall-chain attraction scales like explaining why at high enough a purely effective attractive wall-monomer interaction is recovered.
Upon polarizing the charged interface [ - Fig. 1(b)] the PE adsorption becomes weaker and the -profile more broadened due to the repulsive image-polyion interaction. For , presents a maximum at that can be seen as the thickness of the adsorbed PE layer. Interestingly, the monomer density at contact decreases with increasing . This is the result of a combined effect of (i) chain-entropy loss near the interface and (ii) the -induced image-polyion repulsion. All those features are well illustrated on the microstructures of Fig. 2.
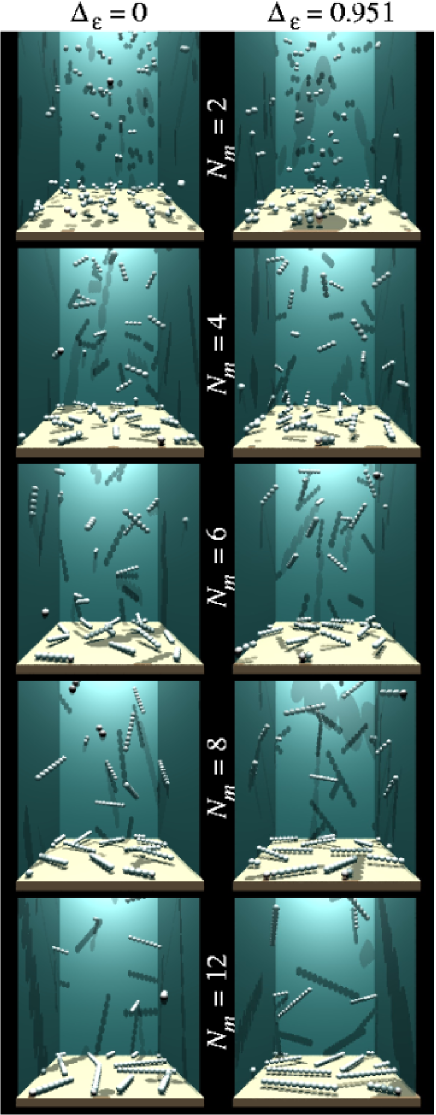
It is instructive to compare the above findings with those obtained for fully flexible chains. To do so, we use existing MC data for flexible chains from our previous work Messina_PRE_2004 where all the parameters, up to the chain flexibility, are identical with those presently employed for rod-like PEs. The comparison is provided in Fig. 3. At [see Fig. 3(a)], the -profiles for flexible and rigid PEs are quasi-identical for as it should be. For longer chains (), we clearly see at that the degree of adsorption as indicated by the value of near contact is considerably stronger for rigid chains. This feature is due to entropy and electrostatic effects. Indeed, in the bulk and at given degree of polymerization , the chain-entropy associated to rigid PEs is much lower than that associated to flexible chains, so that chain-entropy loss upon adsorption is reduced for rigid chains. Secondly and concomitantly, the wall-PE attraction is more efficient for rigid chains than for flexible chains because in the latter case the -fluctuations of the charged monomers are more important.
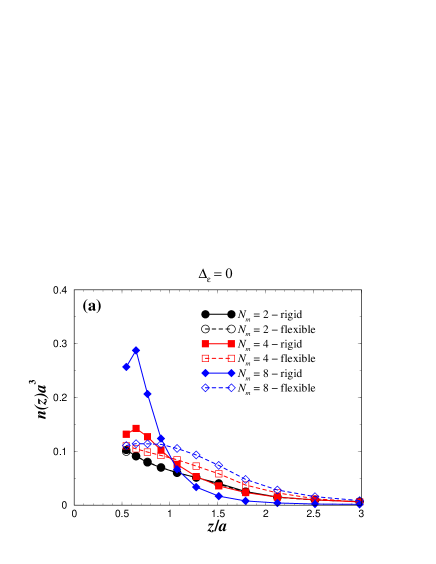
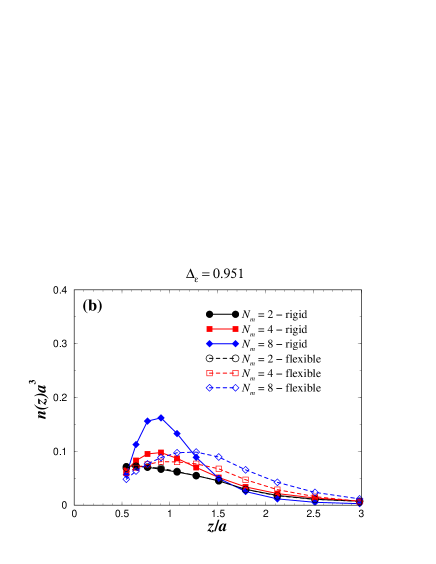
As far as the monomer density at true contact is concerned [i.e., ], it seems that, for flexible PEs, its value is nearly independent of as already reported in Ref. Messina_PRE_2004 . For a single ionic species of spherical shape, a variant of the contact theorem provides the exact relation: yielding to , which is surprisingly in remarkable agreement with the value reported in Fig. 3(a) for flexible PE (and rigid ones for ). Nonetheless, Fig. 3(a) shows, already with , a strong deviation from the contact theorem (which in principle only holds for structureless spherical ions) for rigid PEs, as expected.
The scenario becomes qualitatively different when [see Fig. 3(b)], where the -profiles for flexible and rigid PEs become more similar. It is to say that the image-polyion repulsion tends to cancel chain-entropy effects. A closer look at Fig. 3(b) reveals however that, at given , the degree of PE adsorption is systematically larger for rigid PEs than for flexible ones as expected. Those relevant findings can be summarized as follows:
-
•
Without dielectric discontinuity () rigid PE chains can much better adsorb than flexible ones at oppositely charged surfaces essentially because of their significant lower chain-entropy.
-
•
In the presence of polarization charges () the degree of PE adsorption becomes significantly less sensitive to the chain stiffness.
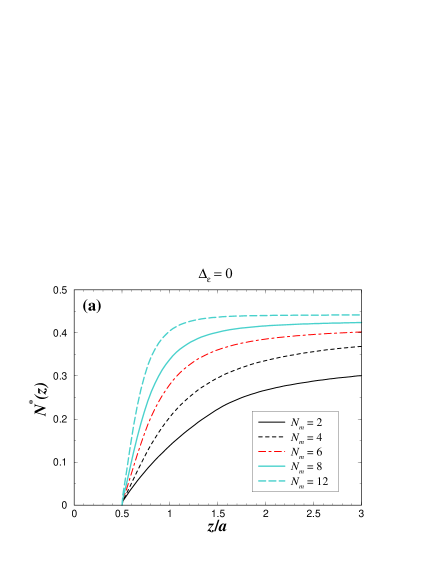
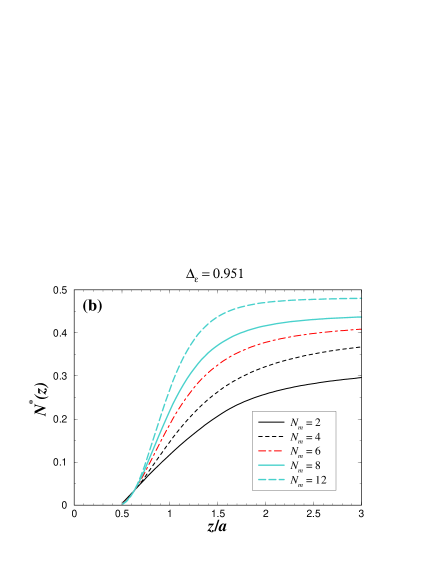
In order to quantify the amount of adsorbed monomers as a function of the distance from the charged wall, we have also studied as defined by Eq. (9). Our results are reported in Fig. 4. At [see Fig. 4(a)] the fraction of adsorbed monomers is always larger with growing even near the interface. On the other hand, at [see Fig. 4(b)]: (i) gets smaller with growing near the interface (roughly for ) and (ii) is considerably reduced compared to the -case. For instance (with ) at (corresponding to a layer thickness at ), can be as large as 0.4 for against only 0.2 for .
III.1.2 PE orientation
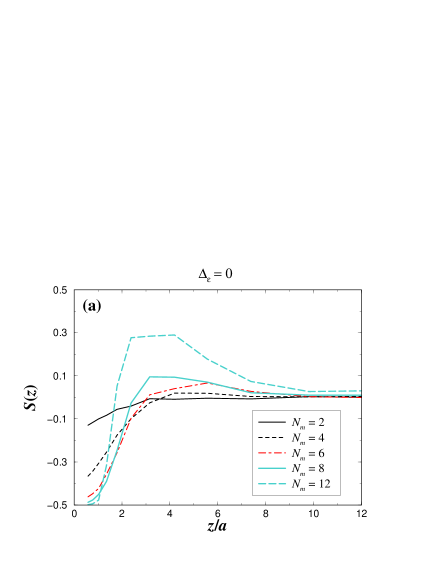
To gain further insight into the properties of rod-like PE adsorption, we have plotted as given by Eq.(11) in Fig. 5 so as to characterize the PE orientation with respect to the charged interface. At , Fig. 5(a) shows that in the vicinity of the interface (roughly for ) that the rod-like PEs tend to be parallel to the interface-plane with growing , i.e., (see also Fig. 2). This effect is obviously due to the electrostatic wall-PE binding whose strength increases linearly with . For the longest chains () non-negligible positive -values are reported at intermediate distance from the wall (roughly for ) signaling a non-trivial orientation correlation with respect to the interface-plane that will be properly discussed later. Sufficiently away from the wall, the rod-like PEs are randomly oriented [i. e., ] as it should be.
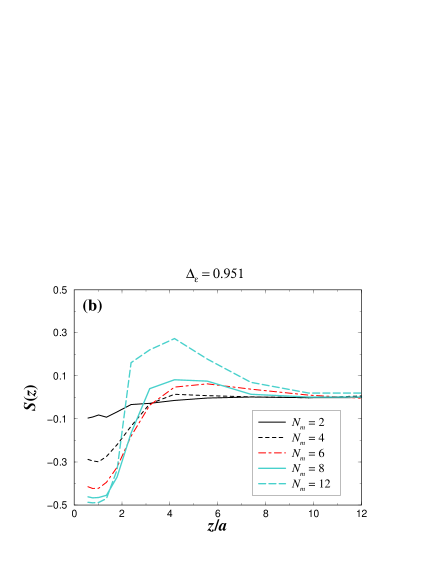
In the presence of image forces [ - see Fig. 5(b)] the behavior is more complex. A comparison with Fig. 5(a) corresponding to immediately shows that repulsive image forces tend to inhibit the alignment of the rod-like PEs with respect to the interface-plane near contact. This effect will be especially vivid at lower surface charge density , as we are going to show later.
The non-monotonic behavior of near contact at , similar to that reported for in Fig. 1(b), is the result of two antagonistic forces: (i) the repulsive image driving force that scales like and (ii) the attractive wall-monomer one that scales like . As in the case with , (i) the degree of PE-wall parallelism increases with growing near contact and (ii) far enough from the wall the PEs are randomly oriented.
III.1.3 Fluid charge
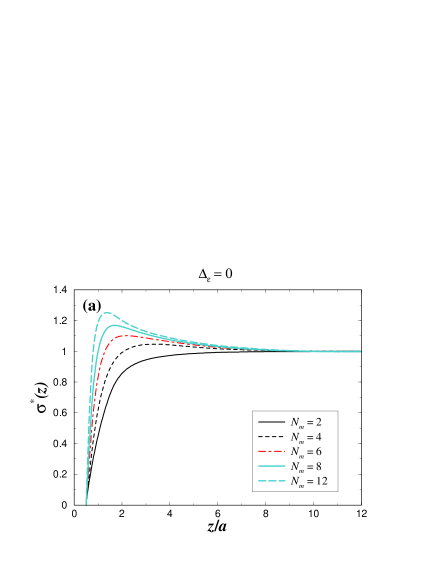
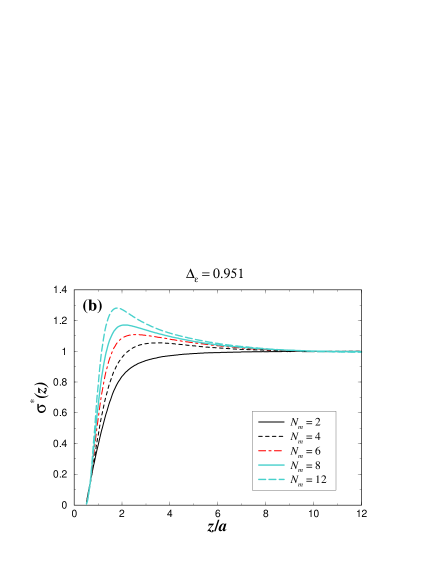
Another interesting property is provided by the net fluid charge parameter [Eq. (13)] that describes the screening of the charged interface. The profiles of for different can be found in Fig. 6. At [see Fig. 6(a)], it is shown that for long enough chains (here ) the substrate gets locally overcharged as signaled by . Physically, this means that the (integrated) local charge of the adsorbed monomers note_overscreening is larger in absolute value than that of the substrate’s surface charge. In other words, the plate is overscreened by the adsorbed PE chains. Fig. 6(a) indicates that the degree of overcharging increases with as expected from the behavior of multivalent counterions. Upon inducing polarization charges [ - see Fig. 6(b)] overscreening is maintained and weakly disturbed, proving that the latter is robust against repulsive image forces.
III.2 Influence of substrate’s surface-charge density
To complete our investigation, we would like to address the influence of the substrate charge density on the PE adsorption. In this respect, we consider (at fixed ) two additional values for the surface charge density: corresponding to the systems and , respectively (see Table 2).
III.2.1 Monomer distribution
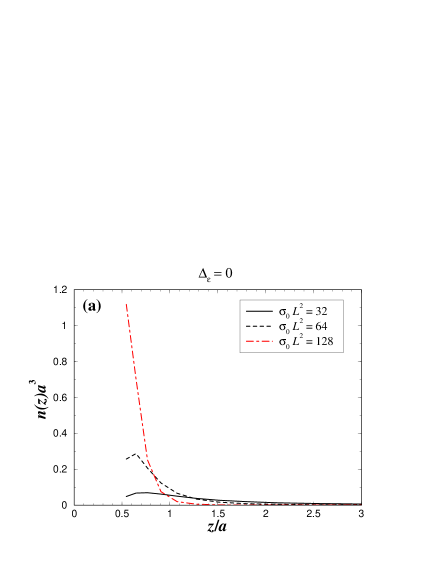
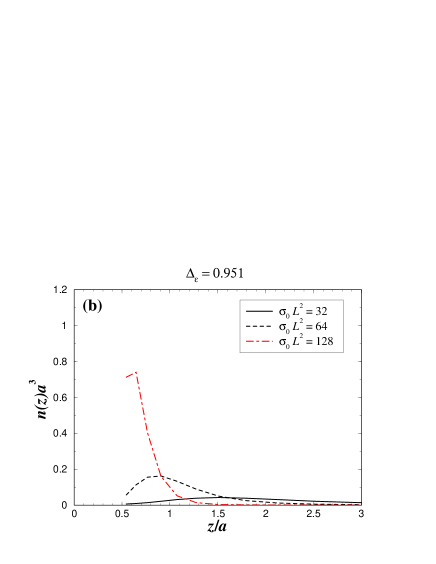
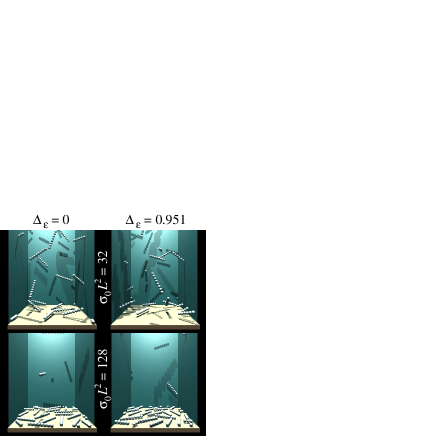
The plots of the monomer density for various values of can be found in Fig. 7. Typical microstructures of systems and are sketched in Fig. 8. At [see Fig. 7(a)], the monomer density at contact increases with as it should be. Interestingly, the local maximum in , present at small (here ), vanishes at large [see Fig. 7(a)]. This feature is the result of a -enhanced driving force of adsorption that overcomes chain-entropy effects at large enough . The strong adsorption at leads to a flat PE layer as well illustrated in Fig. 8.
By polarizing the interface (), it can be seen from Fig. 7(b) and the snapshot from Fig. 8 that there is a strong monomer depletion near the interface for . This feature is due to the combined effects of (i) image-PE repulsion and (ii) a lower electrostatic wall-PE attraction. Upon increasing the monomer density near contact becomes larger, and concomitantly, the location of the maximum in is systematically shifted to smaller . It is to say that the thickness of the adsorbed PE layer decreases with . We also expect that, at very large (not reported here), this maximum vanishes leading to a purely attractive effective wall-PE interaction.
III.2.2 PE orientation
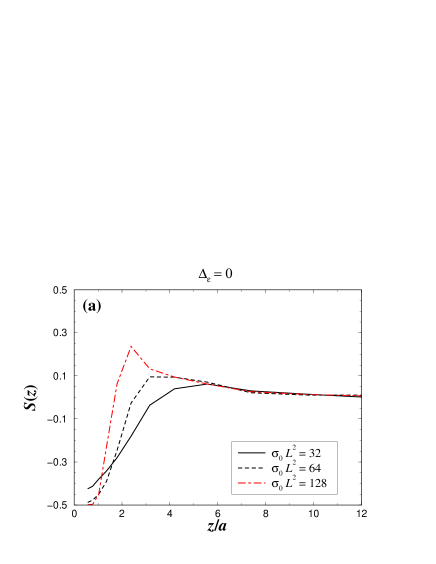
At , Fig. 9(a) shows that near the charged interface (when ) the degree of parallelism between the rod-like PE and the interface increases with growing as indicated by . This observation is merely due to the electrostatic wall-PE binding whose strength scales like at fixed .
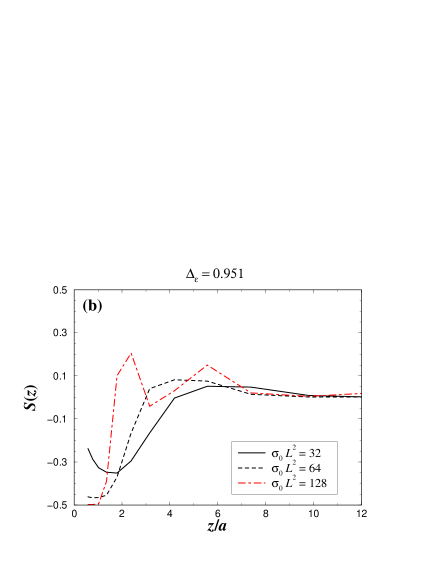
In the presence of image forces (), Fig. 9(b) demonstrates again for [see also Fig. 5(b) for comparison)] a strongly non-monotonic behavior of near the interface. This feature is fully consistent with the ideas that (i) image forces become especially strong at low and (ii) repulsive image forces induce orientational disorder as previously established. This finding leads to the important general statement:
-
•
Repulsive image forces at low surface charge density induce orientational disorder near the interface.
III.2.3 Fluid charge
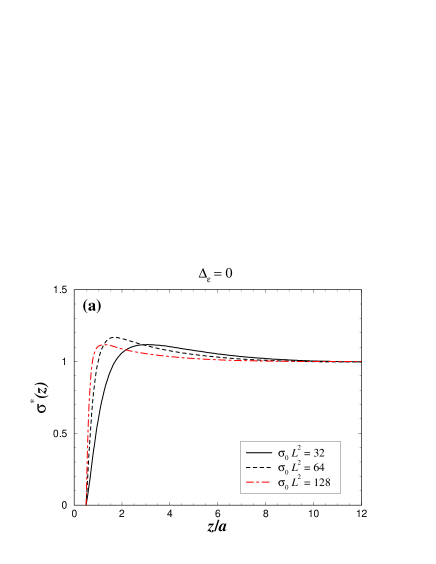
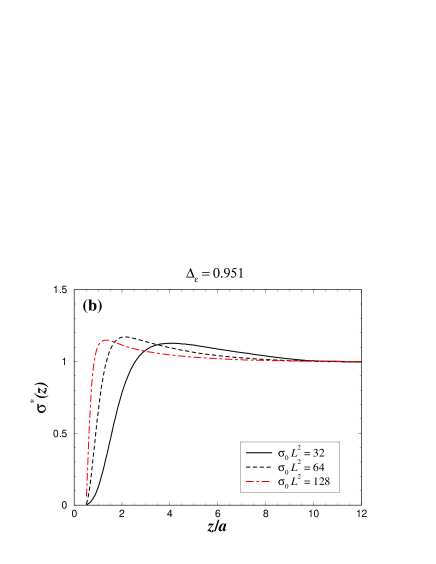
The profiles of for different can be found in Fig. 10. At [see Fig. 10(a)], it is found that the planar interface gets always locally overcharged as signaled by . The location of the maximum in is shifted to lower with increasing .
Upon inducing polarization charges [ - see Fig. 10(b)] overscreening is still there. However, at , there is a non-negligible shift of the maximum of about . The distance at which the substrate is compensated [i.e., where ] corresponds to 1.72a (2.54a) for () leading to a neutralization -shift of .
IV Summary
To conclude, we have performed MC simulations to address the behavior of rod-like polyelectrolytes at oppositely charged planar surfaces. The influence of image forces stemming from the dielectric discontinuity at the charged interface was also analyzed. We have considered a finite and fixed monomer concentration in the dilute regime for relatively short chains.
In the absence of image forces (), our main findings can be summarized as follows:
-
•
At moderately charged interfaces, only (very) short rod-like PEs (here ) experience a short-ranged repulsion near the interface. For longer rod-like PEs the effective wall-PE interaction becomes purely attractive. This behavior is in contrast to that occurring with flexible PEs, where the chain-entropy is larger leading to stronger entropy-driven depletion.
-
•
Near the charged interface, the rod-like PEs get more and more parallel to the interface-plane when the chain length is increased. Concomitantly, the strength of the substrate-charge reversal is -enhanced.
-
•
Upon increasing the substrate-surface-charge density it was demonstrated that: (i) The monomer adsorption is enlarged and the wall-PE effective interaction becomes purely repulsive for high enough . (ii) The degree of parallelism (near the interface) between the interface-plane and the rod-like PE is enhanced.
The main effects stemming from repulsive image forces () as revealed by this study are as follows:
-
•
The monomer adsorption is reduced at finite and the -profiles become similar to those obtained with flexible chains, in contrast to what was reported at .
-
•
Repulsive image forces induce PE orientational disorder near the interface.
-
•
The substrate-charge reversal is robust against repulsive image forces.
Acknowledgements.
R. M. thanks H. Löwen and R. Blaak for fruitful discussions. Financial support from DFG via LO418/12 and SFB TR6 is also acknowledged.References
- (1) J. O. Rädler, I. Koltover, T. Salditt, and C. R. Safinya, Science 275, 810 (1997).
- (2) S. P. A. Fodor, Science 277, 393 (1997).
- (3) T. Pfohl et al., Langmuir 17, 5343 (2001).
- (4) T. Pfohl, F. Mugele, R. Seemann, and S. Herminghaus, ChemPhysChem 4, 1291 (2003).
- (5) R. Menes, N. Grønbech-Jensen, and P. A. Pincus, Europ. J. Phys. E 1, 345 (2000).
- (6) R. Menes, P. Pincus, R. Pittman, and N. Dan, Europhys. Lett. 44, 393 (1998).
- (7) P. Sens and J.-F. Joanny, Phys. Rev. Lett. 84, 4862 (2000).
- (8) C. Fleck and H. H. von Grünberg, Phys. Rev. E 63, 061804 (2001).
- (9) H. Cheng and M. Olvera de la Cruz, J. Chem. Phys. 119, 12635 (2003).
- (10) D. A. Hoagland, Macromolecules 23, 2781 (1990).
- (11) R. R. Netz, J. Phys.-Condens. Mat. 15, S239 (2003).
- (12) R. R. Netz and J.-F. Joanny, Macromolecules 32, 9013 (1999).
- (13) R. Messina, Phys. Rev. E 70, 051802 (2004).
- (14) R. Messina, Macromolecules 37, 621 (2004).
- (15) A. Grzybowsky and A. Brodka, Molec. Phys. 100, 1017 (2002).
- (16) M. D. Malinsky, K. L. Kelly, G. C. Schatz, and R. P. van Duyne, J. Phys. Chem. B 105, 2343 (2001).
- (17) N. Metropolis et al., J. Chem. Phys. 21, 1087 (1953).
- (18) M. P. Allen and D. J. Tildesley, Computer Simulations of Liquids (Clarendon Press, Oxford, 1987).
- (19) R. Blaak, D. Frenkel, and B. M. Mulder, J. Chem. Phys. 110, 11652 (1999).
- (20) A. Tulpar and W. A. Ducker, J. Phys. Chem. B 108, 1667 (2004).
- (21) G. M. Torrie, J. P. Valleau, and G. N. Patey, J. Chem. Phys. 76, 4615 (1982).
- (22) R. Messina, J. Chem. Phys. 117, 11062 (2002).
- (23) Near the charged wall, the presence of the counterions at is marginal so that the fluid charge is quasi exclusively provided by the charges of the adsorbed monomers. This becomes especially vivid when where overcharging occurs.