Photoacoustic wave propagating from normal into superconductive phases in Pb single crystals
Abstract
Photoacoustic (PA) wave has been examined in a superconductor of the first kind, Pb single crystal. The PA wave is induced by optical excitation of electronic state and propagates from normal into superconductive phases below TC. It is clearly shown by wavelet analysis that the measured PA wave includes two different components. The high-frequency component is MHz-ultrasonic and the relative low-frequency one is induced by thermal wave. The latter is observed in a similar manner irrespective of TC. On the other hand, the MHz-frequency component is obviously enhanced below TC. The behavior is reproduced by the change of attenuation of longitudinal ultrasonic wave and is consistent with BCS theory.
pacs:
78.20.Hp, 74.25.Ld, 62.80.+fINTRODUCTION
Photoacoustic (PA) spectroscopy has the special advantage of analyzing thermal and elastic signals induced by photoexcitation, and has been widely applied to gas, liquid, and solids. C.K.N. Patel and A.C. Tam (1981); A.C. Tam (1986) Since the PA signal detected by piezoelectric transducer (PZT) is thermoelastic, C.K.N. Patel and A.C. Tam (1981) PA spectroscopy is considered effective to examine phase transitions. Indeed, PA signals around phase-transition point were theoretically studied, P. Korpiun and R. Tilgner (1980); J. Etxebarria et al. (1984) and several observations for first- and second-order transitions have been reported so far. J. Etxebarria et al. (1984); T. Somasundaram et al. (1986); S. Kojima (1988); Iwanaga In the previous reports, the change of PA signal has not been definitely attributed to the change of a physical quantity. This is because several physical parameters can contribute to the change of PA signal. In addition, since the PA signal was usually picked up by a lockin detector, the information is expressed by only two values, the amplitude and phase. Thus, the PA technique has had the advantage and disadvantage: the access to several physical quantities and the ambiguity in the interpretation. To extract more information in PA measurement, it is probably significant to examine PA wave itself. Generally, PA waves are generated from the heat source which results from nonradiative energy relaxation of photoexcited electrons. From the generation process, PA waves are regarded as the thermal and/or elastic wave associated with energy dissipation. The PA waves are expected to include the modes peculiar to the medium. If it is true, the analysis in the time and frequency domains will be helpful to make the physical properties clear; however, such a kind of study has hardly been reported.
In the PA studies to date, superconductive transitions have not been examined to our knowledge. As known prevailingly, the transitions are second-order without any crystallographic transition and are responsible for drastic change of electric conductivity. The transition has been most extensively investigated in various physical properties such as magnetic, thermal, and ultrasonic properties. Thus, the superconductor described by BCS theory J. Bardeen et al. (1957) seems suitable to test physical quantities detected in PA measurement. In this study, it is an aim to clarify the properties of PA wave and signals. Moreover, it is expected to reveal how one can analyze superconductive transition with PA spectroscopy. When photoexcitation induces electronic interband transition, it destroys superconductive phase due to the energy far larger than the energy gap in the phase. The effect is also discussed.
Concretely, Pb single crystal is explored in this study. The crystal is a superconductor of the first kind described by the strong electron-phonon coupled BCS theory; the superconductive phase has been closely investigated with far infrared spectroscopy, P.L. Richards and M. Tinkham (1960) electron tunneling technique, I. Giaever and M. Megerle (1961) ultrasonic pulse-echo technique, H.E. Bömmel (1954); B.C. Deaton (1966); B.R. Tittmann and H.E. Bömmel (1966); W.A. Fate and R.W. Shaw (1967) and so on. The crystal has the critical temperature TC of 7.22 K (Ref. C. Kittel, 1995). Thus, various material parameters have been obtained so far.
EXPERIMENT
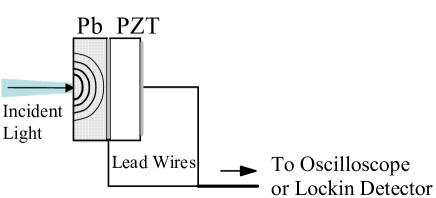
The Pb single crystal has the purity more than 99.999% and is the size of 551 mm3; the plane of 55 mm2 is (100) plane and the thickness is 1 mm. The PZT of the same size as the Pb single crystal was used in the PA measurement; the PZT has the resonant frequency of 4.00 MHz and the Curie point at 603 K. As drawn in Fig. 1, the (100) plane of Pb crystal was firmly attached to the 55 mm2 plane of the PZT with conductive organic paste. Since the lead wires were also attached as shown in Fig. 1, the detected voltage is proportional to the stress along the thickness direction, and the detected PA wave is bulk wave which propagates through the crystal. In the present configuration, the bulk wave generally includes the wave along off-thickness direction. The specimen and PZT were set in a He-flow cryostat equipped with a temperature controller.
Incident 2.33-eV light in measuring PA wave was second harmonics of a YAG (yttrium-alminium-garnet) laser and was injected onto (100) plane; the pulse width was 5 ns, and the repetition was 10 Hz. The incident light is strongly absorbed by Pb single crystals because of the electronic interband transition; the absorption length is 26 nm (Ref. H.G. Liljenvall et al., 1970). Therefore, the incident photons dissociate Cooper pairs in the thin surface layer below TC, so that the PA wave travels from normal into superconductive phases. The incident light was loosely focused to the spot size of 1-mm diameter on the sample surface, and the intensity was kept at about 200 J/pulse in order to avoid irradiation damage on the surface.
The PA wave detected by the PZT was directly measured by an oscilloscope without any preamplifier. To examine the change of PA signal around TC, the PA signal was stimulated with chopped continuous-wave (cw) Ar-laser light of 2.41 eV and was picked up by a two-phase lockin detector. The incident light was loosely focused to the size of 2-mm diameter on the specimen surface, and the power was 10 mW.
RESULTS
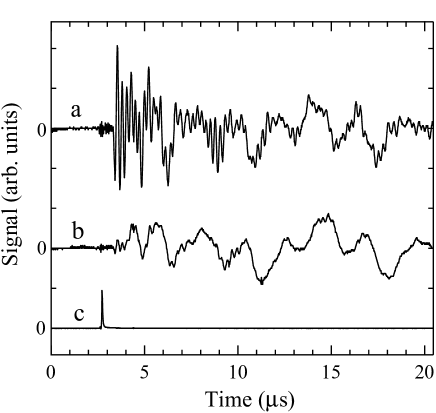
Figure 2 shows the PA waves at 4.2 (curve a) and 28.8 K (curve b) in the Pb single crystal. Curve c in Fig. 2 displays the temporal profile of 2.33-eV and 5-ns laser pulse, measured by a photodiode. The incident laser pulses reached onto the sample surface at 2.72 s. As seen in Fig. 2, the PA wave at 4.2 K includes many sharp spikes while the wave at 28.8 K has far less spikes. No further fine structure of PA wave is not observed by enlarging the waves at 4.2 and 28.8 K in the time domain. The difference of the two waves suggests that the PA wave at 4.2 K has a large amount of MHz components and is indeed presented in Fig. 3 as the image plot in the time-frequency domain. Concerning with the shape of PA waves, it is to be noted that the PA wave measured by PZT’s, in principal, includes the multiple reflection in the crystal and the ringing in the PZT simultaneously. The effect is well discriminated below by analyzing PA wave in the time-frequency domain.
Figure 3 is the result of time-frequency-domain analysis using wavelet AGU and presents the image plot of PA wave in Fig. 2. Wavelet transformation enables to extract the frequency component from wave in the time domain. The method has multiresolution and is a superior extension of Fourier transformation. Figure 3(a) corresponds to the result at 4.2 K (curve a in Fig. 2) and Fig. 3(b) to that at 28.8 K (curve b). Prominent signal appears at 4 MHz only at 4.2 K and the MHz component is strongly suppressed at 28.8 K. The peak position corresponds to the resonance of PZT and indicates the strong PA signal at MHz range. In this setup, a part of the strong PA signal appears prominently by the PZT resonance. On the other hand, oscillations are observed at 0.4 MHz in both image maps. The component at 0.4 MHz agrees with ringing frequency in the PZT; Iwanaga the ringing effect was detected in the configuration that the sample is removed in Fig. 1. Therefore, the PZT ringing is ascribed to the heat by laser irradiation. Presumably, the component at 0.4 MHz is induced by the thermal wave arrived at the interface between the crystal and PZT.
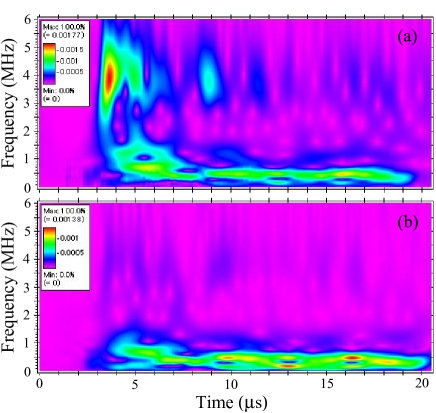
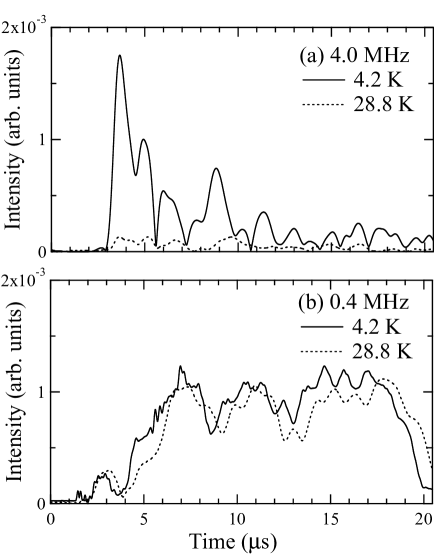
Figure 4 displays temporal profiles at 4.0 and 0.4 MHz in Fig. 3. It is apparent from Fig. 4(a) that PA signal at 4.2 K is enhanced at 4.0 MHz while Fig. 4(b) presents that the intensity and profile of PZT ringing are similar below and above TC. These results indicate explicitly that the two components are independent to each other; in other words, the ringing at 0.4 MHz is not induced by the MHz component. The likeness in Fig. 4(b) shows that the intensities of both waves are just proportional to the intensity of incident light and suggests that the ringing comes from thermal wave. Furthermore, the PA signal at 4.0 MHz grows rapidly at 3.0 s in Fig. 4(a) while the PA signal at 0.4 MHz increases gradually after 4.0 s. The results also imply that the low-frequency component is induced by the wave different from the ultrasonic wave connected to 4.0 MHz component. Thus, taking account of the results in Figs. 3 and 4, it is probable that the PA wave includes two different physical components, ultrasonic and thermal wave.
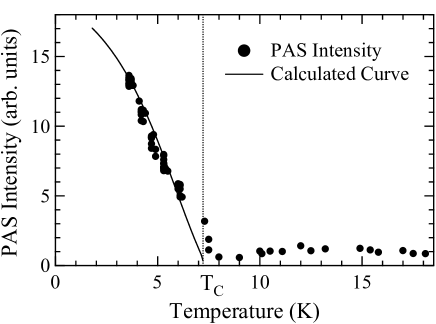
In Fig. 5, the intensity of PA signal (PAS) is plotted with solid circle against temperature. The PA signals were stimulated with 2.41-eV, cw-laser light chopped at 104 Hz and picked up from low to high temperatures. The intensity was measured with a two-phase lockin detector under the condition that each temperature is stable. The intensity keeps nearly constant from TC to RT while it is enhanced below TC; the increase amount is almost in agreement with that of 4.0-MHz component in Fig. 4(a). Thus, the PA signal picked up by the lockin detector is ascribed to the leading component of PA wave. The temperature profile of PAS intensity is reproduced in Fig. 5; the calculated curve (solid line) is derived as follows.
DISCUSSION
Because of the leading component of PA wave and the present experimental configuration, it is assumed here that the PA signal in Fig. 5 comes from longitudinal ultrasonic wave. Then, Fig. 5 can be regarded as the plot of intensity of longitudinal ultrasonic wave. In this case, the ordinate is proportional to decayed intensity , where stands for absorption coefficient of the ultrasonic wave in the crystal and is thickness of the crystal ( mm). In the superconductive phase, the has to be replaced with which is the absorption coefficient of longitudinal ultrasonic wave in the superconductive phase.
To analyze the measured PAS intensity, the interface loss of signal has to be included. In fact, the PA signal decays in the crystal and moreover at the interface between the crystal and PZT. Therefore, an interface loss factor is introduced (), and the measured PAS intensity is proportional to
| (1) |
for . The is treated as a fitting parameter below.
The values (T) at 4.0 MHz are necessary in evaluating Eq. (1). However, the values are not available in existent literature. Therefore, another procedure is chosen: (i) First, the (T) is evaluated by combining the absorption coefficient (T) in the normal state with the ratio derived by BCS theory. J. Bardeen et al. (1957) Though the absorption coefficient (T) was reported only at 26.6 MHz (Ref. H.E. Bömmel, 1954), the (T) can be evaluated around TC from the literature because the frequency dependence is known and the temperature dependence is independent of ultrasonic frequency below tens of MHz (Ref. R.W. Morse, 1955). Also, the ratio is written such as
| (2) |
where is the energy gap of superconductive state, which is expressed as (Ref. J. Bardeen et al., 1957), and for Pb (Ref. C. Kittel, 1995). (ii) The PAS intensity is fitted by Eq. (1) with changing the . (iii) Finally, the most fitted value is searched by varying the proportionality constant of Eq. (1).
In the fitting procedure, after the is uniquely determined, the proportionality constant multiplied by Eq. (1) is evaluated uniquely. Thus, the solid line in Fig. 5 is obtained and seems to reproduce the data below TC fairly well.
The most fitted is estimated to be 4.1 by using the relation of . This is net interface loss and means that the PA wave is reduced at the interface. The resuction is suggestive of not optimized interface coupling.
In the above analysis, the is simply combined with the . This assumes that the longitudinal ultrasonic wave is simply described by BCS theory and is not influenced by strong electron-phonon coupling in Pb. In fact, ultrasonic absorption coefficient at more than a-few-tens MHz deviates from the simple BCS result. B.C. Deaton (1966) However, as frequency becomes lower, the coefficients get close to the values derived from BCS theory. B.C. Deaton (1966) Therefore, the simple analysis using Eqs. (1) and (2) is found relevant to PAS of 4.0 MHz. Moreover, the analysis suggests that the normal state generated by photoexcitation gives little influence on PA wave, that is, the state is induced only in thin surface layer.
As for the strong electron-phonon coupling, it is significant to measure transmission spectrum in the frequency domain by using calibrated PZT’s. The PA wave is a kind of self-induced ultrasonic wave, and the transmission spectrum reveals the propagation mode; moreover, the mode includes the information on the electron–ultrasonic-wave interaction. The interaction has been classified with (wavenumber of ultrasonic wave) and (mean free length of electrons) phenomenologically. The transmission spectrum would enable to analyze effect quantitatively in experiment. Indeed, the most effective was estimated B.C. Deaton (1966) and corresponds to about 10 MHz; since the frequency is rather close to the present experiment, the transmission measurement seems realistic. The strong-coupling effect could be tested in detail by analyzing such transmission.
As seen in this study, the PA wave in the normal state is regarded as thermal wave. The property of PA wave is perhaps common in normal metals because the attenuation of longitudinal ultrasonic wave is similar among them. In the case, the PAS detected by lockin equipment has to be analyzed on the basis of this property.
Laser-induced acoustic waves have been reported. C. Thomsen et al. (1986); T.K. Cheng et al. (1990) Since the comparison with the present PA study would attract an interest, a few comments are made here. The laser-induced acoustic waves are induced by ps- or fs-pulsed laser light and are extracted from the transient reflection detected with the pump-probe technique. Therefore, the acoustic signals have the frequency at GHz to THz and often correspond to optical phonons. The signals are induced at the laser-injected surface. The method is suitable to observe surface-layer phenonema because the attenuation of wave is typically 1 m and the wave cannot travel through bulk samples. On the other hand, the present PA wave has the frequency at MHz and transmits over 1 mm. The MHz wave does not destroy Cooper pairs because the frequency is far smaller then the gap frequency determined by 2(T). That is, the PA wave travels in the superconductive phase. The frequency distribution of PA wave results from the ultrasonic propagation mode connected to energy dissipation. Therefore, the PA wave would provide new insights about the propagation mode and energy transport in the superconductive phase.
In conclusion, PA waves have been explored in the time-frequency domain, so that it is clarified that the 4.0-MHz component highly transmits and the thermal wave is also observed as the PZT ringing in the superconductive phase, while the thermal wave is dominant in the normal state. The enhancement of PAS intensity is reproduced fairly well from the analysis based on the attenuation constant of longitudinal ultrasonic wave which satisfies the relation in BCS theory. Consequently, it is found that the PA signal below TC is mainly composed of longitudinal ultrasonic wave in the present configuration. The enhanced frequency of PA wave probably comes from the propagation mode of ultrasonic wave in the superconductive phase though further measurement using caribrated PZT’s is necessary to detemine the frequency distribution. The mode is likely associated with the effective interaction with superconductive electrons. The analysis of temperature-dependent PA-signal intensity suggests that the normal state hardly contributes to the PA signal, that is, the breaking of superconductive phase due to photoexcitation is restricted only to thin surface layer in the crystal. As a result, the PA wave propagates through the superconductive phase.
Acknowledgements.
I would like to appreciate the support for the PA measurement by Prof. T. Hayashi (Kyoto University). This study was supported in part by Grant-in-Aid for Research Fellow of the Japan Society for the Promotion of Science.References
- C.K.N. Patel and A.C. Tam (1981) C.K.N. Patel and A.C. Tam, Rev. Mod. Phys. 53, 517 (1981).
- A.C. Tam (1986) A.C. Tam, Rev. Mod. Phys. 58, 381 (1986).
- P. Korpiun and R. Tilgner (1980) P. Korpiun and R. Tilgner, J. Appl. Phys. 51, 6115 (1980).
- J. Etxebarria et al. (1984) J. Etxebarria, S. Uriaite, J. Fernández, M.J. Tello, and A. Gómez-Cuevas, J. Phys. C: Solid State Phys. 17, 6601 (1984).
- T. Somasundaram et al. (1986) T. Somasundaram, P. Gangnly, and C.N.R. Rao, J. Phys. C: Solid State Phys. 19, 2137 (1986).
- S. Kojima (1988) S. Kojima, Jpn. J. Appl. Phys., Part 1 27, 226 (1988).
- (7) M. Iwanaga, eprint cond-mat/0306664.
- J. Bardeen et al. (1957) J. Bardeen, L.N. Cooper, and J.R. Schrieffer, Phys. Rev. 108, 1175 (1957).
- P.L. Richards and M. Tinkham (1960) P.L. Richards and M. Tinkham, Phys. Rev. 119, 575 (1960).
- I. Giaever and M. Megerle (1961) I. Giaever and M. Megerle, Phys. Rev. 122, 1101 (1961).
- H.E. Bömmel (1954) H.E. Bömmel, Phys. Rev. 96, 220 (1954).
- B.C. Deaton (1966) B.C. Deaton, Phys. Rev. Lett. 16, 577 (1966).
- B.R. Tittmann and H.E. Bömmel (1966) B.R. Tittmann and H.E. Bömmel, Phys. Rev. 151, 178 (1966).
- W.A. Fate and R.W. Shaw (1967) W.A. Fate and R.W. Shaw, Phys. Rev. Lett. 19, 230 (1967).
- C. Kittel (1995) C. Kittel, Introduction to Solid State Physics, 7th ed. (Wiley, New York, 1995), chap. 12.
- H.G. Liljenvall et al. (1970) H.G. Liljenvall, A.G. Mathewson, and H.P. Myers, Philos. Mag. 22, 243 (1970).
- (17) Wavelet transformation was carried out by using a software, AGU-Vallen wavelet produced by Vallen Systeme (Munich, Germany). Wavelet was taken to the 200-th order. The software is avaliable at URL http://www.vallen.de.
- R.W. Morse (1955) R.W. Morse, Phys. Rev. 97, 1716 (1955).
- C. Thomsen et al. (1986) C. Thomsen, H.T. Grahn, H.J. Maris, and J. Tauc, Phys. Rev. B 34, 4129 (1986).
- T.K. Cheng et al. (1990) T.K. Cheng, S.D. Brorson, A.S. Kazeroonian, J.S. Moodera, G. Dreerlhaos, M.S. Dresselhaus, and E.P. Ippen, Appl. Phys. Lett. 57, 1004 (1990).