Quantum Criticality in an Organic Magnet
Abstract
Exchange interactions between sites in piperazinium hexachlorodicuprate produce a frustrated bilayer magnet with a singlet ground state. We have determined the field-temperature phase diagram by high field magnetization and neutron scattering experiments. There are two quantum critical points: T separates a quantum paramagnet phase from a three dimensional, antiferromagnetically-ordered state while T marks the onset of a fully polarized state. The ordered phase, which we describe as a magnon Bose-Einstein condensate (BEC), is embedded in a quantum critical regime with short range correlations. A low temperature anomaly in the BEC phase boundary indicates that additional low energy features of the material become important near .
pacs:
75.10.Jm, 75.40.Gb, 75.50.EeThe concept of a critical transition between different phases of matter at temperature is central to many complex phenomena in strongly correlated systems sachdevbook . Quantum critical points (QCPs) give rise to anomalous properties through a range of temperatures, and may be responsible for heavy fermions abfermionreview , non-fermi-liquids colemanrev , and the anomalous normal state of doped cuprates varma . Among the non-thermal tuning parameters accessible to the experimentalist, doping has been applied to access QCPs in heavy fermion intermetallics schroeder ; steglich and copper oxide superconductors tranquada , and hydrostatic pressure has been used to expose anomalous superconducting saxena and metallic grosche phases in weak itinerant magnets. While magnetic fields generally induce conventional transitions between states with static spin order, exceptions are found in anisotropic spin systems where a transverse magnetic field, , can drive a transition from spin order at to a quantum disordered state bitko . The reverse transition from a quantum paramagnet (QP) in zero field to an anisotropic ordered state in high fields has been observed in certain organo-metallics Eckert79 ; cuhpcl ; ndmap . While materials with such behavior are often quasi-one-dimensional, recent experiments have revealed a wider range of cooperative phenomena in higher dimensional systemscavadini ; stonecuhpcl ; jaime2004 . Owing to the simplicity of the low energy Hamiltonian, high field experiments on organo-metallic magnets are a promising route to new information about quantum criticality.
We provide a comprehensive analysis of the phase diagram of a quasi-two-dimensional (2D) frustrated organo-metallic antiferromagnet (AFM) with two field driven QCPs. Key results include a detailed characterization of a Bose-Einstein condensation (BEC) in the vicinity of a zero-temperature quantum critical point. We also find a low anomaly in the BEC phase boundary, which may indicate that nuclear spins and/or phonons are important thermodynamic degrees of freedom close to the QCP.
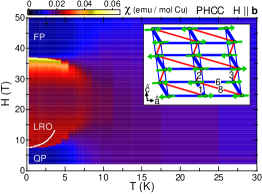
Experiments were carried out on the quasi-2D quantum AFM piperazinium hexachlorodicuprate ( PHCC). The crystal structure is composed of Cu-Cl sheets in the a-c plane, separated by piperazinium layers stonephccprb01 ; battaglia88 . Magnetic properties are dominated by the Cu-Cu interactions within individual sheets shown in Fig. 1. The magnetic connectivity is that of an oblique bilayer, with the strongest bond, i.e. the dimer, bond 1, providing interlayer coupling. Frustrated interlayer bonds 2 and 8 may also play a role in producing a singlet ground state with strong correlations to five near neighbors. Magnetic excitations at are dominated by a dispersive triplet of magnons, also known as the triplon, with a bandwidth meV and an energy gap meV. Cluster expansion analysis of the dispersion indicates that the strongest intra-layer bond , while the frustrating bonds are martinmullerpreprint . An experimental limit of meV has been placed on the out of plane dispersion and the triplons are degenerate to within 0.05 meV.
Magnetic susceptibility measurements were performed at the National High Magnetic Field Laboratory using a compensated-coil susceptometer in pulsed fields up to T for K K. The sample was a 1.36 mg hydrogenous single crystal with b. Elastic neutron scattering measurements were performed on the FLEX spectrometer at the Hahn-Meitner Institut (HMI). The sample was composed of two 89% deuterated single crystals with total mass 1.75 grams, coaligned within 0.5∘ and oriented in the scattering plane, b. A room temperature graphite filter or a liquid nitrogen cooled beryllium filter was employed in the scattered beam for neutron energies 14.7 and 2.5 meV respectively. Beam divergence was defined by the neutron guide before the monochromator and 60′ collimators elsewhere.
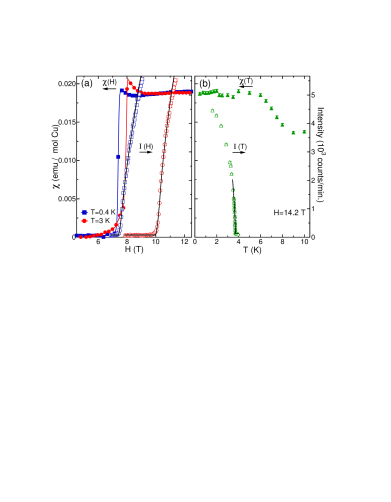
Differential magnetic susceptibility data, , are shown in Fig. 1. At K there is evidence for two quantum transitions from gapped phases with for T and T to a magnetizable state in the intermediate field range. at the lower transition is shown in Fig. 2(a). Integrating yields a saturation magnetization of per spin, identifying the high field phase as fully spin-polarized (FP).
In the intermediate field phase AFM Bragg peaks were found at wave vectors where is a reciprocal lattice vector of the chemical cell. The lower bound on the order parameter correlation length in the plane is Å. Analysis of peak intensities yields the spin structure in Fig. 1, which is consistent with bond energies measured in the zero field phase in that (un)frustrated bonds correspond to (anti)parallel spins. Normalizing to incoherent scattering and assuming long range order (LRO) along yields at K and T.
Figure 2 shows the order parameter onset in and sweeps. While the onset of Bragg scattering coincides with the onset of elevated for K, Bragg peaks first appear well within the high susceptibility state for K. A similar conclusion is reached based on the sweep at T where the critical temperature for LRO is K compared to the K onset of the high susceptibility state. The solid line for T in Fig. 1 is the phase boundary inferred from neutron diffraction with further details in Fig. 3(a). For K, the LRO phase resides well within the high susceptibility state.
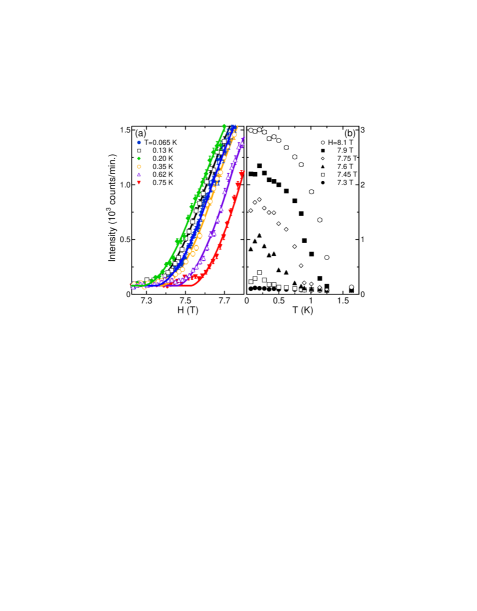
At low , the phase boundary to Néel order approaches the onset of the high susceptibility state, and for K there is no intermediate phase that can be distinguished from the data. At lower , field sweeps of the magnetic Bragg intensity, shown in Fig. 4(a), indicate a minimum in the phase boundary for K. Plotted versus in Fig. 4(b), these data show an intensity maximum for K and T indicating that PHCC passes into and then back out of the LRO phase in this field range.
Figures 2 and 4 show a rounded onset of magnetic scattering in PHCC. If critical fluctuations are responsible for this, the energy scale must be less than the energy resolution. Alternatively, field inhomogeneity can smear a singular onset. The solids lines in Figs. 2 and 4(a) were obtained by fitting the width of a rectangular field distribution as well as the critical field, , and the critical exponent, . While a 3.6(1)% distribution width accounts for the data, it exceeds the % width expected over the sample volume in the HMI magnet. An additional potential source of static broadening are impurities that produce effective random fieldsfishmanaharony .
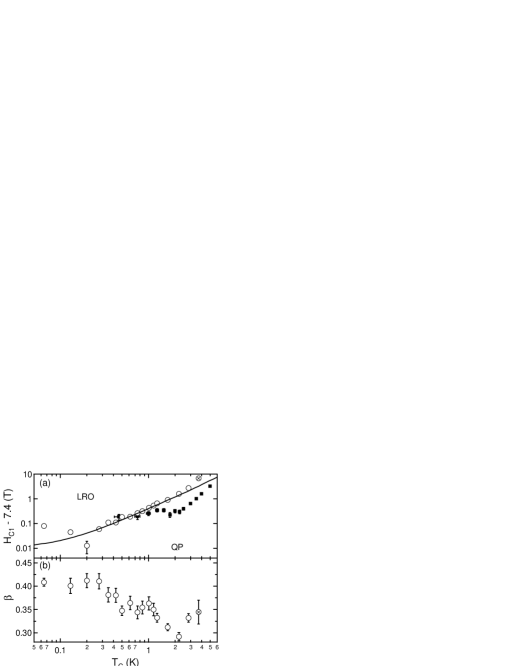
Systematic values for and were obtained by fitting the data in Figs. 2 with the apparent field distribution width fixed at 3.6%. The corresponding phase boundary in Fig. 3(a) affirms the existence of a wedge in space with neither LRO nor a spectral gap. Taylor expansion of the phase boundary about a generic point (, ) on the line of transitions, as follows , clearly shows that if then . Hence the consistent values of extracted from and scans at K instill confidence in the experiment and analysis (see Fig. 3(b)).
Recent experimental and theoretical work on interacting dimers indicates that the phase transition to long range Néel order can be described as a BEC of magnons affleck1990 . An applied field drives the chemical potential for spin polarized magnons () to zero causing BEC at sufficiently low . In 2D, BEC can only occur at so we associate the sharp increase in indicated by solid points in Figs. 2(a) and 3(a) with the corresponding finite temperature quantum critical regime. In the immediate vicinity of the LRO phase boundary the critical phase is denoted renormalized classical (RC) ChakravartyHalperinandNelson though there are no notable distinctions between the RC and QC regimes in the present data. The the renormalized critical regime is characterized by a small population of magnons that behave as individual particles. The finite transition to Néel order may be BEC resulting from weak inter-bi-layer coupling or a 2D Kosterlitz-Thouless (KT) transition. To distinguish these scenarios we explore the corresponding theoretical phase boundaries. Following Nikuni et al. Nikuni00 and Misguich and Oshikawa Misguich04 we treat magnons as bosons with a chemical potential and short range repulsion, :
| (1) |
Mean field theory yields a condensate magnon density . Beyond a cusp that may be associated with logarithmic corrections Sachdev94 , Fig. 2(a) shows that the low indeed displays a plateau from which we obtain meV, where is the unit cell volume. As expected for hard core bosons, this number is similar to the magnon bandwidth meV.
The Hartree Fock approximation provides the effective Hamiltonian
| (2) |
Bosons condense when the renormalized chemical potential , which yields the critical density and field
| (3) | |||||
| (4) |
We assume quasi-2D magnon dispersion with from experiments stonephccprb01 . When , only the bottom of the magnon band is thermally excited and one may replace the exact band structure with parabolic dispersion to obtain
| (5) |
where is the 3D effective mass. In the limit of a very weak inter-bi-layer tunnelling there is a regime where the in-plane dispersion can be treated as parabolic and the critical density for a quasi-2D Bose gas is obtainedMicnas90
| (6) |
Here and is the inter-bi-layer distance. In the intermediate regime the critical density first rises faster than Misguich04 before crossing over to behavior. For meV the calculated phase boundary shown in Fig. 3(a) is consistent with the data over one decade of . If bi-layers in PHCC were fully decoupled from each other the BEC would change into a KT vortex-unbinding transition. In 2D the crossover exponent , so in contrast to the observed phase boundary a KT phase boundary would be linear for . This is consistent with a recent comprehensive analysis of magnon condensation in 2D by Sachdev and Dunkel dunksach . Hence it appears that 3D BEC rather than vortex unbinding is the appropriate description of the field induced transition to LRO in PHCC.
The experimental high limit for the critical exponent obtained by averaging PHCC data for 0.5 K4 K is consistent with a 3D XY model for which Collins . Upon cooling through the temperature K where merges with the 2D BEC cross over inferred from magnetization data, the experimental values for increase. The apparent increase of the exponent is consistent with an expected crossover from a thermally driven transition to a quantum phase transition. Because the upper critical dimension of the zero-temperature BEC is Fisher89 , has a mean-field value of .
A discrepancy in the description of the phase diagram for PHCC presented so far exists for K where the observed critical field exceeds the BEC phase boundary (Eqs. 4 and 3) with a finite K minimum (Figs. 3 and 4). Various low energy aspects of PHCC may be responsible for this behavior. Owing to the low symmetry of the lattice, exchange interactions in PHCC must be anisotropic which could lead to an Ising transition at sufficiently low . Alternatively nuclear spins, and phonons which are effectively decoupled from magnetism at high and normally unimportant compared to exchange interactions at low may become relevant close to the field tuned QCP. Similar low anomalies have been found in other electronic spin systems close to quantum criticality such as GGG tsuiprl1999 , bitko , and ZincCrRef . In , the anomaly favors the spin ordered phase and is associated with hyperfine coupling to the nuclear spin system. The spin ordered phase is also favored for where the anomaly is associated with magneto-elastic coupling. Low temperature spin-lattice coupling is also observed in the spin-gap systems TlCuCl3 Vyaselev04 and CuHpCl Lorenzo04 . For PHCC, the singlet ground state may be affected by coupling to Cu nuclear spins for K. This could help to stabilize bond order over spin order and explain our failure to discover additional phase boundaries at low . Alternatively, T and K may be a tetra-critical point separating the bond ordered phase, the type spin ordered phase and a yet to be detected magneto-elastic or nuclear+electronic spin ordered phase.
The phase diagram for PHCC illustrates many important aspects of strongly correlated systems. There is evidence for a finite crossover to a quasi-2D RC phase with 3D BEC at lower and higher . We also presented evidence for a non-monotonic phase boundary to spin order at low , which indicates that exchange anisotropy, nuclear spin and/or lattice degrees of freedom can be important close to quantum criticality.
We gratefully acknowledge discussions with A. Aharony, L. Balents, O. Entin-Wohlmann, A. B. Harris, S. Sachdev, and T. Yildrim. Work at JHU was supported by the NSF through DMR-0074571, DMR-0306940, DMR-0348679 and by the BSF through grant No. 2000-073. ORNL is managed for the US DOE by UT-Battelle Inc. under contract DE-AC05-00OR2272.
References
- (1) S. Sachdev, Quantum Phase Transitions (Cambridge University Press, Cambridge, England, 2001).
- (2) G. Aeppli and C. Broholm, in Handbook on the Physics and Chemistry of Rare Earths 19, Ch. 131, p. 123 Elsevier (1994).
- (3) P. Coleman and C. Pépin, Physica B Cond. Matter, 312, 383 (2002).
- (4) C. M. Varma, Phys. Rev. Lett. 83, 3538 (1999).
- (5) A. Schroeder et al., Int. J. Mod. Phys. B 16, 3031 (2002).
- (6) S. Mederle et al., J. Phys. Cond. Matter 14, 10731 (2002).
- (7) J. M. Tranquada et al., Phys. Rev. B 54, 7489 (1996).
- (8) S. S. Saxena et al., Nature 406, 587 (2000).
- (9) F. M. Grosche et al., J. Phys. Cond. Matter, 12, L533 (2000).
- (10) D. Bitko et al., Phys. Rev. Lett. 77, 940 (1996).
- (11) J. Eckert et al., Phys. Rev. B 20, 4596 (1979).
- (12) G. Chaboussant et al., Eur. Phys. J. B 6, 167 (1998).
- (13) Z. Honda et al., Phys. Rev. Lett. 81, 2566 (1998).
- (14) N. Cavadini et al., Int. J. Mod. Phys. B 16, 3302 (2002).
- (15) M. B. Stone et al., Phys. Rev. B 65, 64423 (2002).
- (16) M. Jaime et al. Phys. Rev. Lett. 93, 087203 (2004).
- (17) M. B. Stone et al., Phys. Rev. B. 64, 144405 (2001).
- (18) L. P. Battaglia et al., J. Chem. Soc. Dalton Trans. 2, 265 (1988).
- (19) H.-J. Mikeska and M. Müller, Appl. Phys. A 74 S580 (2002).
- (20) S. Fishman and A. Aharony, J. Phys. C 12, L729 (1979).
- (21) I. Affleck, Phys Rev. B 41, 6697 (1990).
- (22) S. Chakravarty et al., Phys. Rev. B 39, 2344 (1989).
- (23) T. Nikuni, M. Oshikawa, A. Oosawa, and H. Tanaka, Phys. Rev. Lett. 84, 5868 (2000).
- (24) G. Misguich and M. Oshikawa, J. Phys. Soc. Jpn 73, 3429 (2004).
- (25) S. Sachdev et al., Phys. Rev. B 50 258 (1994).
- (26) R. Micnas, J. Ranninger, and S. Robaszkiewicz, Rev. Mod. Phys. 62, 113 (1990).
- (27) S. Sachdev and E. R. Dunkel, cond-mat/0510365.
- (28) M. F. Collins, “Magnetic Critical Scattering”, Oxford University Press (1989).
- (29) M. P. A. Fisher et al., Phys. Rev. B 40, 546 (1989).
- (30) Y. K. Tsui et al., Phys. Rev. Lett. 82, 3532 (1999).
- (31) S. H. Lee et al., Phys. Rev. Lett. 84, 3718 (2000).
- (32) O. Vyaselev et al., Phys. Rev. Lett. 92, 207202 (2004).
- (33) J. E. Lorenzo et al., Phys. Rev. B. 69, 220409(R) (2004).