Optical study of orbital excitations in transition-metal oxides
Abstract
The orbital excitations of a series of transition-metal compounds are studied by means of optical spectroscopy. Our aim was to identify signatures of collective orbital excitations by comparison with experimental and theoretical results for predominantly local crystal-field excitations. To this end, we have studied TiOCl, RTiO3 (R=La, Sm, Y), LaMnO3, Y2BaNiO5, CaCu2O3, and K4Cu4OCl10, ranging from early to late transition-metal ions, from to systems, and including systems in which the exchange coupling is predominantly three-dimensional, one-dimensional or zero-dimensional. With the exception of LaMnO3, we find orbital excitations in all compounds. We discuss the competition between orbital fluctuations (for dominant exchange coupling) and crystal-field splitting (for dominant coupling to the lattice). Comparison of our experimental results with configuration-interaction cluster calculations in general yield good agreement, demonstrating that the coupling to the lattice is important for a quantitative description of the orbital excitations in these compounds. However, detailed theoretical predictions for the contribution of collective orbital modes to the optical conductivity (e.g., the line shape or the polarization dependence) are required to decide on a possible contribution of orbital fluctuations at low energies, in particular in case of the orbital excitations at 0.25 eV in RTiO3. Further calculations are called for which take into account the exchange interactions between the orbitals and the coupling to the lattice on an equal footing.
pacs:
78.30.-j, 71.70.Ch, 71.27.+a, 75.50.Ee1 Introduction
The large variety of interesting physical phenomena observed in transition-metal oxides results from the strong electronic correlations within the partly filled shell [1]. The correlated electrons carry charge, spin and orbital degrees of freedom, and often they are strongly coupled to the lattice. Due to the complex interplay of these degrees of freedom [2], a subtle change of a single parameter such as the bond angle or the temperature may result in a dramatic change of the physical properties. A prerequisite for a quantitative description of this complex interplay is a detailed understanding of the physics of each degree of freedom separately. Over the last years, a lot of progress was achieved regarding the properties of, e.g., low-dimensional quantum spin systems [3, 4], in which the charge degrees of freedom are frozen out due to the formation of a Mott-Hubbard insulator at half filling. Many fascinating phenomena have been discovered such as the absence of long-range order even at zero temperature in one-dimensional spin liquids [5, 6], the opening up of spin gaps in even-leg =1/2 ladders [7] or in the =1 Haldane chain [8], and novel excitations such as spinons [9, 10, 11, 12], triplons [13] or two-triplon bound states [14, 15]. The coupling of spin and charge degrees of freedom may give rise to superconductivity in doped spin ladders [16, 17, 18] and is one of the key features in the field of high-temperature superconductivity in the cuprates. The interplay of the spins and the lattice has been analyzed in great detail in the spin-Peierls system CuGeO3.
Orbital and spin degrees of freedom are intimately connected with each other, and it is tempting to speculate about novel quantum phenomena related to the orbital degree of freedom. Some interesting examples which have been discussed recently are orbital liquids [19, 20, 21, 22], strong orbital fluctuations, an orbital Peierls state [23, 24, 25] and orbital waves (orbitons) [26, 27, 28, 29, 30]. Candidates for the realization of these phenomena are LaTiO3 [21, 31], TiOCl [32, 33], YVO3 [34] and LaMnO3 [26], respectively. However, many of these claims are heavily debated in the literature [35, 36, 37, 38, 39, 40, 41, 42, 43, 44, 45, 46, 47, 48, 49, 50, 51, 52, 53]. These novel phenomena are based on the exchange interactions between orbitals on adjacent sites. A crucial assumption is that some orbitals are (nearly) degenerate. For instance, the discussion of an orbital liquid in pseudo-cubic titanate perovskites [21] starts from a partially filled level and assumes that the degeneracy is lifted by quantum fluctuations based on exchange interactions. However, the orbital degeneracy may also be lifted by the coupling to the lattice (Jahn-Teller effect). Drawing an analogy with the spin degrees of freedom, the situation is similar to the case of two antiferromagnetically coupled spins in an external magnetic field. If the exchange interactions dominate, the two spins will form a singlet. However, if the external magnetic field dominates, the spins will align parallel to the field, and the spin fluctuations are strongly suppressed. For the orbital degrees of freedom, we are thus confronted with two central questions: Which of the two mechanisms yields the larger energy gain ? How strongly are the orbital fluctuations quenched by the coupling to the lattice ? For experimental studies, the challenge clearly is to find a compound in which the exchange interactions between the orbitals are significant, while the coupling to the lattice and the corresponding crystal-field splitting are relatively small. Pseudo-cubic or perovskites are promising candidates, since orbital quantum fluctuations are particularly large for electrons (threefold degeneracy) in a cubic lattice (large frustration of the orbital interactions) [21], while the coupling to the lattice is smaller for electrons than for electrons in octahedral symmetry.
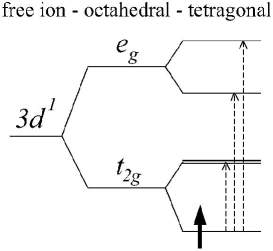
Studies of the coupling of orbital degrees of freedom to the lattice have a long history in the context of crystal-field transitions [54]. In a crystalline environment, the five-fold degeneracy of the orbitals is (partially) lifted by the electrostatic crystal field and by hybridization with the ligand ions. For instance in local cubic symmetry one finds a splitting into a triply degenerate level and a doubly degenerate level (see figure 1). The value of this splitting is denoted by 10 . For simplicity, we consider an insulating host lattice plus a Ti3+ impurity with a single electron in the shell. In the ground state, this electron occupies the energetically lowest crystal-field level. An orbital or crystal-field excitation corresponds to the promotion of this electron into a higher-lying orbital, e.g., from the level into the level (see figure 1). For the example of Ti3+, the excitation energy of this process typically amounts to 10 2 eV [55]. Similar values of 10 are also found for other transition-metal ions. This value is lying in the visible range and explains the vivid colors of gemstones such as ruby (impurities of Cr2O3 in an Al2O3 host lattice). Coming back to the analogy with the spin degrees of freedom, such a crystal-field excitation is similar to flipping an impurity spin in a tremendous external magnetic field. The challenge is to reduce the “external” field and to enter the realm where the collective nature of the excitations becomes relevant.
In a nearly cubic environment, the splitting of the subshell is much smaller than 10 . In the case of Ti3+ impurities in an Al2O3 host lattice, absorption features have been observed at about 5 and 13 meV in infrared transmittance measurements [56]. The splitting was attributed to the low-symmetry crystal field and spin-orbit coupling. However, the level splitting of 13 meV is much smaller than predicted by crystal-field theory, which was tentatively attributed to a reduction of the crystal field by a dynamic Jahn-Teller effect [56].
Inter-site interactions between orbitals may already be important in the case of impurities embedded into a host lattice (if the impurity concentration is large enough). Back in 1959 it was realized that the interactions between Cr3+ ions in concentrated ruby give rise to new structure in the optical data [57]. If the transition-metal ions form a lattice, the interactions between neighboring sites give rise to a finite hopping probability of an excited state from one site to another. Thus the excitation gains a finite dispersion or band width. It can be described in terms of a Frenkel exciton, i.e., a tightly bound electron-hole pair. The electron and the hole occupy the same site, but the pair may hop from one ion to another. In a translationally invariant system, the exciton is described by a superposition of local crystal-field excitations with a phase factor , where denotes the wave vector and runs over all transition-metal sites. This does not play a major role in the discussion of crystal-field excitations of electrons in the range of 10 because the dispersion usually is much smaller than both the excitation energy and the peak width (the latter arises from the coupling to the lattice, see the discussion of the Franck-Condon effect below). However, experimental evidence for a finite dispersion has been derived from the analysis of magnon-sidebands of crystal-field excitations at about 2.3 eV [58].
In a Mott-Hubbard insulator, the energy necessary to create a free electron-hole pair is of the order of , but the binding energy of a Frenkel exciton is also of the order of . Thus the Frenkel exciton may exist way below the band gap, and the relevant energy scale is set by the crystal-field splitting and by the hopping amplitude of the exciton between neighboring sites. Most noteworthy, the band width of a single doped carrier in an antiferromagnetic Mott insulator is strongly suppressed by the coupling to the spins, so that the band width of an excitonic particle-hole pair may even be larger than the one-particle band width [59].
The novel aspect of orbital waves or orbitons [26, 27, 28, 29, 30] is that the exchange interactions are assumed to mark the dominant energy scale, minimizing the kinetic energy. In this case, the collective nature of the excitations prevails over the local character, in analogy to spin waves. Note, however, that the orbital degree of freedom does not show continuous rotational symmetry. Orbitons in an orbitally ordered state thus are gapped. The dispersion and the excitation energy may be of comparable magnitude, giving rise to interesting novel effects. Examples are a possible contribution to the specific heat [21, 42], the renormalization of magnon spectra [60] or the formation of orbiton-magnon bound states [61] due to a coupling between spin and orbital degrees of freedom.
Optical spectroscopy has proven to be an excellent tool for the study of crystal-field excitations [54, 62]. Besides the determination of the excitation energy, it also provides valuable information via an analysis of the line shape observed in the optical conductivity . A detailed study of orbital excitations in thus may offer an important test whether novel collective phenomena appear in a particular compound. Here, we present optical data for a series of insulating transition-metal oxides (TiOCl, RTiO3 (R=La, Sm, Y), LaMnO3, Y2BaNiO5, CaCu2O3, and K4Cu4OCl10),111Parts of the data on LaMnO3 and on CaCu2O3 have been reported before in references [51, 63]. including early and late transition-metal ions, as well as systems, and systems in which the exchange coupling is predominantly three-dimensional, one-dimensional or zero-dimensional. Orbital excitations are observed in the range from about 2.5 eV down to about 0.25 eV. Only in LaMnO3 we did not find any signature of orbital excitations below the band gap. We compare the experimental data with theoretical results for the crystal-field excitations based on the point-charge model and on configuration-interaction cluster calculations. Our calculations satisfactorily describe all of our optical conductivity data, suggesting that the coupling to the lattice is dominant in these compounds. However, in the case of the low-energy modes ( 0.25 eV) in RTiO3 we cannot exclude a contribution from orbital fluctuations. But our results clearly demonstrate that the coupling to the lattice may not be neglected if one aims at a quantitative description of the orbital excitations of the above compounds. We suspect that this will turn out to be generally valid in insulating compounds. One may hope that the importance of low-energy orbital excitations is enhanced by choosing a system which is closer to a metal-insulator transition.
In the following section, we will discuss the selection rules for the observation of orbital excitations by means of optical spectroscopy. In the subsequent section 3, the point-charge model and the cluster calculations will be explained, whereas section 4 is devoted to experimental aspects. In sections 5 to 9 we will present the optical data of TiOCl, RTiO3, LaMnO3, Y2BaNiO5, CaCu2O3, and K4Cu4OCl10, respectively. Some general conclusions will be given in section 10.
2 Orbital excitations in optical spectroscopy
2.1 The case of a single ion
In the following paragraphs we first consider the physics of a single ion embedded into a host lattice. The effects of interactions between the transition-metal ions will be addressed in section 2.2.
The dominant contribution to the optical conductivity arises from electric dipole transitions. The matrix element for a - transition induced by a photon is proportional to
The dipole operator p has odd parity. Considering a transition-metal site with inversion symmetry, the above matrix element vanishes due to the even parity of the wave functions,
Hence a mere - transition is forbidden within the dipole approximation in compounds with inversion symmetry on the transition-metal site, i.e., the - transitions do not contribute to . However, there are several processes which allow the observation of - transitions, but one has to keep in mind that the corresponding features are only weak. In the present paper we will show examples for orbital excitations observed in which are due to (i) the absence of inversion symmetry on the transition-metal site, (ii) a phonon-activated mechanism, and (iii) magnon-exciton sidebands.
A very attractive way for the observation of orbital excitations opens up if the crystal structure does not show inversion symmetry on the transition-metal site, as e.g. in TiOCl (see section 5). In this case, parity is not a good quantum number, so that even and odd states mix. The amount of mixing can be estimated within the point-charge model, see section 3. It depends on the difference in energy between the even () and odd (e.g. or ) states and on how strong the deviations from inversion symmetry are. The small spectral weight of the orbital excitations is taken away from the dipole-allowed absorption band, e.g., from the - transition. The major advantage of this structurally induced mechanism is that it allows to make clear predictions on the polarization dependence of the orbital absorption features because the (local) symmetry of the mixed states can be determined unambiguously within the point-charge model. We use the room-temperature structure of TiOCl as an example (see section 5). For this compound we find that the lowest valence orbital predominantly shows character222The ligands are located approximately along the diagonals of the plane, hence denotes a state from the subshell. with a small admixture of character. The first excited state shows pure character, while the second excited state is mixed from and states. Therefore, a dipole transition from the ground state to the second excited state is weakly allowed for light polarization parallel to the axis, but not for or polarization:
| (1) |
| (2) |
Such polarization selection rules offer the possibility for a straightforward experimental test.
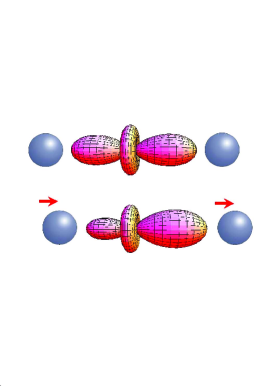
If the crystal structure shows inversion symmetry on the transition-metal site, this symmetry can be broken by an odd-symmetry phonon which is excited simultaneously with the orbital excitation [54, 62]. This again gives rise to the admixture of a small amount of odd character to the wave function (see figure 2). The dependence on the polarization of the incident light is less pronounced for this phonon-activated mechanism than for the structurally-induced mechanism described above, because in general phonons of arbitrary polarization may contribute, i.e., , and character can all be mixed into the states. In order to determine the orbital excitation energy, the phonon energy has to be subtracted from the experimentally observed peak position. One has to keep in mind that different phonons may break the symmetry. Typically, stretching and bending modes of the metal-oxygen bonds are most effective in doing so [54]. These modes have typical energies of the order of 50-80 meV. The fact that phonons with different energies may contribute and that these phonons additionally have some dispersion increases the width of the absorption band (the most important source for the line width is described by the Franck-Condon effect, see below).
Another way to break the symmetry is to add impurities to the system. However, it has been shown experimentally that this in general is by far less effective than the phonon-activated mechanism described above [54]. One way of testing whether a phonon is involved in the infrared absorption process is to compare the energies of the orbital excitations observed in and in Raman scattering. In compounds with inversion symmetry, the exclusion principle states that selection rules for Raman scattering and infrared absorption are mutually exclusive. Orbital excitations can be observed directly in Raman scattering because two photons are involved in the scattering process, thus the odd dipole operator has to be applied twice. The incoming photon excites an electron from a orbital to, e.g., a state, from which it falls back to an excited state under emission of a photon. Using again the example of a system, the transition from, e.g., to is Raman active in crossed polarization, for instance for () polarization of the incoming (outgoing) photon:
Other optical experiments which allow the observation of orbital excitations are, e.g., electroreflectance measurements [64] or third-harmonic spectroscopy [65]. Furthermore, - excitations have been studied by means of electron energy loss spectroscopy (EELS) [66].
Thus far we have neglected the spin selection rule. One has to keep in mind that optical spectroscopy with linearly polarized light is only sensitive to spin-conserving excitations, =0. This selection rule can be relaxed by taking into account spin-orbit coupling. Another possibility is to excite two spin-carrying modes simultaneously in such a way that the total spin amounts to zero. An orbital excitation from e.g. a triplet state to a singlet may gain a finite spectral weight by the simultaneous excitation of a magnon, giving rise to a so-called magnon-exciton sideband [58, 67, 68]. The spectral weight of these processes is even smaller than in the cases discussed above where the spin was not involved. Nevertheless these processes are dominant in systems with ions such as Mn2+ [58, 68], in which none of the excited states carries the same spin value as the ground state. In MnF2, both magnetic-dipole and electric-dipole transitions have been observed [58]. The magnetic-dipole character can be proven experimentally by the observation of a splitting in an applied magnetic field or by a detailed study of the polarization dependence, i.e., by showing that the absorption features depend on the direction of the magnetic field component and not on the electric field component.
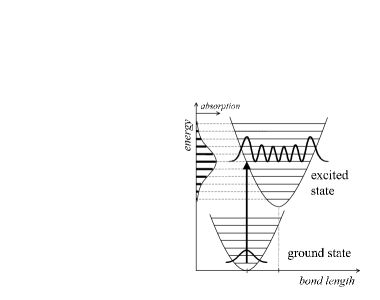
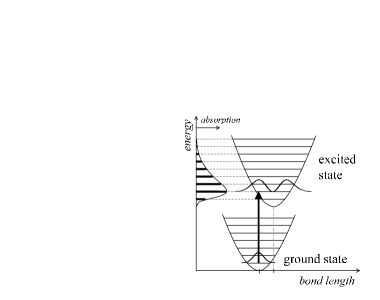
For the discussion of the line shape, one has to take the coupling to the lattice into account. The absorption band will be broadened by phonon sidebands according to the Franck-Condon principle, and the line shape depends on the difference of the relaxed bond lengths of the orbital states involved (for details see the caption of figure 3). We emphasize that this reflects the mixed, “vibronic” character of the eigenmodes (phonon + orbiton, or vibrational + electronic “vibronic” [54]) and thus holds irrespective of the mechanism responsible for the finite spectral weight of an orbital excitation. In particular, these phonon sidebands may not be confused with the phonon-activated mechanism described above and appear also in the case of, e.g., the structurally induced mechanism relevant for TiOCl or in Raman data.
2.2 Interaction effects
We have to address the question how to distinguish experimentally between a collective orbital excitation and a predominantly “local” crystal-field excitation. A direct observation of the dispersion of the orbital-momentum fluctuations by means of inelastic neutron scattering would manifest a watertight proof. While neutron scattering has been used for the study of crystal-field excitations of -electron compounds [69], we are not aware of such data for the case of electrons. Here, one has to keep in mind that the coupling to the lattice will smear out the orbital excitations significantly. Inelastic x-ray scattering offers another -dependent tool, but no collective orbital excitations were found in the study of LaMnO3, KCuF3 and YTiO3 presented in this focus issue [70].
Under the assumption that the dominant energy scale is set by the exchange interactions, the dispersion relations of orbitons have been calculated for the orbitally ordered states of LaMnO3, LaVO3, YVO3, and YTiO3 [26, 27, 30], and within a model focusing on the orbital fluctuations [28, 29]. Predictions have been derived for inelastic neutron scattering and Raman scattering. In section 2.1 above, we have discussed a Raman process in which the virtual excitation into a state was assumed to take place on a single site. In case of dominant exchange interactions, a two-site process involving the upper Hubbard band is considered [30], in analogy to the well-known two-magnon Raman scattering. For simplicity, we consider per site one electron and two orbitals. In the first step, the incident photon promotes an electron from site 1 to site 2, which becomes doubly occupied. In the second step, an electron hops back from site 2 to 1 under emission of a photon. In the final state, one or both electrons may be in an excited orbital, i.e., the exchange process may give rise to one-orbiton and/or two-orbiton excitations [30]. Depending on the hopping amplitudes between the different orbitals on adjacent sites, distinct polarization selection rules have been predicted [26, 30].
The excitation of two orbitons with momenta in principle allows to probe the orbiton dispersion throughout the entire Brillouin zone, since only the total momentum needs to be equal to zero in Raman scattering. Information about the dispersion is contained in the line shape of the two-orbiton Raman band, but a detailed analysis of the line shape encounters several problems: (i) in general, the Raman line shape depends on the frequency of the incident photons (resonance behaviour), (ii) the orbiton-orbiton interactions are essential for the line shape, but have not been taken into account up to now and (iii) the coupling to the lattice reduces the orbiton dispersion.
The optical conductivity thus far has not been considered as a tool for the investigation of orbitons. Starting again from the crystal-field limit, we note that the optical data of a crystal-field Frenkel exciton with a dispersion much smaller than its energy is in principle very similar to the data of a single impurity ion embedded in a host lattice. In particular, optical spectroscopy is restricted to the observation of excitations with momentum =0, and the selection rules are the same as for the case of a single impurity ion. Nevertheless the dispersion may play a role if two modes are excited simultaneously, as e.g. in a magnon-exciton sideband [58] or in the phonon-activated case. Only the total momentum needs to be equal to zero, and one has to sum up contributions from excitons from the entire Brillouin zone.
As far as the intersite exchange processes discussed above for the Raman case are concerned, Khaliullin [71] has pointed out the possibility of two-orbiton-plus-phonon absorption, similar to the two-magnon-plus-phonon absorption proposed by Lorenzana and Sawatzky [72, 73] for spin systems. In systems with inversion symmetry in between adjacent sites, the exchange of two electrons does not give rise to a dipole moment. Similar to the phonon-activated mechanism for the observation of crystal-field transitions described above, this selection rule can be relaxed by the simultaneous excitation of a phonon [72, 73]. The two-“magnon”-plus-phonon absorption333Here, we have used the term “magnon” to denote spinons in spin chains, triplons in spin ladders and magnons in a long-range ordered antiferromagnet. has been established as an interesting tool for studies of antiferromagnetic spin chains, spin ladders, and layered antiferromagnets [15, 74, 75, 63, 76, 77, 78]. Since the phonon contributes to momentum conservation, the optical conductivity probes the two-magnon or two-orbiton spectral function throughout the entire Brillouin zone, in contrast to two-orbiton Raman scattering, which reflects only the =0 part of the two-orbiton spectrum. Thus, both the line shape and the peak position are expected to be different in as compared to Raman data. In spin systems, the excitation of a single magnon does not contribute to due to the spin selection rule. In the case of orbitons, however, the phonon-activated single-site mechanism used for the study of crystal-field excitations will also be at work if the exchange interactions are dominant. Thus one has to expect a superposition of orbiton-plus-phonon and two-orbiton-plus-phonon contributions.
Thus far we have discussed the two limiting cases, crystal-field excitations for dominant coupling to the lattice and collective orbital waves for dominant exchange interactions. Detailed theoretical predictions for the contribution of orbital waves to the optical conductivity would certainly be very helpful in order to distinguish experimentally between a predominantly local excitation and a collective mode. However, a quantitative description of experimental data will require to treat both the exchange interactions and the coupling to the lattice on an equal footing [79].
3 Configuration-interaction cluster calculations and the point-charge model
Thus far, no detailed predictions exist for the optical conductivity in the case of
dominant exchange interactions. We thus compare our experimental data with the
predictions for “local” crystal-field excitations.
Configuration-interaction (CI) cluster calculations have been performed for many years
in order to assign the correct symmetry and orbital occupancy to - excitations
(see, e.g., chapter 10 of reference [54]).
A typical cluster consists of the transition-metal ion and the surrounding anions,
e.g., [TiO6]9-. More distant ions are taken into account as point charges only.
The following parameters are being used: (i) the Slater integrals,
(ii) the local crystal field, and (iii) the tight-binding parameters.
ad (i)
The Slater integrals describe the full local electron-electron interactions which give
rise to the main multiplet structure.
They have been obtained from Hartree-Fock calculations for a bare ion [80].
Then, these values have been reduced to 80% in order to account for the neglect of
the shell.
ad (ii)
The crystal field or Madelung potential represents the electrostatic potential of all ions
within the crystal, which is assumed to be infinite. The ions are considered to be point
charges. The crystal field controls the on-site energies and gives rise to the energy
splitting between the orbitals.
We have calculated the crystal field using an Ewald summation, i.e., the summation is
partly performed in real space, partly in momentum space, and thus pertains to the
infinite crystal.
The orbital splitting depends on the local derivatives of the Madelung potential.
Therefore we expanded the Madelung potential in terms of spherical harmonics,
which allows to calculate the ionic crystal-field splitting if the expectation values
of are known [81], where denotes the electron coordinate
with respect to the transition-metal site and the order of the expansion.
These expectation values have been obtained from Hartree-Fock calculations [80].
ad (iii)
The tight-binding parameters account for hopping processes between the ligands and
the transition-metal ion [82, 83]. For many materials they are
well known from fits to LDA band-structure calculations. Some general rules have been
derived for the dependence of the parameters and on the distance
between two ions [82].
Finally, the values for the on-site Coulomb repulsion on the transition-metal site ()
and on the ligands () as well as the charge-transfer energy have been
taken as reported from core-level and photo-emission spectroscopy [84].
The cluster calculations have been performed using the code XTLS8 by A. Tanaka [85].
In case of the Ti3+ compounds, we report both the crystal-field splitting arising from the electrostatic potential (indicated below as point-charge model) and the result of the cluster calculation including the hybridization with the ligands.
4 Experimental
Details concerning the crystal growth and the characterization have been described in reference [86] for TiOCl, in [35, 87] for RTiO3, in [88] for LaMnO3, in [89, 90] for Y2BaNiO5, in [91] for CaCu2O3, and [92] for K4Cu4OCl10.
Using a Fourier-transform spectrometer, we have measured the transmittance and reflectance in the energy range from 0.01 eV up to 3 eV at temperatures varying from 4 K to 775 K. With the knowledge of both transmittance and reflectance it is possible to directly calculate the complex optical conductivity [93]. For the transmittance measurements the samples were polished on both sides. The reflectance was measured on samples with a thickness of mm which were polished on only one side to prevent a contribution from multiple reflections within the sample. In order to determine accurately, the thickness of the samples used for the transmittance measurement must be chosen appropriately. Note that the transmittance depends exponentially on [93]. For each compound studied here, transmittance data were collected on various samples with varying thickness (e.g., ranging from 12.5 to 300 m in case of LaTiO3 and from 2 to 500 m in LaMnO3). Thick samples ( of the order of several 100 m) are sensitive to weak absorption features (), but they become opaque for larger values of . Thinner samples allow to determine larger values of , but in the range of weak absorption the spectra are dominated by Fabry-Perot interference fringes. Single crystalline samples with m are difficult to handle. In particular, the surfaces of polished crystals are not absolutely parallel to each other, so that the thickness may vary by a few m across the sample. This significantly complicates a quantitative analysis of the data of very thin samples. A reliable analysis of transmittance data measured on thin single crystals is hence restricted to values of smaller than about . For larger values of , the transmittance has to be measured on thin films. Alternatively, a Kramers-Kronig analysis of the reflectance or ellipsometric techniques may be used. However, measuring the transmittance is essential for an accurate determination of weak absorption features such as - transitions.
Here, we focus on insulating samples. The accessible energy range for transmittance measurements is therefore limited by the strong absorption of fundamental phonon excitations below about 80 meV and by the steep rise of at the onset of excitations across the electronic gap.
5 Orbital excitations in TiOCl
Recently, TiOCl has been discussed as a novel inorganic spin-Peierls system [32, 33, 86, 94, 95, 96, 97, 98, 99, 100, 101, 102, 105, 106, 107, 108, 109, 110]. Above about 200 K, the magnetic susceptibility is described well by a model for a one-dimensional homogeneous S=1/2 chain with exchange constant 676 K [86]. At =67 K, shows a transition to a non-magnetic ground state [32, 86]. However, indications for a second transition (or crossover) at 92 K are observed in the magnetic susceptibility [32, 86] as well as in NMR [95] and ESR data [86]. Strong fluctuations above 92 K were discussed on the basis of NMR [95], Raman and infrared data [96, 97, 98]. The phase transition at is generally interpreted as a spin-Peierls transition. This is corroborated by the observation of a doubling of the unit cell along the direction below in x-ray scattering [101, 102]. However, the physics at higher temperatures and in particular the occurrence of a second phase transition have not been understood so far. It has been speculated [32, 86, 95, 96, 97, 98, 99, 100] that this unconventional behaviour is caused by strong orbital fluctuations, assuming a near degeneracy of the subshell in this distorted structure.
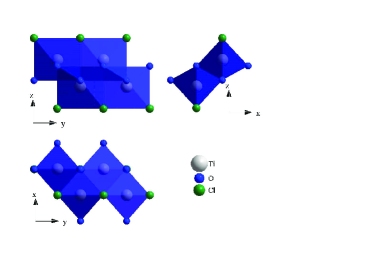
The structure of TiOCl consists of buckled Ti-O bilayers separated by Cl ions. The bilayers are stacked along the direction. The [TiO4Cl2] octahedra are strongly distorted (see figure 4). In particular, they are strongly compressed along the axis. At room temperature, the Ti-O bond lengths are 1.96 Å in direction, whereas the bond lengths in the plane amount to 2.19 Å for the Ti-O bonds and 2.40 Å for the Ti-Cl bonds [103]. On each Ti site, the ground-state orbital has predominantly character (see below), forming one-dimensional chains along the (or ) direction. The space group is at 300 K and at 4 K [101]. There is no inversion symmetry on the Ti site, thus orbital excitations are directly infrared active, i.e., they contribute to without the additional excitation of a phonon. In this case the point-charge model does not only allow to estimate the transition energies, but also the polarization dependence of the orbital excitations can be predicted (see equation 1). In particular, strict polarization selection rules apply in the room-temperature structure (see table 1). Below the distortions give rise to a mixing of the orbitals, hence the polarization selection rules are not strict anymore. Nevertheless it is possible to give some “effective” selection rules because the dipole matrix elements for the main transitions are about three orders of magnitude (or more) larger than for the weak ones.
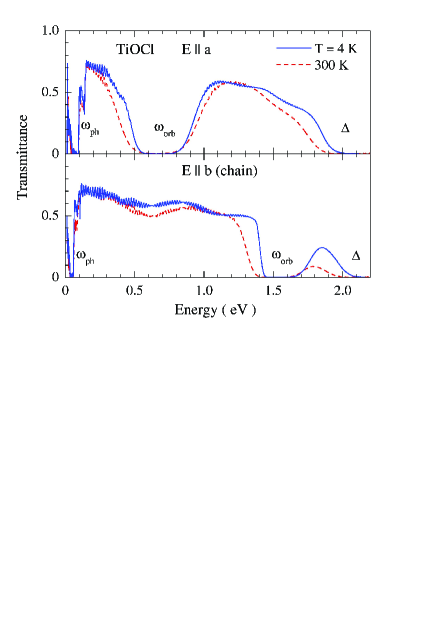
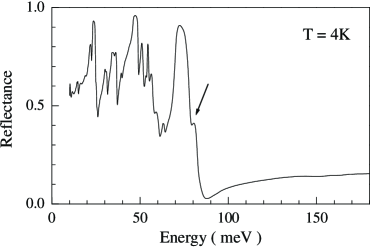
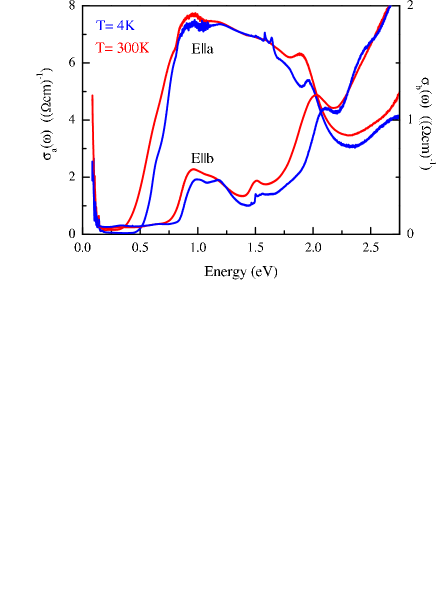
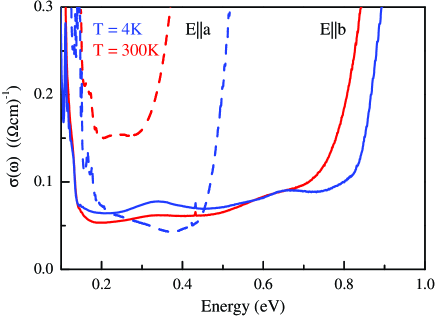
The transmittance measured on a thin single crystal of TiOCl is depicted in figure 5 for two polarization directions, and . Unfortunately, measurements with could not be performed since the available samples are very thin in the stacking direction. Our data are in agreement with unpolarized measurements reported for energies above 1.3 eV [104]. Above about 2 eV, the sample is opaque due to excitations across the gap. The transmittance is strongly suppressed at 0.6-0.7 eV for and 1.5-1.6 eV for . The absorption feature at 0.65 eV appears as a weak dip also for , and the feature at 1.5 eV gives rise to a weak shoulder for . An interpretation in terms of phonons or magnetic excitations can be excluded at these energies. The excitation energies and in particular the polarization dependence are in good agreement with the results of the cluster calculation (see table 1). Thus these features can unambiguously be attributed to orbital excitations. As far as the polarization selection rules are concerned, the appearance of weak features in the other polarization at 300 K can be attributed either to a small misalignment of the polarizer, to absorption due to the phonon-activated mechanism, or to a small admixture of character to the ground state (see below), e.g. by spin-orbit coupling or due to the dispersion (i.e., away from the point). The absorption at about 1.5 eV shows an asymmetric profile with a steep drop of the transmittance on the low-energy side, in agreement with the expectations for phonon sidebands in case of small changes of the relaxed bond length (see figure 3). A precise determination of the line shape requires measurements on a thinner sample, in which the transmittance is not suppressed to zero. The data for K and for 300 K are very similar, but the line width increases with increasing temperature.
In the cluster calculation for TiOCl, we have to take into account the hybridization between the Ti ions and both, O as well as Cl ions. In comparison to for instance LaTiO3 or LaMnO3, we thus have two additional parameters, namely the charge-transfer energy between Ti and Cl, and the Ti-Cl hybridization . In fact, an accurate description of hybridization effects is essential in order to reproduce the splitting between the and subshells. Due to the strong compression of the octahedra along , the electrostatic contribution of the point-charge model predicts that the lowest excited state has character, i.e., belongs to the subshell.444The ligands are located approximately along the diagonals of the plane, hence denotes a state from the subshell. At the same time, the polarization selection rules given in table 1 predict for 300 K that this transition to the level (with a small admixture of character) can be observed for . Experimentally, the corresponding absorption feature for is found at about 1.5 eV, i.e., more than 1 eV higher than predicted by the point-charge model. However, the energy of this transition can be described correctly by taking into account the hybridization between Ti and its ligands, which typically adds more than 1 eV to the splitting between and subshells.
The parameters =4 eV, =5 eV, and =3 eV are estimated following the LDA+U results of reference [99]. The orbital excitation energies depend only weakly on . In order to model the relative strength of the Ti-O and the Ti-Cl hybridization, we have to consider the larger ionic radius of Cl compared to O ( 0.4 Å) as well as the larger polarizability. For the former we assume that the hybridization is the same for the two ligands if the bond length equals (X=O, Cl). Additionally, the larger polarizability of Cl compared to O is modelled by a factor by which the Ti-Cl hybridization is further enhanced. Good agreement between the calculated energies and the experimental results at both temperatures is obtained for (see table 1).555Enhancing by is necessary in order to push the level (from the subshell) up to 1.5 eV. With increasing , the energy of the orbital increases strongly, whereas the energies of and (from the subshell) decrease. For =1 we find the following excitation energies: 0.32, 0.79, 1.32, and 2.21 eV at 4 K for the site labeled Tia in table 1.
-
theory: character admixture (300 K) – main admixture (4 K) point charge (300 K) 0 0.39 0.68 0.34 1.28 cluster (300 K) 0 0.25 0.69 1.24 2.11 cluster (4 K, Tia) 0 0.26 0.73 1.53 2.20 cluster (4 K, Tib) 0 0.25 0.77 1.47 2.18 polarization (300 K) - main polarization (4 K) exp.: energy - 0.65 1.5 - polarization - -
The energy of the lowest excited state ( orbital) is crucial in order to determine whether orbital fluctuations are the correct explanation for the interesting physics observed in TiOCl. In the room-temperature structure, the transition to the first excited state is not directly infrared active, but it becomes directly infrared active in the distorted low-temperature structure below . According to our cluster calculation, the lowest excited state is expected at about 0.2-0.25 eV. However, our infrared data do not show a distinct absorption feature in this range (see figure 5). A rough estimate of the spectral weight can be obtained from the point-charge model, which predicts that the dipole matrix element at 4 K is about one order of magnitude smaller than for the transition to the orbital. Due to a factor of , this means that the spectral weight of the excitations to the and to the orbital should be comparable in . One possible explanation for the lack of a corresponding feature in our infrared data is that the first and the second excited states are nearly degenerate, as indicated by band-structure results [32, 99].
The scenario of strong orbital fluctuations assumes a near degeneracy of the states and . However, a sizeable admixture of the state with character to the ground state would have drastic consequences for the selection rules. A transition from to () will give rise to absorption for (), i.e., just the opposite of the selection rules derived for the transitions from the state. This may explain the weak features at about 0.65 eV for and 1.5 eV for , but at the same time the weakness of these features compared to the strong absorption in the perpendicular direction puts a severe limit to the admixture of character to the ground state. Moreover, the factor observed in ESR spectroscopy is close to 2 [86], which indicates that the orbital moment is quenched by a significant splitting ( eV) within the subshell. A sizeable splitting of the subshell is in agreement with recent LDA+U and LDA+DMFT results [108, 109, 110]. However, the degree of orbital polarization still needs to be clarified. In reference [108], the lowest orbital ( in our notation) is populated by only 70%, indicating the possible importance of inter-orbital fluctuations, whereas a population with 0.98 electrons was reported in reference [109].
Both our cluster calculation and in particular the observed polarization dependence show that there is no significant admixture of the orbital to the ground state. Thus orbital fluctuations are clearly suppressed. In order to understand the interesting physics of TiOCl it is therefore sufficient to consider the interplay of lattice and spin degrees of freedom. We suggest that the occurrence of two phase transitions results from the frustration of interchain interactions in this peculiar bilayer structure [107].
The remarkable splitting of 0.65 eV of the subshell is caused by the strong distortions of the [TiO4Cl2] octahedra and by the different charges on O and Cl sites within an octahedron. This large splitting clearly shows that systems are not necessarily good model compounds for the study of orbital effects based on (near) orbital degeneracy within the ground state.
6 Orbital excitations in RTiO3 (R=La, Sm, Y)
One of the novel quantum phenomena proposed in the field of orbital physics are orbital liquids, in which long-range orbital order is suppressed by quantum fluctuations [19, 20, 21, 22]. Based on neutron scattering results, the pseudo-cubic perovskite LaTiO3 has been discussed as a realization of an orbital liquid [21, 31]. In comparison to compounds with electrons, systems are promising candidates for interesting orbital phenomena due to the threefold orbital degeneracy and due to the smaller coupling to the lattice. However, the results for TiOCl discussed above show that also the splitting of the subshell can be significant. In LaTiO3, a detailed study of the structure revealed a sizeable distortion of 3%, lifting the orbital degeneracy [35]. At this stage, it is heavily debated whether LaTiO3 represents an orbital liquid [21, 31, 35, 36, 37, 38, 39, 40, 41, 42, 43, 44, 45, 46, 47, 48, 49]. The scenario of an orbital liquid requires that the reduction of the ground-state energy by quantum fluctuations is larger than the energy splitting of the orbitals due to the distortion. A study of the orbital excitations and the determination of the excitation energies are very interesting in this context.
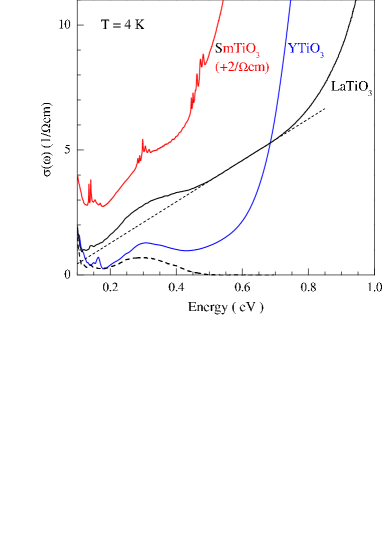
In RTiO3, the magnetic ordering changes as a function of the ionic radius of the R ions from antiferromagnetic for R=La to ferromagnetic for R=Y. Within the orbital-liquid model it has been proposed that the transition from antiferromagnetic order to ferromagnetic order should define a quantum critical point. SmTiO3 is still antiferromagnetic, but lies close to the critical value of the ionic radius [113]. By measuring both the transmittance and the reflectance on twinned single crystals we were able to observe phonon-activated orbital excitations in LaTiO3, SmTiO3 and YTiO3 at about 0.3 eV, i.e., in the frequency range between the phonons and the band gap (see figure 6). In YTiO3, the Hubbard gap can be identified with the onset of strong absorption at about 0.6 eV. In LaTiO3, the optical conductivity shows strong absorption above 0.8 eV, but an absorption tail extends down to about 0.2 eV. In a recent LDA+DMFT study, the Hubbard gap of LaTiO3 (YTiO3) was reported to be 0.3 eV (1 eV) [48]. This issue of the onset of interband excitations will be discussed elsewhere. Here, we focus on the weak absorption features at about 0.3 eV observed in LaTiO3, SmTiO3 and YTiO3.
An interpretation in terms of phonons can be excluded since phonon absorption is restricted to below 80 meV. The small peak in YTiO3 at about 160 meV typically marks the upper limit for two-phonon absorption in transition-metal oxides with perovskite structure [51]. Absorption of three or more phonons has to be much weaker. According to the magnon energies observed by inelastic neutron scattering [31, 114], the energy of 0.3 eV is much too high also for phonon-assisted magnetic absorption (i.e., two magnons plus a phonon [72, 73]). The very sharp additional absorption lines observed in SmTiO3 at about 0.15, 0.3 and 0.45 eV are attributed to crystal-field transitions within the Sm shell [111]. These lines are much narrower than the - bands because in case of the levels both the coupling to the lattice and the coupling between nearest-neighbor sites are much smaller.
Our interpretation of the features at about 0.3 eV in terms of orbital excitations is strongly corroborated by Raman scattering data of LaTiO3 and YTiO3. A detailed analysis of the Raman data can be found in reference [112]. The Raman spectra show similar features as the optical conductivity but shifted to lower energies by 50-70 meV. As discussed above, - transitions have even parity and are thus Raman active, whereas a contribution to arises only due to the simultaneous excitation of a phonon breaking the inversion symmetry on the transition-metal site. The observed shift of 50-70 meV is in good agreement with the energies of the Ti-O bond-bending and bond-stretching phonon modes, which are expected to yield the dominant contributions (see section 2). Moreover, the transition probability for such a multi-particle excitation (“orbiton” plus phonon) is small, in agreement with the small absolute value of .
-
La point charge 0 0.21 0.23 0.9 1.0 cluster 0 0.24 0.26 2.2 2.4 Sm point charge 0 0.15 0.26 0.9 1.0 cluster 0 0.21 0.31 2.2 2.5 Y point charge 0 0.14 0.28 0.9 1.0 cluster 0 0.19 0.33 2.2 2.4
We thus conclude that the orbital nature of the features is unambiguous. The orbital excitation energy amounts to about 0.2-0.25 eV (without the symmetry-breaking phonon). The central issue is whether these features reflect the collective nature of orbital fluctuations [71] or whether they have to be interpreted as local crystal-field excitations. In principle, both the superexchange coupling between the orbitals and the coupling of the orbitals to the lattice will contribute to the excitations, thus the question has to be addressed on a quantitative level. Theoretical treatments which take into account both kinds of coupling on an equal footing clearly would be very interesting.
At this stage, such calculations are not available. Thus we focus on a comparison of our data with the results for local crystal-field excitations obtained within the point-charge model and a cluster calculation (see section 3). We have used the structural data of reference [35] for LaTiO3, of reference [113] for SmTiO3, and of reference [115] for YTiO3. As discussed for TiOCl, the point-charge model underestimates the splitting between the and subshells by more than 1 eV. At the same time, the predictions of the point-charge model and of the cluster calculation for the splitting of the subshell are rather similar, with a maximum difference of 0.06 eV. We find good agreement between theory and experiment concerning the peak energy of 0.2-0.25 eV in all three compounds (see table 2). Similar values for the splitting result from a recent LDA+DMFT study, in which the covalency between R and O ions has been identified as the driving force for the distortions [48]. Significantly smaller values (27 and 181 meV for YTiO3; 54 and 93 meV for LaTiO3) have been derived from tight-binding fits of the band structure [49]. On the basis of x-ray absorption and spin-resolved photo-emission data of LaTiO3, it has been concluded that the splitting between the ground state and the lowest excited state is about 0.1-0.3 eV [37]. Our results for TiOCl (see above) show that 0.2-0.25 eV is not an extraordinarily large value for the splitting of a Ti3+ compound.
The above mentioned change of the magnetic ordering pattern as a function of the ionic radius of the R ions is accompanied by a change of the character of the distortions [113]. The radius of the Sm3+ ions is close to the critical value [113]. One thus may have hoped to find a smaller crystal-field splitting in SmTiO3. In contrast, the orbital fluctuations model predicts that the orbital excitations for not too low energies are very similar across the quantum critical point [71], in agreement with the experimental result. Our calculations predict that the splitting between the first and the second excited states increases from La via Sm to Y. However, the energies are not as sensitive to the radius of the R ions as one may have expected, and we consider these small differences as smaller than the absolute uncertainty of the calculation. Moreover, the experimental features are too broad and too close in energy to the excitations across the gap in order to test this prediction.
Within the crystal-field scenario, the large line width can be explained by the coupling to the lattice, i.e., in terms of the Franck-Condon effect (see section 2). The additional excitation of a symmetry-breaking phonon in the infrared measurements may give rise to an additional broadening in as compared to the Raman data.
At the present stage, the orbital excitation energy and the observed distortions [35] can be described satisfactorily within a local crystal-field scenario, in which the splitting is dominated by the coupling to the lattice. On the basis of our optical conductivity data, we did not find any clear evidence for strong orbital fluctuations. Also the isotropic spin-wave dispersion of LaTiO3 observed in inelastic neutron scattering [31] can be explained within a crystal-field scenario [116, 117]. The small ordered moment may result from the combination of quantum fluctuations within the spin channel, spin-orbit coupling and the small Hubbard gap. The latter gives rise to enhanced fluctuations both in the charge and in the orbital channel and thus may contribute significantly to the reduction of the ordered moment [118].666At the same time, this is the central idea behind the orbital liquid scenario: the small gap gives rise to strong orbital fluctuations which in turn reduce the spin order [21].
Nevertheless, the uncertainty of the theoretical predictions for the crystal-field splitting is too large to rule out a finite contribution from orbital fluctuations. The energy of 0.2-0.25 eV is certainly too high for a one-orbiton excitation in a collective mode scenario. However, it possibly can be reconciled with two-orbiton excitations [71], or with the sum of crystal-field and fluctuation contributions. Additional information can be derived from the Raman data. The resonance behavior and the polarization dependence yield evidence for a collective nature of the orbital excitations in RTiO3 [112]. Detailed predictions for the energy and the line shape of orbitons in the optical conductivity are necessary to further clarify this issue.
7 Orbitons vs. multi-phonon peaks in LaMnO3
In the manganites, the orbital degree of freedom certainly plays an important role [119]. In contrast to the threefold degeneracy of the configuration of Ti3+ ions, the configuration of Mn3+ ions is doubly degenerate within the orbitals in a cubic environment. The degeneracy can be lifted by both a collective Jahn-Teller effect and by orbital interactions. In LaMnO3, orbital order has been observed below =780 K [120, 121, 122]. In order to explain the existence of orbital order at temperatures above the spin ordering temperature, it is necessary to invoke the Jahn-Teller effect. It has been proposed that the experimentally observed orbital ordering pattern can be explained by taking into account anharmonicity [123].
Raman scattering data reported for orbitally ordered LaMnO3 have been interpreted as the first experimental evidence for the existence of orbitons [26]. This claim is based on the observation of three Raman lines at 126, 144 and 160 meV, on their temperature dependence and on the analysis of the polarization dependence. Since Raman spectroscopy is restricted to =0 excitations, it is not possible to follow the dispersion of the elementary excitations. However, in the case of LaMnO3 one expects different excitation branches with different symmetries at =0, and these were identified with the three Raman lines [26]. We have challenged the orbiton interpretation on the basis of a comparison with the optical conductivity spectrum [51] (see also [126]).
In LaMnO3, the direct observation of orbital excitations is allowed in Raman spectroscopy, but a contribution to requires to break the parity selection rule, e.g., via the simultaneous excitation of a phonon. Therefore, the orbital excitations are expected to be shifted in with respect to the Raman lines by the phonon energy of roughly 50-80 meV (see section 2 and reference [124]), in agreement with the results for RTiO3 discussed in the preceding section.
We have determined very accurately in the relevant frequency range (see figure 7) by measuring both the transmittance of thin (twinned) single crystalline platelets and the reflectance of a sample with mm (figure 8). The small spectral weight of the various features observed in figure 7 at energies above about 80 meV, i.e., above the range of fundamental phonon absorption, is typical for multi-phonon spectra in insulating transition-metal oxides. For comparison, see, e.g., the spectra of of RTiO3, Y2BaNiO5 or CaCu2O3 in the present work or of LaCoO3 in reference [51].
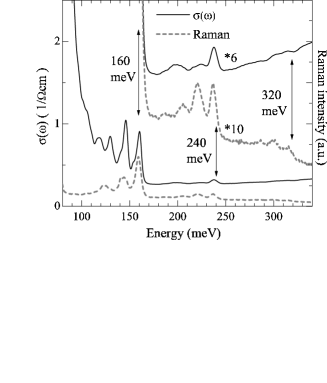
In we find absorption features at about 118, 130, 146 and 160 meV which are very similar to the three Raman lines mentioned above. Moreover, we identify some weak features at about 240 and 320 meV. At the latter two energies, very similar features have been observed in Raman scattering777The Raman measurements have been performed by K.-Y. Choi, P. Lemmens and G. Güntherodt at the RWTH Aachen, Germany [125]. The Raman data have been obtained in a quasi-backscattering geometry using a laser energy of 2.34 eV (Ar+ laser). on the same samples by Choi and collaborators [125] (see figure 7), using a surface that had been polished for the transmittance measurement. The highest infrared-active fundamental phonon mode is observed in the reflectance data at about 80 meV (see figure 8 and references [126, 127]). It has been interpreted as a zone-boundary Mn-O bond-stretching mode which is folded back to =0 in the orbitally ordered state [126]. A weak Raman line has been found at the same frequency [53, 125]. Given the existence of a fundamental mode at 80 meV, the features at 160, 240 and 320 meV are naturally explained as two-, three- and four-phonon modes, respectively. In particular, the Raman line at 160 meV is certainly not too high in energy for a two-phonon mode. At 160 meV, similar two-phonon features are observed also in other pseudocubic perovskites such as LaCoO3 [51] or YTiO3 (see figure 6). Three-phonon Raman scattering in LaMnO3 at room temperature and above has been reported recently in the range from 210-250 meV [53]. Multi-phonon Raman scattering is predicted to be strong in orbitally ordered LaMnO3 due to the Franck-Condon effect [128] (see figure 3).
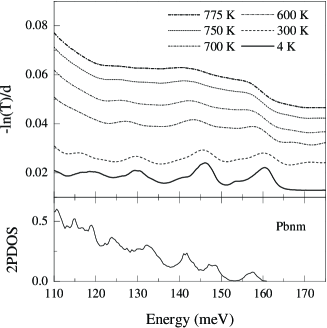
Let us briefly address the issue of selection rules and the problems for a theoretical description of multi-phonon features. The symmetry of a multi-phonon mode has to be derived using the multiplication rules of the irreducible representations of the contributing fundamental modes. Thus an overtone of a forbidden fundamental mode may very well be allowed. Peaks within the two- or multi-phonon continua reflect a high density of states and do not necessarily correspond to simple multiples of =0 phonon modes. A precise theoretical treatment of the two- and multi-phonon continua requires a detailed knowledge of the dispersion of the fundamental modes throughout the entire Brillouin zone. Unfortunately, such a detailed analysis of neutron scattering data has failed so far due to the twinning of the samples [129]. Moreover, multi-phonon features may depend strongly on the sample quality and on details of the sample growth [130], which strongly complicates a meaningful comparison with theory. The bottom panel of figure 9 shows the =0 part of the two-phonon density of states calculated for LaMnO3 in Pbnm symmetry.888The calculations of the two-phonon density of states have been performed by W. Reichardt (FZ Karlsruhe, Germany). The calculation is based on a shell model [131], the parameters have been deduced from similar perovskite compounds where the lattice dynamics was studied in detail. The highest two-phonon peak is predicted slightly below 160 meV, the overall structure is in reasonable agreement with the optical data.
Within the orbiton interpretation, an explanation of features at the same energy (e.g., 160 meV) in Raman and infrared spectroscopy requires to break the parity-selection rule without the simultaneous excitation of a phonon. This can in principle be achieved by impurities, but the phonon mechanism lined out above turns out to be much more effective [54]. Roughly speaking, a small impurity concentration of, e.g., 1% breaks the selection rule only at a small percentage of sites, whereas the phonon is effective throughout the entire sample. This is corroborated by the shift between the Raman and the infrared data observed in RTiO3 (see above). Moreover, the remaining differences between the Raman and the infrared spectra – e.g., the peak energies of 126 and 144 meV as compared to 118, 130 and 146 meV – can easily be attributed in the multi-phonon case to the different selection rules, giving different weight to the two-phonon density of states. However, the orbiton scenario including impurities to account for the parity selection rule predicts identical peak energies in both spectroscopies.
One argument favoring the orbiton interpretation was the disappearance of the relevant Raman lines upon heating above the orbital ordering temperature =780 K [26]. We have measured the transmittance of LaMnO3 at temperatures up to 775 K (see figure 9), the highest temperature available in our experimental setup. The room-temperature spectra before and after heating to 775 K are identical, showing that the oxygen content of the sample did not change significantly upon heating. The absorption bands in the range of 120-160 meV broaden strongly with increasing temperature, but they clearly persist also at 775K̇, i.e., close to . The sensitivity of the Raman lines [26, 125] indicates that these multi-phonon lines are Raman forbidden in the high-temperature structure and become Raman allowed due to the symmetry change across the phase transition.
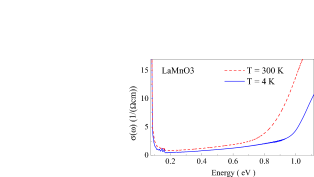
We have tried very carefully to find the orbital excitations at higher energies by investigating the transmittance of several different samples of LaMnO3, varying the thickness between 2 and 500 m. Transmittance measurements on a thick sample are sensitive to very weak absorption features, whereas thin samples are better suited for the determination of larger values of (see section 4). Our data do not show any absorption band between the multi-phonon range and the onset of excitations across the Mott gap at about 1 eV [132, 133] (see figure 10).
Allen and Perebeinos [134] predicted a strong orbital absorption band centered around 2 eV with a Gaussian envelope of vibrational sidebands starting at about 1 eV. Additionally, they predicted a strong temperature dependence close to the onset of absorption, in agreement with our data. A detailed comparison between theory and experiment requires a precise determination of the line shape to still higher frequencies, i.e., measurements on still thinner samples.
In comparison with our data of orbital excitations observed in other transition-metal oxides presented in this paper, the results on LaMnO3 strongly suggest that the orbital excitations are pushed to energies above 1 eV due to the rather strong Jahn-Teller effect in this electron system. Theoretical estimates of the splitting vary between 0.7 and 2 eV [134, 135, 136, 137, 138, 139, 140]. In a cluster calculation we have obtained a ground state quintuplet, while the two lowest excited states are triplets lying at 1.3 eV and 1.8 eV, respectively (for =7.5 eV and =4.5 eV [84]). Our calculation predicts the lowest quintuplet, which corresponds to the splitting of the subshell, at about 1.9 eV. Recently, a Jahn-Teller splitting of the order of 2 eV was derived from resonant Raman scattering data [52, 53]. A large Jahn-Teller splitting is also in agreement with the absence of low-energy orbiton features in inelastic x-ray data [70].
The eigenmodes show a mixed character (phonon-orbiton) if the coupling to the lattice (Jahn-Teller effect) and the orbital exchange interactions are taken into account on an equal footing [79]. In reference [125], the coupling between phonons and orbitons is discussed on the basis of the changes observed in the (multi-)phonon Raman spectra upon variation of temperature, symmetry or doping level. An interpretation of the Raman features at about 160 meV in terms of phonon-orbiton mixed modes with predominantly orbiton character requires a rather small value for the electron-lattice coupling [79]. However, if the Jahn-Teller splitting is large ( 1 eV), the spectrum recovers the shape predicted by the Franck-Condon effect (see figure 3) [79]. Note that increasing the coupling to the lattice results not only in a blue shift of the excitation energy but also in a suppression of the orbital band width.
In summary, our search for orbital excitations below the Mott gap was not successful in LaMnO3. We are convinced that undoped LaMnO3 is not a good model system for the study of orbital waves.
8 Y2BaNiO5
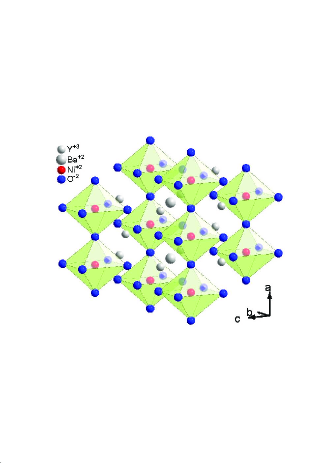
The compound Y2BaNiO5 is an example of a Haldane system, an antiferromagnetic =1 chain with an energy gap between the collective spin-singlet ground state and the lowest excited triplet state. The exchange coupling constant has been determined by neutron scattering, 21 meV [141, 142]. The chains are formed by corner-sharing NiO6 octahedra (see figure 11) and run along the axis. The Ni-O distance is only 1.89 Å parallel to the chains, whereas it amounts to 2.19 Å perpendicular to the chains. Thus the octahedra are strongly compressed.
The optical conductivity as determined from transmittance and reflectance measurements is shown in figure 12 for two polarization directions, and . In figure 13 we plot the spectra below 1 eV on an enlarged scale. Several broad peaks are observed between 0.34 and 2.5 eV in both polarization directions, and the spectra display a pronounced polarization dependence. As in the other compounds discussed above, phonons are limited to energies below about 80 meV. A magnetic origin can also be ruled out, since phonon-activated magnetic excitations are expected to peak below 0.2 eV for a =1 chain with 21 meV [143] (including a phonon contribution of 80 meV). We did not succeed in separating a possible phonon-activated magnetic contribution from the multi-phonon continuum in this frequency range. The transparency of the crystals indicates that the electronic excitations have a large gap. The features between 0.34 and 2.5 eV can thus be attributed to orbital excitations. The rather complex structure of the spectra reflect the large number of multiplets of the Ni2+ ions in this compound.
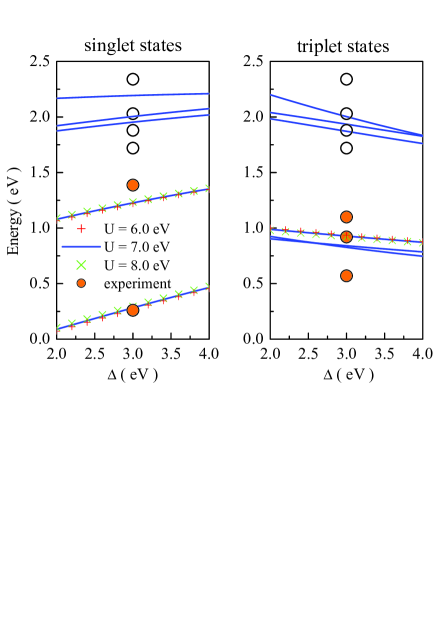
In order to confirm this interpretation we calculated the crystal-field levels using a cluster calculation. Here we used =7.0 eV, =5.0 eV, and =3 eV [84, 85]. The effect of varying between 6 and 8 eV and between 2 and 4 eV is shown for a few selected levels in figure 14. The energy levels hardly depend on the precise value of , whereas the influence of is more significant. All spin singlet energies rise with increasing whereas the spin triplet energies decrease. For =7.0 eV and =3 eV, the cluster calculation predicts spin singlet states at 0.28, 1.23, 1.95, 2.00, and 2.19 eV, and spin triplet states at 0.83, 0.84, 0.93, 1.87, 1.94, and 2.00 eV, respectively. Here, we have neglected the splitting of the triplets ( 50 meV) by spin-orbit coupling for simplicity. Since the ground state has triplet character, the transitions to the singlet states are forbidden by the spin selection rule =0. Comparing with the experimental data, one can identify the lowest two singlet states with the very weak absorption band at 0.34 eV (, see figure 13) and with the sharp features at about 1.5 eV. Note that the phonon energy of 50-80 meV still has to be added to the calculated values. The finite absorption strength of the feature at 0.34 eV is attributed to spin-orbit coupling, the sharp peaks at 1.5 eV are addressed below. The three peaks at about 0.65, 1.0 and 1.2 eV are assigned to the lowest three triplet states. The overall agreement between the calculated energy levels and the observed peak frequencies is reasonable.
In the following, we want to focus on the two lowest spin singlet states. The first excited singlet state at 0.34 eV may serve as an example for a low-energy orbital excitation in a distorted crystal structure. Its low energy arises from competing interactions. On the one hand, the Coulomb interactions prefer a parallel alignment of the spins of the two holes in the shell (Hund’s rule), which forces the two holes to occupy different orbitals in the ground state (predominantly the and the orbitals, which both point towards the negatively charged O ligands in this compound). On the other hand, the crystal field and the Ni-O hybridization give rise to a large splitting of these two orbitals due to the strong compression of the octahedra, favoring the orbital (in the present case, the dominant contribution arises from the hybridization). Therefore, the singlet state with both holes predominantly occupying the orbital is not much higher in energy than the spin triplet ground state. Increasing the Ni-O hybridization by applying external pressure may lead to a further reduction of the singlet energy.
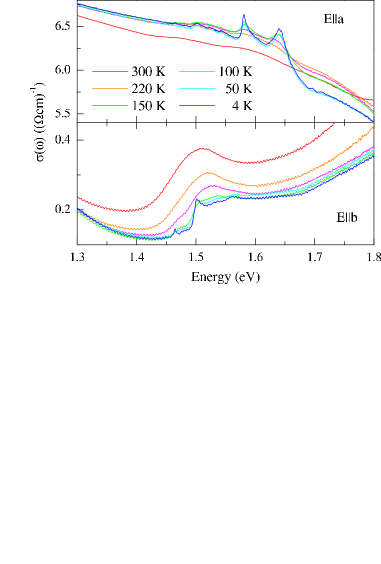
The transition to the second singlet state at about 1.5 eV can roughly be understood as a pure spin-flip transition, i.e., this state shows nearly the same orbital occupancy as the triplet ground state. This explains the very narrow line width compared to all other absorption bands, since the lattice hardly reacts to the spin flip (see the discussion of the Franck-Condon principle in figure 3). The fine structure is attributed to magnetic dipole transitions and to magnon-assisted electric dipole transitions [58, 67, 68]. A more detailed polarization analysis with additional measurements on a different sample surface is required in order to determine whether the absorption features depend on the direction of the magnetic field component or on the electric field component. The temperature dependence of the sharp features at about 1.5 eV is shown in figure 15. The fine structure is rapidly washed out with increasing temperature, which is attributed to the loss of coherence of the magnetic excitations.
9 CaCu2O3 and K4Cu4OCl10
These two cuprate compounds show interesting magnetic properties. For the purpose of the present paper, they serve as examples for crystal-field excitations at high energies. In the undoped parent compounds of the high- superconducting cuprates, predictions for the lowest crystal-field excitation () varied between 0.6 eV [144] and 1.9 eV [145] in semi-empirical and ab initio cluster calculations [144, 145, 146, 147]. Experimental evidence supporting low-lying - excitations was reported on the basis of optical conductivity data [148, 76] with a possible relevance for the mechanism of high- superconductivity. However, the corresponding features at about 0.3-0.5 eV in have been interpreted successfully in terms of phonon-assisted magnetic absorption by Lorenzana and Sawatzky [72, 73]. By means of inelastic x-ray scattering [149] and optical third-harmonic generation [65], evidence for a splitting between the - ground state and the orbital of 1.6-2 eV has been derived.
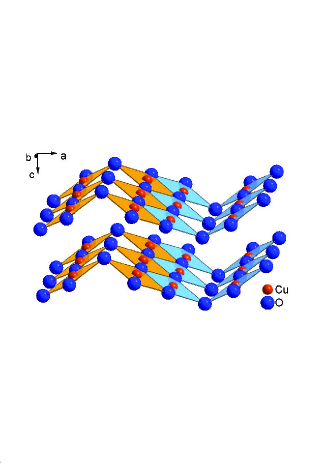
The crystal structure of CaCu2O3 shows buckled Cu2O3 layers which are stacked along the direction [150] (see figure 16). Magnetically, the system is strongly anisotropic, with a dominant antiferromagnetic coupling between the Cu spins parallel to the axis, and weak couplings in the perpendicular directions () [63, 151]. The weak 3D coupling gives rise to long-range order below 25 K. The inter-layer distance amounts to 3.7 Å, and the local environment of the Cu2+ ions is close to a square of four O ions. The local symmetry on the Cu site deviates only slightly from symmetry. In symmetry, the hole occupies the - orbital, and the orbital constitutes the first excited state, whereas the orbital shows the highest energy of the orbitals. In a cluster calculation we find the first excited state at 1.3 eV.
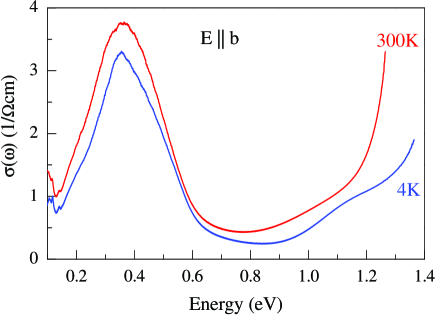
We have determined the optical conductivity from reflectance and transmittance data (see figure 17). Lorenzana-Sawatzky type phonon-assisted magnetic excitations were observed at about 0.4 eV [63]. The onset of excitations across the charge-transfer gap is observed at about 1.2-1.3 eV. The feature at 1.1 eV is attributed to a crystal-field excitation. At 300 K, both the onset of charge-transfer excitations and the crystal-field exciton peak are smeared out significantly.
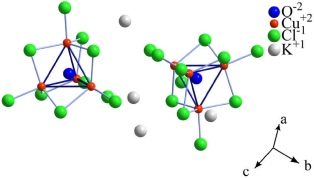
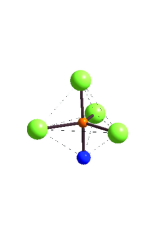
The compound K4Cu4OCl10 has been found in volcanic sedimentations. The crystal structure is shown in figure 18 [92]. It shows Cu4 tetrahedra with a single O ion in the center of each tetrahedron (see figure 18). Each Cu2+ ion carries a spin of =1/2 and is surrounded by a [Cl4O] cage (see figure 20). The tetrahedra are well separated by K and Cl ions. This compound thus represents in good approximation a zero-dimensional model system for the study of local crystal-field excitations.
As far as the magnetism is concerned, one expects two degenerate spin singlet states for a regular, undistorted =1/2 tetrahedron. The degeneracy can be lifted by magnetic quantum fluctuations between coupled tetrahedra. The dynamics of such geometrically frustrated quantum spin systems with low-lying singlet excitations has attracted considerable interest [152, 153, 154, 155]. However, the degeneracy can also be lifted by distortions of the tetrahedra, similar to the competition between orbital quantum fluctuations and lattice distortions described above.
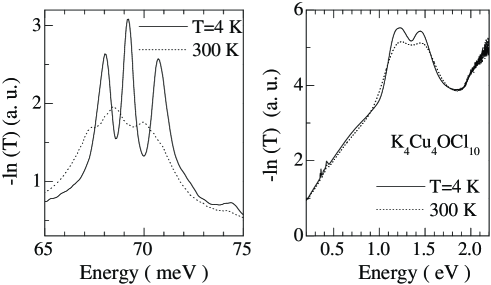
We have measured the transmittance of a poly-crystalline sample that was pressed in a KBr pellet because K4Cu4OCl10 is sensitive to moisture. Plotting yields an estimate of the absorption, as stated above [93]. The Cu-O bond-stretching mode is split into three distinct absorption peaks (see left panel of figure 20), indicating a distortion of the tetrahedra and a suppression of the magnetic quantum fluctuations.
Crystal-field excitations have been observed at 1.22 and 1.47 eV (see figure 20). The background is attributed to scattering on grain boundaries which increases with increasing energy. For an estimate of the crystal-field splitting we consider a CuOCl4 cluster as shown in figure 20. Using the same parameters as for TiOCl (in particular , see above), we obtain four excited states at 1.3, 1.5, 1.8 and 1.9 eV above the ground state. A further increase of hardly affects the two lower energies, but pushes the two higher levels beyond 2 eV, in reasonable agreement with the experimental result.
10 Conclusion
Orbital excitations have been observed in the optical conductivity of a series of transition-metal compounds. The orbital excitations gain a finite spectral weight in due to either the absence of inversion symmetry on the transition-metal site, a phonon-activated mechanism, or magnon-exciton sidebands. In general, reasonable agreement has been obtained between the observed peak energies and the predictions of a cluster calculation. In the case of TiOCl, also the experimentally observed polarization dependence can be understood very well within the point-charge model. Here, the lack of inversion symmetry on the Ti site allows to make strict predictions for the polarization dependence in the room-temperature structure, i.e., each transition is expected only in one particular polarization. A pronounced polarization dependence has also been observed in case of the phonon-activated absorption bands of Y2BaNiO5. However, most of these bands are observed both for and , i.e., only the intensity is changing as a function of the polarization.
At the present stage, our optical conductivity data do not yield clear evidence for a collective nature of the orbital excitations in any of the compounds studied here. The energetically lowest orbital excitations were observed in Y2BaNiO5 (0.34 eV) and in RTiO3 (0.3 eV). In Y2BaNiO5, the low energy can be explained by the competition between Hund’s rule coupling (favoring a spin triplet state, in which the two holes on a Ni2+ ion occupy different orbitals) and Ni-O hybridization (favoring a spin singlet state with both holes in the orbital due to the strong compression of the octahedra). In the case of RTiO3, detailed theoretical predictions for concerning, e.g., the peak energy and the line shape for absorption of collective orbital fluctuations are called for. In particular, a quantitative estimate of the possible importance of orbital fluctuations can only be derived from our data if the orbital exchange interactions and the coupling to the lattice are treated on an equal footing. However, the resonance behavior and the polarization dependence of the Raman data [112] give evidence for a collective nature of the orbital excitations in RTiO3. In TiOCl, on the other hand, the splitting was found to be about 0.65 eV. A scenario of strong orbital fluctuations with a significant admixture of the orbital to the ground state is in contradiction with the observed polarization dependence. We thus consider a dominant role of orbital fluctuations in this compound as very unlikely.
References
References
- [1] Imada M, Fujimori A, and Tokura Y 1998 Rev. Mod. Phys. 70 1039
- [2] Tokura Y and Nagaosa N 2000 Science 288 462
- [3] Auerbach A 1994 Interacting Electrons and Quantum Magnetism, Springer, New York
- [4] Gogolin A O, Nersesyan A A and Tsvelik A M 1998 Bosonization and Strongly Correlated Systems, Cambridge University Press, Cambridge
- [5] Hohenberg P C 1967 Phys. Rev. 158 383
- [6] Mermin N D and Wagner H 1966 Phys. Rev. Lett. 22 1133
- [7] Barnes T, Dagotto E, Riera J and Swanson E S 1993 Phys. Rev. B 47 3196
- [8] Haldane F D M 1983 Phys. Rev. Lett. 50 1153
- [9] Faddeev L D and Takhtajan L A 1981 Phys. Lett. 85A 375
- [10] Andrei N and Lowenstein J H 1979 Phys. Rev. Lett. 43 1698
- [11] Karbach M, Müller G, Bougourzi A H, Fledderjohann A and Mütter K-H 1997 Phys. Rev. B 55 12510
- [12] Arai M, Fujita M, Motokawa M, Akimitsu J and Bennington S M 1996 Phys. Rev. Lett. 77 3649
- [13] Schmidt K P and Uhrig G S 2003 Phys. Rev. Lett. 90 227204
- [14] Sushkov O P and Kotov V N 1998 Phys. Rev. Lett. 81 1941
- [15] Windt M, Grüninger M, Nunner T, Knetter C, Schmidt K P, Uhrig G S, Kopp T, Freimuth A, Ammerahl U, Büchner B, and Revcolevschi A 2001 Phys. Rev. Lett. 87 127002
- [16] Dagotto E, Riera J and Scalapino D 1992 Phys. Rev. B 45 5744
- [17] Dagotto E 1999 Rep. Prog. Phys. 62 1525
- [18] Uehara M, Nagata T, Akimitsu J, Takahashi H, Môri N and Kinoshita K 1996 J. Phys. Soc. Jpn. 65 2764
- [19] Ishihara S, Yamanaka M and Nagaosa N 1997 Phys. Rev. B 56 686
- [20] Feiner L F, Oles A M and Zaanen J 1997 Phys. Rev. Lett. 78 2799
- [21] Khaliullin G and Maekawa S 2000 Phys. Rev. Lett. 85 3950
- [22] Khaliullin G 2001 Phys. Rev. B 64 212405
- [23] Khaliullin G, Horsch P and Oleś A M 2001 Phys. Rev. Lett. 86 3879
- [24] Sirker J and Khaliullin G 2003 Phys. Rev. B 67 100408(R)
- [25] Horsch P, Khaliullin G and Oleś A M 2003 Phys. Rev. Lett. 91 257203
- [26] Saitoh E, Okamoto S, Takahashi K T, Tobe K, Yamamoto K, Kimura T, Ishihara S, Maekawa S and Tokura Y 2001 Nature 410 180
- [27] Ishihara S, Inoue J and Maekawa S 1997 Phys. Rev. B 55 8280
- [28] Khaliullin G and Okamoto S 2002 Phys. Rev. Lett. 89 167201
- [29] Khaliullin G and Okamoto S 2003 Phys. Rev. B 68 205109
- [30] Ishihara S 2004 Phys. Rev. B 69 075118
- [31] Keimer B, Casa D, Ivanov A, Lynn J W, von Zimmermann M, Hill J P, Gibbs D, Taguchi Y and Tokura Y 2000 Phys. Rev. Lett. 85 3946
- [32] Seidel A, Marianetti C A, Chou F C, Ceder G and Lee P A 2003 Phys. Rev. B 67 020405(R)
- [33] Seidel A and Lee P A 2004 Phys. Rev. B 69 094419
- [34] Ulrich C, Khaliullin G, Sirker J, Reehuis M, Ohl M, Miyasaka S, Tokura Y and Keimer B 2003 Phys. Rev. Lett. 91 257202
- [35] Cwik M, Lorenz T, Baier J, Müller R, André G, Bourée F, Lichtenberg F, Freimuth A, Schmitz R, Müller-Hartmann E and Braden M 2003 Phys. Rev. B 68 060401(R)
- [36] Craco L, Laad M S, Leoni S and Müller-Hartmann E 2004 Phys. Rev. B 70 195116
- [37] Haverkort M W, Hu Z, Tanaka A, Ghiringhelli G, Roth H, Cwik M, Lorenz T, Schüßler-Langeheine C, Streltsov S V, Mylnikova A S, Anisimov V I, de Nadai C, Brookes N B, Hsieh H H, Lin H-J, Chen C T, Mizokawa T, Taguchi Y, Tokura Y, Khomskii D I and Tjeng L H 2005 Phys. Rev. Lett. 94 056401
- [38] Mochizuki M and Imada M 2001 J. Phys. Soc. Jpn. 70 2872
- [39] Mochizuki M and Imada M 2003 Phys. Rev. Lett. 91 167203
- [40] Mochizuki M and Imada M 2004 J. Phys. Soc. Jpn. 73 1833
- [41] Mochizuki M and Imada M 2004 New J. Phys. 6 154
- [42] Fritsch V, Hemberger J, Eremin M V, Krug von Nidda H-A, Lichtenberg F, Wehn R and Loidl A 2002 Phys. Rev. B 65 212405
- [43] Hemberger J, Krug von Nidda H-A, Fritsch V, Deisenhofer J, Lobina S, Rudolf T, Lunkenheimer P, Lichtenberg F, Loidl A, Bruns D and Büchner B 2003 Phys. Rev. Lett. 91 066403
- [44] Kiyama T and Itoh M 2003 Phys. Rev. Lett. 91 167202
- [45] Harris A B, Yildirim T, Aharony A, Entin-Wohlmann O and Korenblit I Ya 2003 Phys. Rev. Lett. 91 087206
- [46] Harris A B, Yildirim T, Aharony A, Entin-Wohlmann O and Korenblit I Ya 2004 Phys. Rev. B 69 035107
- [47] Kikoin K, Entin-Wohlmann O, Fleurov V and Aharony A 2003 Phys. Rev. B 67 214418
- [48] Pavarini E, Biermann S, Poteryaev A, Liechtenstein A I, Georges A and Andersen O K 2004 Phys. Rev. Lett. 92 176403
- [49] Solovyev I V 2004 Phys. Rev. B 69 134403
- [50] Fang Z and Nagaosa N 2004 Phys. Rev. Lett. 93 176404
- [51] Grüninger M, Rückamp R, Windt M and Freimuth A 2002 Nature 418 39
- [52] Krüger R, Schulz B, Naler S, Rauer R, Budelmann D, Bäckström J, Kim K H, Cheong S-W, Perebeinos V and Rübhausen M 2004 Phys. Rev. Lett. 92 097203
- [53] Martín-Carrón L and de Andrés A 2004 Phys. Rev. Lett. 92 175501
- [54] Ballhausen C F 1962 Introduction to Ligand Field Theory McGraw-Hill, New York
- [55] Kikoin K A and Fleurov V N 1994 Transition Metal Impurities in Semiconductors. Electronic Structure and Physical Properties World Scientific, Singapore
- [56] Nelson E D, Wong J Y and Schawlow A L 1967 Phys. Rev. 156 298
- [57] Schawlow A L, Wood D L and Clogston A M 1959 Phys. Rev. Lett. 3 271
- [58] Sell D D, Greene R L and White R M 1967 Phys. Rev. 158 489
- [59] Hasan M Z, Isaacs E D, Shen Z-X, Miller L L, Tsutsui K, Tohyama T and Maekawa S 2000 Science 288 1811
- [60] Khaliullin G and Kilian R 2000 Phys. Rev. B 61 3494
- [61] van den Brink J, Stekelenburg W, Khomskii D I, Sawatzky G A, and Kugel K I 1998 Phys. Rev. B 58 10276-10282
- [62] Figgis B N and Hitchman M A 1999 Ligand Field Theory and its Applications Wiley
- [63] Grüninger M, Windt M, Benckiser E, Nunner T S, Schmidt K P, Uhrig G S and Kopp T 2003 Adv. Solid State Phys. 43 95
- [64] Falck J P, Perkins J D, Levy A, Kastner M A, Graybeal J M and Birgeneau R J 1994 Phys. Rev. B 49 6246
- [65] Schumacher A B, Dodge J S, Carnahan M A, Kaindl R A, Chemla D S and Miller LL 2001 Phys. Rev. Lett. 87 127006
- [66] Fromme B, Möller M, Anschütz T, Bethke C Kisker E 1996 Phys. Rev. Lett. 77 1548
- [67] Ferguson J, Guggenheim H J and Tanabe Y 1966 J. Phys. Soc. Jpn. 21 692
- [68] Cador O, Mathonière C and Kahn O 2000 Inorg. Chem. 39 3799-3804
- [69] Guillaume M, Henggeler W, Furrer A, Eccleston R S and Trounov V 1995 Phys. Rev. Lett. 74 3423
- [70] Tanaka Y, Baron A Q R, Kim Y-J, Thomas K J, Hill J P, Honda Z, Iga F, Tsutsui S, Ishikawa D and Nelson C S 2004 New J. Phys. 6 161
- [71] Khaliullin G private communication
- [72] Lorenzana J and Sawatzky G A 1995 Phys. Rev. Lett. 74 1867
- [73] Lorenzana J and Sawatzky G A 1995 Phys. Rev. B 52 9576
- [74] Suzuura H, Yasuhara H, Furusaki A, Nagaosa N and Tokura Y 1996 Phys. Rev. Lett. 76 2579
- [75] Lorenzana J and Eder R 1997 Phys. Rev. B 55 R3358
- [76] Perkins J D, Graybeal J M, Kastner M A, Birgeneau R J, Falck J P and Greven M 1993 Phys. Rev. Lett. 71 1621
- [77] Perkins J D, Birgeneau R J, Graybeal J M, Kastner M A and Kleinberg D S 1998 Phys. Rev. B 58 9390
- [78] Perkins J D, Kleinberg D S, Kastner M A, Birgeneau R J, Endoh Y, Yamada K and Hosoya S 1995 Phys. Rev. B 52 R9863
- [79] van den Brink J 2001 Phys. Rev. Lett. 87 217202
- [80] Cowan R D 1981 The theory of atomic structure and spectra University of California press, Berkely
- [81] Sugano S, Tanabe Y and Kamimura H 1970 Multiplets of Transition-Metal Ions in Crystals Academic Press, New York and London
- [82] Harrison W A 1980 Electronic Structure and the Properties of Solids W.H.Freeman and Company, San Francisco
- [83] Slater J C and Koster G F 1954 Phys. Rev. 94 1498
- [84] Saitoh T, Bocquet A E, Mizokawa T and Fujimori A 1995 Phys. Rev. B 52 5419
- [85] Tanaka A and Jo T 1994 J. Phys. Soc. Jpn. 63 2788
- [86] Kataev V, Baier J, Möller A, Jongen L, Meyer G and Freimuth A 2003 Phys. Rev. B 68 140405
- [87] Lichtenberg F, Widmer D, Bednorz J G, Williams T and Reller A 1991 Z. Phys. B 82 211
- [88] Geck J, Wochner P, Kiele S, Klingeler R, Revcolevschi A, von Zimmermann M, and Büchner B 2004 New J. Phys. 6 152
- [89] Massarotti V, Capsoni D, Bini M, Altomare A and Moliterni A G G 1999 Zeitschrift für Kristallographie 214 205
- [90] Sulewski P E and Cheong S-W 1994 Phys. Rev. B 50 551
- [91] Sekar C, Ruck K, Krabbes G, Teresiak A and Watanabe T 2002 Physica C 378 678
- [92] de Boer J J, Bright D and Helle J N 1972 Acta Crystallographica B 28 3436
- [93] Grüninger M, Windt M, Nunner T, Knetter C, Schmidt K P, Uhrig G S, Kopp T, Freimuth A, Ammerahl U, Büchner B and Revcolevschi A 2002 J. Phys. Chem. Solids 63 2167-2173
- [94] Beynon R J and Wilson J A 1993 J. Phys.: Condens. Matter 5 1983
- [95] Imai T and Chou F C 2003 Preprint cond-mat/0301425
- [96] Lemmens P, Choi K-Y, Caimi G, Degiorgi L, Kovaleva N N, Seidel A and Chou F C 2004 Phys. Rev. B 70 134429
- [97] Caimi G, Degiorgi L, Kovaleva N N, Lemmens P and Chou F C 2004 Phys. Rev. B 69 125108
- [98] Caimi G, Degiorgi L, Lemmens P and Chou F C 2004 J. Phys. Cond. Mat. 16 5583
- [99] Saha-Dasgupta T, Valenti R, Rosner H and Gros C 2004 Europhys. Lett. 67 63
- [100] Hemberger J, Hoinkis M, Klemm M, Sing M, Claessen R, Horn S and Loidl A 2005 Preprint cond-mat/0501517
- [101] Shaz M, van Smaalen S, Palatinus L, Hoinkis M, Klemm M, Horn S and Claessen R 2005 Phys. Rev. B 71 100405(R)
- [102] Abel E, Matan K, Chou F C and Lee Y S 2004 Bull. Amer. Phys. Soc. 49 317 (APS March Meeting Montreal 2004, Session D25.014)
- [103] Snigireva E M, Troyanov S I and Rybakov V B 1990 Zhurnal Neorganicheskoi Khimii 35 1945 (ICSD code 39314)
- [104] Maule C H, Tothill J N, Strange P and Wilson J A 1988 J. Phys. C: Solid State Phys. 21 2153-2179
- [105] Lemmens P, Choi K-Y, Valenti R, Saha-Dasgupta T, Abel E, Lee Y S and Chou F C 2005 Preprint cond-mat/0501577
- [106] Sasaki T, Mizumaki M, Kato K, Watabe Y, Nishihata Y, Takata M and Akimitsu J 2005 Preprint cond-mat/0501691
- [107] Rückamp R, Baier J, Kriener M, Haverkort M W, Lorenz T, Uhrig G S, Jongen L, Möller A, Meyer G and Grüninger M 2005 Preprint cond-mat/0503409.
- [108] Craco L, Laad M and Müller-Hartmann E 2004 Preprint cond-mat/0410472
- [109] Saha-Dasgupta T, Lichtenstein A and Valenti R 2005 Phys. Rev. B 71 153108
- [110] Pisani L and Valenti R 2005 Phys. Rev. B 71 180409
- [111] Barba D, Jandl S, Nekvasil V, Marys̆ko M, Divis̆ M, Martin A A, Lin C T, Cardona M and Wolf T 2001 Phys. Rev. B 63 054528
- [112] Ulrich C, Gössling A, Grüninger M, Guennou M, Roth H, Cwik M, Lorenz T, Khaliullin G and Keimer B 2005 Preprint cond-mat/0503106
- [113] MacLean D A, Ng H-N and Greedan J E 1979 J. Sol. State Chem. 30 35
- [114] Ulrich C, Khaliullin G, Okamoto S, Reehuis M, Ivanov A, He H, Taguchi Y, Tokura Y and Keimer B 2002 Phys. Rev. Lett. 89 167202
- [115] Zubkov V G, Berger I F, Artamonova A M and Bazuyev G V 1984 Kristallografiya 29 494-497
- [116] Schmitz R, Entin-Wohlman O, Aharony A, Harris A B and Müller-Hartmann E 2004 Preprint cond-mat/0411583
- [117] Schmitz R, Entin-Wohlman O, Aharony A, Harris A B and Müller-Hartmann E 2005 Phys. Rev. B 71 144412
- [118] Held K, Ulmke M, Blümer N and Vollhardt D 1997 Phys. Rev. B 56 14469
- [119] van den Brink J, Khaliullin G and Khomskii D I 2002 Preprint cond-mat/0206053
- [120] Murakami Y, Hill J P, Gibbs D, Blume M, Koyama I, Tanaka M, Kawata H, Arima T, Tokura Y, Hirota K and Endoh Y 1998 Phys. Rev. Lett. 81 582
- [121] Rodriguez-Carvajal J, Hennion M, Moussa F, Moudden A H, Pinsard L, and Revcolevschi A 1998 Phys. Rev. B 57 R3189
- [122] Chatterji T, Fauth F, Ouladdiaf B, Mandal P and Ghosh B 2003 Phys. Rev. B 68 052406
- [123] van den Brink J 2004 New J. Phys. 6 201
- [124] Reichardt W and Braden M 1999 Physica b 263-264 416
- [125] Choi K Y, Lemmens P, Güntherodt G, Pashkevich Y G, Gnezdilov V P, Reutler P, Pinsard-Gaudart L, Büchner B, and Revcolevschi A 2005 Preprint cond-mat/0503460.
- [126] Saitoh E, Okamoto S, Tobe K, Yamamoto K, Kimura T, Ishihara S, Maekawa S, and Tokura Y 2002 Nature 418 40
- [127] Paolone A, Roy P, Pimenov A, Loidl A, Mel’nikov O K, and Shapiro A Y 2000 Phys. Rev. B 61 11255
- [128] Perebeinos V and Allen P B 2001 Phys. Rev. B 64 085118
- [129] Reichardt W and Braden M private communictaion
- [130] Grüninger M, van der Marel D, Damascelli A, Zibold A, Geserich H P, Erb A, Kläser M, Wolf T, Nunner T, and Kopp T 1999 Physica C 317-318 286-291
- [131] Chaplot S L, Reichardt W, Pintschovius L, and Pyka N 1995 Phys. Rev. B 52 7230
- [132] Tobe K, Kimura T, Okimoto Y and Tokura Y 2001 Phys. Rev. B 64 184421
- [133] Kovaleva N N, Boris A V, Bernhard C, Kulakov A, Pimenov A, Balbashov A M, Khaliullin G and Keimer B 2004 Phys. Rev. Lett. 93 147204
- [134] Allen P B and Perebeinos V 1999 Phys. Rev. Lett. 83 4828
- [135] Millis A J 1996 Phys. Rev. B 53 8434
- [136] Pickett W E and Singh D J 1996 Phys. Rev. B 53 1146
- [137] Solovyev I, Hamada N and Terakura K 1996 Phys. Rev. B 53 7158
- [138] Elfimov I S, Anisimov V I and Sawatzky G A 1999 Phys. Rev. Lett. 82 4264
- [139] Ahn K H and Millis A J 2000 Phys. Rev. B 61 13545
- [140] Bala J and Oles A M 2000 Phys. Rev. B 62 R6085
- [141] Darriet J and Regnault L P 1993 Solid State Comm. 86 409
- [142] Xu G, Aeppli G,Bisher M E, Broholm C, DiTusa J F, Frost C D, Ito T, Oka K , Paul R L, Takagi H and Treacy M M J 2000 Science 289 419
- [143] Nunner T and Kopp T private communication
- [144] Grant J B and McMahan A K 1992 Phys. Rev. B 46 8440
- [145] Martin R L and Hay P J 1993 J. Chem. Phys. 98 8680
- [146] Eskes H, Tjeng L H and Sawatzky G A 1990 Phys. Rev. B 41 288
- [147] de Graaf C 1998 Ph.D. Thesis University of Groningen, The Netherlands.
- [148] Geserich H P, Scheiber G, Geerk J, Li H C, Linker G, Assmus W and Weber W 1988 Europhys. Lett. 6 277
- [149] Kuiper P, Guo J-H, Såthe C, Duda L-C, Nordgren J, Pothuizen J J M, de Groot F M F and Sawatzky G A 1998 Phys. Rev. Lett. 80 5204
- [150] Teske C L and Müller-Buschbaum H K 1969 Zeitschrift für Anorganische und Allgemeine Chemie 370 134
- [151] Kim T K, Rosner H, Drechsler S-L, Hu Z, Sekar C, Krabbes G, Málek J, Knupfer M, Fink J and Eschrig H 2003 Phys. Rev. B 67 024516
- [152] Yamashita Y and Ueda K 2000 Phys. Rev. Lett. 85 4960
- [153] Kotov V N, Zhitomirsky M E and Sushkov O P 2001 Phys. Rev. B 63 064412
- [154] Lemmens P, Choi K-Y, Kaul E E, Geibel C, Becker K, Brenig W, Valenti R, Gros C, Johnsson M, Millet P and Mila F 2001 Phys. Rev. Lett. 87 227201
- [155] Brenig W 2003 Phys. Rev. B 67 064402