Dynamic phase separation in La5/8-yPryCa3/8MnO3
Abstract
Detailed magnetization measurements in La5/8-yPryCa3/8 MnO3, including magnetic relaxation properties, demonstrate the dynamic nature of the phase separated state in manganites. The difference between the field-cooled-cooling and zero-field-cooled magnetization curves signals the existence in the latter of blocked metastable states separated by high energy barriers. Results of the magnetic viscosity show that the system becomes unblocked in a certain temperature window, where large relaxation rates are observed. We propose a simple phenomenological model in which the system evolves through a hierarchy of energy barriers, which separates the coexisting phases. The calculated magnetization curves using this model reproduce all the qualitative features of the experimental data. The overall results allowed us to construct an phase diagram, where frozen and dynamic phase separation regions are clearly distinguished.
pacs:
75.30.Kz, 75.30.VnI 1. Introduction
The intense investigation of rare-earth perovskite manganites, triggered by the discovery of the well known colossal magnetoresistance (CMR) effect, has revealed a variety of fascinating and intriguing physical properties.Salamon Among these, the phenomenon known as phase separation (PS), the coexistence at different length scales of ferromagnetic (FM) metallic and antiferromagnetic (AFM) charge and orbital ordered insulating domains, have recently dominated the literature on manganese oxides, and is currently recognized as an intrinsic feature of several strongly correlated electron systems.Dagotto Among this class of compounds, La5/8-yPryCa3/8MnO3 is considered one of the prototype materials for the study of PS. The end members of the series, La5/8Ca3/8MnO3 and Pr5/8Ca3/8MnO3, have a robust low temperature FM metallic and charge ordered (CO) insulating states, respectively. The landmark paper by Uehara and co-workers,Uehara using magnetic, transport, and electron microscopy techniques, showed evidence of two-phase coexistence for intermediate Pr contents. Additional investigations including NMR,nmr1 ; nmr2 optical properties,optical neutron scattering,neutron and a variety of complementing studies,Dagotto have corroborated the phase separation scenario. Nevertheless, a clear understanding of some basic macroscopic signatures of PS, including its dynamic behavior, is still lacking, and the true nature of the phase separated state is yet to be unveiled.
A relevant related issue deserving a great deal of attention nowadays is the glassy nature of the phase separated state.nanoscale ; Deac2001 ; PRLglass ; PRLMathieu The coexistence of FM and CO/AFM phases in manganites implies the frustration of different interactions, allowing the existence of glassy behavior. The key parameter for the formation of the glassy state is the introduction of some kind of controlled quenched disorder, which is able to open a window in the phase line separating FM and CO/AF phasesAliaga ; cond-mat/0302550 . Several experimental papers have reported glassy behavior in manganites,Teresa ; LuisY ; Dho which was attributed to cluster interaction within the phase separated state, rather than competition between double exchange and superexchange interactions.Deac2001 ; PRLglass Glass-like dynamic effects such as aging and rejuvenation were also found in a phase separated manganite,PRLpablo while a spin glass state with short range orbital ordering but without phase separation was observed in single crystals of Eu0.5Ba0.5MnO3.PRLMathieu The spin dynamic of phase separated states is commonly superposed with the growth dynamic of one phase against the other.PRLpablo ; nonvolatile Relaxation measurements performed on polycrystalline La0.250Pr0.375Ca0.375MnO3 revealed a high field mechanism related with the growth of the FM phase fraction, a process that was considered as arising from a new sort of magnetic glassiness.Deac2002 Related effects such as cooling rate dependence on the transport and magnetic properties were also reported.UeharaEPL ; Fischer
In this paper we present a detailed study of the magnetic properties of polycrystalline La5/8-yPryCa3/8MnO3 [LPCM(y)], with emphasis on the = 0.40 sample. LPCM is one of the most studied phase separated systems, UeharaPRL ; ChemMat and its (static) phase diagram as a function of , temperature and magnetic field was previously reported.Uehara ; Yakubovskii Here we focused our attention on the dynamic properties of the phase separated state. Due to large energy barriers and strains between the FM and CO-AFM states the system reaches low temperatures in a highly blocked metastable state. In this context, time relaxation measurements are important in order to reveal the equilibrium ground state. Our results showed the existence of a temperature window where large relaxation effects occur, and the relative fraction of the coexisting phases rapidly changes as a function of time. We have also performed calculations using a dynamical model, borrowed from creep theory of vortex dynamics,BlatterRMP which reproduces the main features of the experimental results. The model assumes a collective activated dynamics with diverging-like functional form for the energy barriers. Interestingly, it predicts the existence of multiple blocked states in the phase separated regime, arising from the interplay between the temperature and the distance of the system to equilibrium; the existence of these blockade states were confirmed experimentally. Additionally, the results of magnetization as a function of temperature () and applied field () yield an phase diagram of the compound, which reveal a boundary between dynamic and frozen phase separation effects.
II 2. Experimental Details
The polycrystalline samples investigated were synthesized by the liquid-mix method starting from the metal citrates. After performing thermal treatments at 500 for 10 hours and at 1400 for 16 hours, the obtained powder was pressed into pellets and sintered for 2 hours at 1400 . Scanning electron micrographs revealed a homogeneous distribution of grain sizes, of the order of 2 m. A single crystal with Pr content 0.375 was also investigated. Magnetization measurements were performed with an extraction magnetometer (Quantum Design PPMS), as a function of temperature, applied magnetic field, and elapsed time. All temperature dependent data was measured with a cooling and warming rate of 0.8 K/min.
III 3. Experimental Results, Discussion, and Phenomenological Model
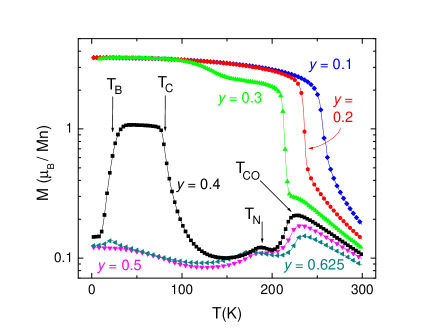
In order to visualize the evolution of the magnetic properties as a function of the Pr content in the series, Fig. 1 shows the zero field-cooled magnetization of La5/8-yPryCa3/8MnO3 samples, measured with = 1 T. For low Pr contents ( = 0.1 and 0.2), the behavior is similar to La5/8Ca3/8MnO3, with a homogeneous FM state at low temperatures. The FM transition is shifted to lower temperatures for increasing Pr concentrations. The = 0.3 sample is also a nearly homogeneous ferromagnet at low temperatures, but the magnetization decreases through two steps when the temperature is increased. Phase separation occurs in this system at intermediate temperatures.nonvolatile ; MarianoPhysicaB At the opposite end of the series, for high Pr contents ( = 0.5 and 0.625) the magnetization curves display a peak at 230 K, interpreted as arising from the CO transition,PrCa95 ; PrCa96 and a shoulder at slightly lower temperatures, 180 K, identified through neutron data as arising from AFM order.neutron85 The low magnetization values indicate the existence of a negligible amount of FM phase at low temperatures. Within the phase diagram proposed by Dagotto and coworkers,cond-mat/0302550 ; Aliaga where the phase stability is governed by both temperature and an appropriate parameter g controlling interactions, the sample with = 0.3 is representative of the low g region, with a predominantly FM behavior at low temperatures, whereas the sample with = 0.5 displays features of the high g region. It is clear from the results plotted in Fig. 1 that the = 0.4 sample belongs to an intermediate region, where disorder induce a “glass” state in the system. The transitions at and are still present, but the zero field cooling magnetization show two additional features at lower temperatures, where phase separation phenomena are more pronounced. At very low temperatures the magnetization is characterized by low values; an estimation based on vs. data at 2 K yield a FM fraction of the order of 5%. As the temperature rises this FM fraction increases considerably at 23 K, a characteristic temperature indicated in the figure, and related to the unblocking of the low temperature frozen state,abrupt as discussed in detail below. At 80 K this FM state becomes unstable, and the sample changes to the antiferromagnetic state.
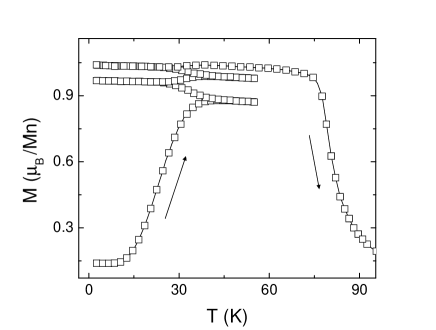
We shall now investigate in more detail the behavior of the phase separated state below 100 K in the = 0.4 compound. Figure 2 shows the temperature dependence of the magnetization (a) and resistivity (b) of the LPCM(0.4) sample, measured with = 1 T using different experimental procedures: zero-field-cooling (ZFC), field-cooled-cooling (FCC), and field-cooled warming (FCW). Following the FCC curve in the magnetization data, a clear FM transition is observed at = 45 K, which is correlated with a metal-insulator transition in the resistivity plot. Below the curve changes quickly until 25K. On further cooling no changes are observed in down to the lowest temperature reached. As previously reported,Uehara ; nmr1 ; nmr2 ; optical ; UeharaPRL ; Podzorov this compound behaves as phase separated below , with coexistence between the CO-AFM and the FM phases. The magnetization value obtained at low temperatures, 1 /Mn, indicates that the FM fraction is around 30%.
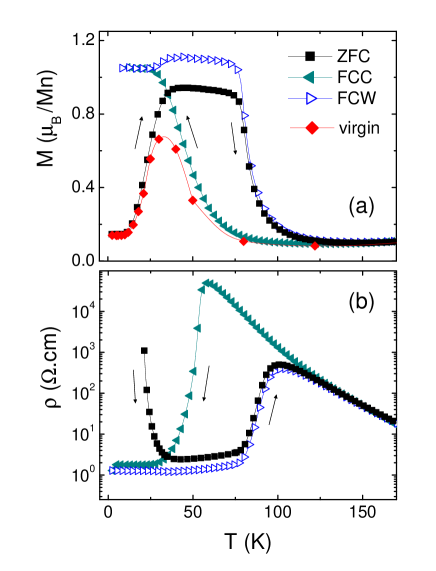
However, the zero-field-cooled state of the sample is very different from this picture. The results of Fig. 2 show that after zero-field cooling the low temperature state of the system is insulating and has a very low magnetization value, suggesting that the sample is blocked in a metastable state with a predominance of the CO-AFM phase. Increasing the temperature in the presence of an applied field unblocks the system, promoting a growth of the FM phase over the AFM/CO one. The sample becomes metallic, and the magnetization reaches and even exceeds the values obtained in the FCC process. At higher temperatures the ZFC curve merges with the FCW one. The FCW curve coincides with that of the FCC data until a temperature around 25 K at which an increase of the magnetization (reaching values above those of the low temperature state) is observed; such effect is visible in several previous investigations.UeharaPRL ; Podzorov This fact is correlated with the decrease of the FCW resistivity curve above the reversibility temperature.
As a way to further investigate the magnetic behavior of the system we performed a novel experimental procedure to probe the magnetic response of the system, which we call virgin magnetization curve. In order to wipe out the effect of the magnetic field on the phase separated state, the sample is cooled without an applied field from room temperature, well within the paramagnetic state, to a certain target temperature, then the field is turned on to take a magnetization measurement, and subsequently the sample is again warmed to room temperature before proceeding to the next data point. Starting from higher temperatures, the results plotted in Fig. 2(a) show a magnetization rise arising from the FM transition, followed by a decrease due to the freezing of the higher temperature CO-AFM phase. The peak in the virgin magnetization curve coincides with the temperature where a change of behavior from metallic to insulating occurs in the FCC resistivity.
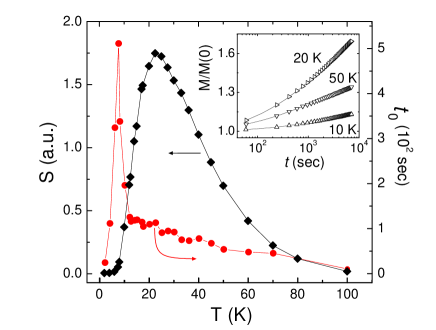
The relaxation phenomena were investigated by measuring the magnetization as a function of time, with = 1 T at various temperatures, after ZFC to the desired temperature. Selected results are show in a logarithmic scale the inset of Fig. 3. The curves were adjusted with a logarithmic function
| (1) |
from which the magnetic viscosity was extracted and plotted in the main panel of Fig. 3. At low temperatures the system is frozen in its phase separated state, in the sense that the (low) magnetization values measured do not evolve with time, i.e., . As the target temperature is increased the thermal energy becomes high enough to allow to the system to overcome the energy barriers between the coexisting phases. In this condition the FM phase fraction shows a substantial growth as a function of time, and the magnetic relaxation rate sharply increases. A peak in is observed where the majority of the system becomes unblocked. At higher temperatures the FM fraction is closer to its equilibrium value, and starts to decrease. The very large relaxation rates observed indicate that the description of the system based on a PS state is in fact a dynamic process, with the phase fraction of the coexisting states changing continuously as function of time in a certain temperature window. These relaxation measurements were also performed in a single crystal with similar Pr content, and the same results were obtained. This confirms that the dynamic effects observed are intrinsic to the material under investigation, and not related to the granularity of the polycrystalline compound.
In Fig. 3 we have also plotted the temperature dependence of the macroscopic time . This parameter can be interpreted as a measurement of the time scale at which the relaxation process occurs, taking into account that, within an activated picture of logarithmic relaxation, the height barriers which can be overcome at time are ).BlatterRMP The typical values obtained for , around 102 sec, are orders of magnitude larger than microscopic spin flip times (10-12 sec) and even larger than relaxation times of current densities in superconductors (10-6 sec) Interestingly, a sudden increase of is observed as is lowered, showing a cusp around 7 K. This diverging-like behavior resembles the conventional result of the standard theory of dynamic scaling near a phase transition,Mydosh indicating that a freezing process is happening.
To gain some additional insight into the low temperature behavior of the phase separated state we developed a simple phenomenological model, which reproduces the particular characteristics of the system. The main feature we wish to describe is the strong blocked state that develops at low temperatures, which is visible in both the ZFC and the FCC-FCW curves. The model has two basic assumptions: i) the state of the system is collective; its evolution is described as a whole in terms of a single variable, that represents the balance between the two phases, and ii) its dynamic evolution is hierarchical, in the sense that the most probable event happens before the lesser probable one. Within this framework we propose a time evolution of the system through a hierarchy of energy barriers, that applies to the macroscopic parameters (the magnetization or, equivalently, the ferromagnetic fraction ). The cooperative and hierarchical dynamics are present in the fact that the height of the barriers are dependent of the state of the system, i.e., . As is a macroscopic parameter, such functional form implies that all the barriers (at the microscopic scale) of magnitude lower than were overcome before the system reaches the state defined by the FM fraction .
With these considerations, we propose a conventional activated dynamic
functional form
| (2) |
where v0 represent a fixed relaxation rate, and the pre-factor gives the sign of the time evolution, depending whether the FM fraction is lower or higher than the equilibrium FM fraction, ,at the given temperature and applied field. The dependence of the energy barriers with is one of the main factors determining the dynamic characteristics of the system. To perform the calculations we chose a diverging energy barrier functional of the form . In this way, the slow dynamic of the system as it approaches equilibrium is guaranteed. This kind of functional form applied for energy barriers has been extensively used to describe vortex dynamics in high superconductors.BlatterRMP A simple linear form for was used, starting from = 0 at = 80 K and ending with =1 at = 2.5 K. We used = 134.4 K, while the relaxation rate was set to v= 2 sec-1. Figure 4 shows the curves obtained through the simulated FCC, FCW and ZFC processes. A portion of the used is also displayed in the figure, in order to proper visualize the system behavior in respect to the equilibrium state. The FCC calculation was done starting at temperatures above with an initial value x equal to zero. The temperature was lowered in steps of 0.5 K. At each stopping temperature a “measurement” was performed, which consists in waiting a measuring time = 60 sec while the system is relaxing following Eq. 2. At the end of this time period, the value was obtained, which in turn was the initial value for the next measurement. The FCW curve was acquired in a similar way, starting at with an initial value equal to the last obtained in the FCC process. The ZFC curve was simulated starting with a low value of = 0.02. For completeness, we have calculated the virgin magnetization curve, starting at each temperature without a FM fraction, and performing the measurement at the end of a time 5 , which is the estimated time to measure the curve until = 1 T. The resulting curve (not shown) also reproduces very well the experimental results displayed in Fig. 2.
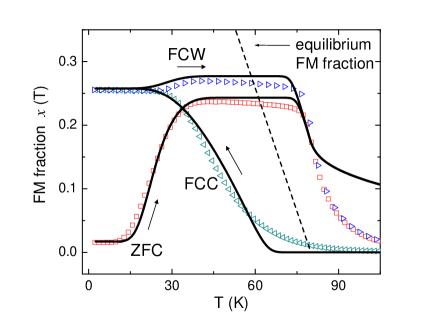
The qualitatively good agreement between the observed and calculated curves indicates that a collective mechanism is governing the dynamic evolution of the phase separated state. This very simple model reproduces several basic aspects of the physical response of the system, namely the existence of a strongly blocked state at low temperatures, visible in both the ZFC and in the FCC-FCW curves, the hysteresis observed in the whole process, the crossing between ZFC and FCC curves, and the increase of the FCC curve above the reversibility temperature. It is worth noting that the “reversible” behavior of the FCC-FCW curve at low temperature is a common feature of the manganites displaying phase separation, a singular fact not extensively discussed in the literature. In the above described framework it is clear that the reversible behavior is not the manifestation of an equilibrium state reached in the field cooling process, but the collective blockade of the system. When the temperature is high enough to unblock the system an increase of the magnetization in the FCW curve is observed. On further heating, enters in a high temperature plateau which crosses the equilibrium curve, and gets into a regime with an excess of FM phase. Finally, at sufficient high temperatures, the system enters a state characterized by the quickly lost of its FM phase, although the complete FM to non-FM phase transition on heating can not be fully reproduced, due to the fact that the model does not allow the system to reach the equilibrium state.
In addition, the dynamic model predicts the existence of multiple blockade regimes. This statement lies in the fact that the effective energy barriers distribution depends on both the temperature and the distance of the system to the equilibrium state. A crude estimation of a blocking condition can be made defining as blocked state that in which the FM fraction x changes less than the experimental resolution (around within the measuring time. For the model parameters used, these considerations lead to the condition
| (3) |
for the blocking regime of the system. It is readily implied that blocked states occur at low temperatures; within this framework the system is always blocked below 8 K, as experimentally observed. In addition, the relation is also satisfied in a temperature range where the FM fraction is close to its equilibrium value. This last condition is fulfilled at temperatures close to 60 K, where reaches and eventually overcomes the equilibrium fraction (Fig. 4). For instance, through the functional form used for equation 3 implies that with a FM fraction the system will remain blocked in the temperature window between 45 K and 70 K. This feature is observed as a plateau in the calculated curves of Fig. 4. In order to test the validity of these ideas we have performed magnetization measurements under T on successive temperature cycles between 2 and 55 K. In this way states with different values of are acceded. The obtained curve is shown in Fig. 5, where low and high temperature blocked states can be observed. These blocked states are characterized by the reversible behavior of the magnetization in the upwards and downwards runs. Both blocked regimes are separated by an unblocked region, which coincides with the temperature range with high relaxation rates (see Fig. 3). It is readily noticed that the temperature window in which the system is unblocked becomes narrows as the FM fraction increase with the number of cycles, as expected from Eq. 3.

The global results presented indicate that after zero field-cooling the sample reaches low temperatures in a highly blocked state, with a small and almost time independent fraction of FM phase, which can be thought as distributed in isolated regions or clusters surrounded by a CO matrix. This frozen-in state can be weakened, and eventually destroyed by increasing the temperature at fixed magnetic fields, or alternatively, by increasing the field at fixed temperatures. The latter leads to the well known metamagnetic transition, where the entire system changes to a homogeneous FM state. Within this context, measurements of zero filed-cooled vs. at various fields, and vs. at various temperatures enabled us to construct the phase diagram of this prototype manganite compound. The results are shown in Fig. 6, where the different regions of the phase diagram are depicted. It is assumed that this phase diagram refers to the states reached after ZFC, i.e., it corresponds to the description of the system with low initial values of the FM fraction. At high fields, above the metamagnetic transition, the system is always in a homogeneous FM state. At low temperatures, as already mentioned, the system is frozen in a metastable configuration, where small FM regions are trapped in the CO-AFM background. As the temperature is increased there is a line in the phase diagram where the system becomes unblocked. Above this line the FM regions grow and became the majority phase in the phase separated state. In this region the magnetic relaxation rate is positive, and the phase separation can be viewed as dynamic phenomena, with the relative fraction of the coexisting states continuously changing with time. At temperatures even larger one crosses another line related with the FM transition. In this region the FM phase is no longer stable, and may exist solely as isolated clusters in the majority CO-AFM matrix.
IV 4. Conclusions
In summary, we performed an investigation of the low temperature magnetic properties in La0.225Pr0.40Ca0.375MnO3, with emphasis on the dynamic behavior of the phase separated state. The slow logarithmic relaxation and the existence of field dependent blocking temperatures are signatures that the phase separated state behaves, at least from a dynamic point of view, as a magnetic glass. The disorder induced by chemical substitution at the perovskite A site could be the cause of the “spread” of the free energy densities, giving rise to a complex landscape which can be comparable to the energy landscape in configurational space of true spin glasses. Our experimental data shows that the dynamic of the system is better determined by the phase competition rather than by solely magnetic interactions as in conventional spin glasses. Such slow dynamic of the phase separated state is the main factor determining the magnetic response of the system in different dc experiments, and is at the basis of the well documented cooling rate dependence of their physical response.UeharaEPL ; Fischer The fact that the evolution of the phase separated state involves structural degrees of freedom could be the reason for the large values of the characteristic time observed. The agreement between the measured magnetization curves and the calculation performed with a model of cooperative hierarchical dynamics with diverging barriers, and the existence of multiple blockade regimes, gives a promising starting point to further investigate the properties of this dynamic phase separated state.
Acknowledgements
The authors wish to thank G. Leyva for sample preparation and P. Levy for helpful discussions. The single crystal investigated was kindly given by S-W. Cheong. This work was partially supported by CAPES. Additional funding came from CNPq, CONICET, and Fundación Antorchas.
References
- (1) M.B. Salamon and M. Jaime, Rev. Mod. Phys. 73, 583 (2001).
- (2) E. Dagotto, T. Hotta, and A. Moreo, Phys. Rep. 344, 1 (2001); E. Dagotto, The Physics of Manganites and Related Compounds (Springer-Verlag, New York, 2003), and references therein.
- (3) M. Uehara, S. Mori, C.H. Chen, and S-W. Cheong, Nature 399, 560 (1999).
- (4) A. Yakubovskii, K. Kumagai, Y. Furukawa, N. Babushkina, A. Taldenkov, A. Kaul, and O. Gorbenko, Phys. Rev. B 62, 5337 (2000).
- (5) A. Gerashenko, Y. Furukawa, K. Kumagai, S. Verkhovskii, K. Mikhalev, and A. Yakubovskii, Phys. Rev. B 67, 184410 (2003).
- (6) H. J. Lee, K. H. Kim, M. W. Kim, T. W. Noh, B. G. Kim, T. Y. Koo, S.-W. Cheong, Y. J. Wang, and X. Wei, Phys. Rev. B 65, 115118 (2002).
- (7) S. Mercone, V. Hardy, Ch. Martin, Ch. Simon, D. Saurel, and A. Brûlet, Phys. Rev. B 68, 094422 (2003).
- (8) E. Dagotto, J. Burgy and A. Moreo, Nanoscale phase separation in collosal magnetoresistance materials: lessons for the cuprates? (Springer-Verlag, New York, 2002).
- (9) I. G. Deac, J. F. Mitchell and P. Schiffer, Phys. Rev. B 63, 172408 (2001).
- (10) F. Rivadulla , M. A. López-Quintela, and J. Rivas, Phys. Rev. Lett. 93, 167206 (2004).
- (11) R. Mathieu, D. Akahoshi, A. Asamitsu, Y. Tomioka, and Y. Tokura, Phys. Rev. Lett. 93, 227202 (2004).
- (12) H. Aliaga, D. Magnoux, A. Moreo, D. Poilblanc, S. Yunoki, and E. Dagotto, Phys. Rev. B 68, 104405 (2003).
- (13) E. Dagotto, (unpublished), availavle at cond-mat/0302550 (2003).
- (14) J. M. De Teresa, M. R. Ibarra, J. García, J. Blasco, C. Ritter, P. A. Algarabel, C. Marquina, and A. del Moral, Phys. Rev. Lett. 76, 3392 (1996).
- (15) R. S. Freitas, L. Ghivelder, F. Damay, F. Dias, and L. F. Cohen, Phys. Rev. B 64, 144404 (2001).
- (16) J. Dho, W.S. Kim, N.H. Hur, Phys. Rev. Lett. 89, 027202 (2002).
- (17) P. Levy, F. Parisi, L. Granja, E. Indelicato, and G. Polla, Phys. Rev. Lett. 89, 137001, (2002).
- (18) P. Levy, F.Parisi, M.Quintero, L.Granja, J.Curiale, J.Sacanell, G.Leyva, G.Polla, R.S. Freitas, and L. Ghivelder, Phys. Rev. B 65, 140401(R) (2002).
- (19) I. G. Deac, S. V. Diaz, B. G. Kim, S.-W. Cheong, and P. Schiffer, Phys. Rev. B 65, 174426 (2002).
- (20) L. M. Fischer, A. V. Kalinov, I. F. Voloshin, N. A. Babushkina, D. I. Khomskii, Y. Zhang, and T. T. M. Palstra, cond-mat 0411670 (unpublished).
- (21) M. Uehara and S-W. Cheong, Europhys. Lett. 52, 674 (2000).
- (22) K. H. Kim, M. Uehara, C. Hess, P. A. Sharma, and S-W. Cheong, Phys. Rev. Lett. 84, 2961 (2000).
- (23) J.A. Collado, C. Frontera, J.L. García-Muñoz, C. Ritter, M. Brunelli, and M.A.G. Aranda, Chem Mat 15, 167 (2003).
- (24) A. Yakubovskii, K. Kumagai, Y. Furukawa, N. Babushkina, A. Taldenkov, A. Kaul, and O. Gorbenko, Phys. Rev. B 62, 5337 (2000).
- (25) G. Blatter, M V. Feigel’man, V. B. Geshkenbein, A. I. Larkin, and V. M. Vinokur, Rev. Mod. Phys. 66(4), 1125 (1994).
- (26) M. Quintero, A.G. Leyva, P. Levy, F. Parisi, O. Agüero, I. Torriani, M.G. das Virgens, and L. Ghivelder, Physica B: Condensed Matter, in press (2005).
- (27) H. Yoshizawa, H. Kawano, Y. Tomioka, and Y. Tokura, Phys. Rev. B 52, R13145 (1995).
- (28) Y. Tomioka, A. Asamitsu, H. Kuwahara, Y. Moritomo, and Y. Tokura, Phys. Rev. B 53, R1689 (1999).
- (29) Z. Jirák, S. Krupicka Z. Simsa, M. Dlouhá, and S. Vratislav, J. Magn. Magn. Mater. 53, 153 (1985).
- (30) L. Ghivelder, R.S. Freitas, M.G. das Virgens, M.A. Continentino, H Martinno, L. Granja, M. Quintero, G.Leyva, P. Levy, F. Parisi, Phys. Rev. B 69, 214414 (2004).
- (31) V. Podzorov, M. Uehara, M. E. Gershenson, T. Y. Koo, S-W. and Cheong, Rev. B 61, R3784 (2000).
- (32) J. A. Mydosh, Spin glasses: an experimental introduction (Taylor and Francis, London-Washington DC, 1993).