First Scanning Tunnelling Spectroscopy on Bi2Sr2Ca2Cu3O10+δ single crystals
Abstract
We report the first low temperature scanning tunnelling microscopy and spectroscopy study of high quality Bi2Sr2Ca2Cu3O10+δ crystals. We present atomic resolution and show spectroscopic data acquired on two different samples. In one case, for K and a transition width of only 1 K, we obtained an extremely homogeneous sample with meV over at least 50 nm. In the other case, the respective parameters were K and K and yielded a slightly less homogeneous sample with meV. We evidence strong similarities with Bi2Sr2CaCu2O8+δ and discuss the doping level of our samples.
keywords:
HTS , Bi2223 , spectroscopy , tunnelling , homogeneityPACS:
73.40.Gk , 74.72.Hs , 74.25.Jb , 74.72.-q, , , , , and
1 Introduction
The trilayer cuprate Bi2Sr2Ca2Cu3O10+δ (Bi2223) attracted a strong interest due to its high critical temperature K and its potential for applications. However, the difficulty in synthesizing large sized single-phase crystals significantly impeded the study of fundamental properties. Very recently the effort in developing new crystal growth processes was rewarded by a successful production of homogeneous high quality Bi2223 single crystals [1], thus opening the door to scanning tunnelling spectroscopy (STS) investigations. The determination of the intrinsic superconducting properties of this trilayer compound is of crucial importance for the determination of the generic features and behaviors of Bismuth based cuprates and more generally in the quest of the understanding of high- superconductivity.
In this paper, we present the first low temperature STS study of high quality Bi2223 single crystals. We investigate the spatial dependence of the local density of states (LDOS) of two different samples and discuss parallels with the parent double layer compound Bi2Sr2CaCu2O8+δ (Bi2212).
2 Sample characterization
We studied two Bi2223 single crystals grown by the travelling solvent floating zone method [2], which were post-annealed under different conditions. Sample was treated at 500 ∘C, 20 bar O2 during 50 hours and yielded K and an extremely sharp transition width K as measured by SQUID magnetometry. For sample the conditions were 500 ∘C, 100 bar O2 during 50 hours, giving K and a larger transition width K, indicating less homogeneity. The measurements presented here were obtained using a home built scanning tunnelling microscope which operates under ultrahigh vacuum and low temperatures [3]. The vacuum tunnel junctions were made between the in-situ cleaved Bi2223 (001) surface and an electrochemically etched iridium tip mounted perpendicular to the sample surface. All spectra where obtained at 1.8 K and zero magnetic field with tunnelling resistances ranging between 0.5 and 1 G.
3 Results and discussion
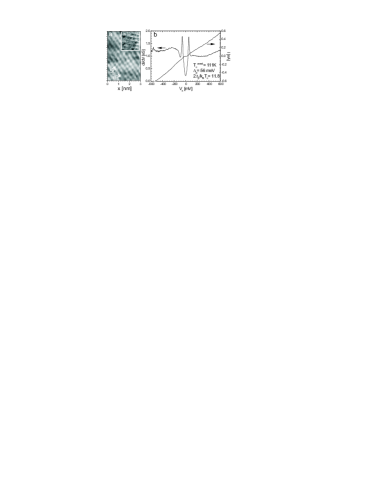
In Fig. 1a we present a topographic scan showing atomic resolution. We further observe a 26 Å supermodulation along the -axis which is also seen in Bi2201 [4] and Bi2212 [5] where it is attributed to extra oxygen in the BiO planes [6]. In Fig. 1b we show a typical -curve and its corresponding differential conductance. The IV-characteristic clearly shows a metallic-like background over a large energy range and the existence of a clear -wave gap at the Fermi level. The differential tunnelling conductance presents well-developed coherence peaks at meV and clear dip-hump structures which appear asymmetrically on both sides of the Fermi level. These features are consistent with Bi2212 [5, 7], where the broad hump observed at negative bias has been related to a van Hove singularity [8].

The power of STS lies in the ability to investigate the spatial dependence of the LDOS. Recently, much attention has been paid to the question whether the electronic structure of high- cuprates is intrinsically inhomogeneous at the nanometer scale [9] or if long range homogeneity of the spectral signature can be obtained. In fact, for overdoped Bi2212 it has been demonstrated that an appropriate crystal preparation yields homogeneous samples [10]. A necessary, however not exclusive, criterium for sample homogeneity is a sharp superconducting transition width in susceptibility measurements.


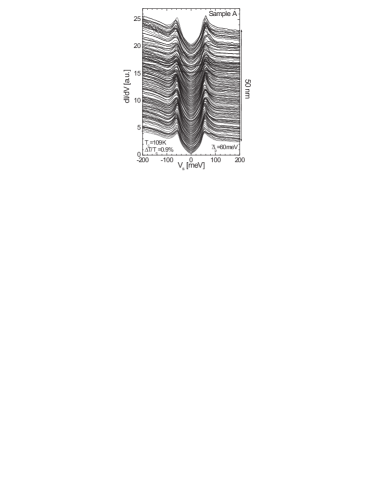
In the Figs. 2 and 3 we compare traces of equidistant spectra acquired along a line on the surfaces of sample and respectively. As anticipated by the sharp transition width , sample shows an extremely high homogeneity, as demonstrated by the gap distribution in Fig. 4: the standard deviation is of only 3 meV for a mean gap meV. In contrast, sample , with , shows a much broader distribution meV and meV. This behavior is consistent with the empirical criterium mentioned above and demonstrates that homogeneity can be obtained on Bi2223 over a range of at least 50 nm. Note the spatial reproducibility of the background conductance outside the peak-dip-hump structure for both traces, which is characteristic for a stable vacuum tunnelling junction.
The doping relation of Bi2223 has not been established yet. However, various observations point out that could deviate from the generic dome shaped relation by Presland et al. [12]. Indeed, the doping dependence has been studied by other methods suggesting a large plateau with in the overdoped phase [13, 14]. Furthermore, it has been found that Bi2223 is far less sensitive to oxygen doping than Bi2212 since upon post-annealing only small variations of are achieved, even with high oxygen pressure treatments [13]. With that respect it is striking that for a variation of only of we observe a gap variation of about between sample and .
Two observations allow us to tentatively assign sample and as being underdoped and optimally doped, respectively. Firstly, the gap magnitude is larger in sample than in . Assuming that the gap falls monotonically with increasing doping, as established for Bi2212 [11, 15] and suggested for Bi2223 by -axis conductance experiments [14], this indicates that sample has a lower hole content than . Secondly, for sample we have , which is characteristic for optimally or possibly overdoped samples [13].
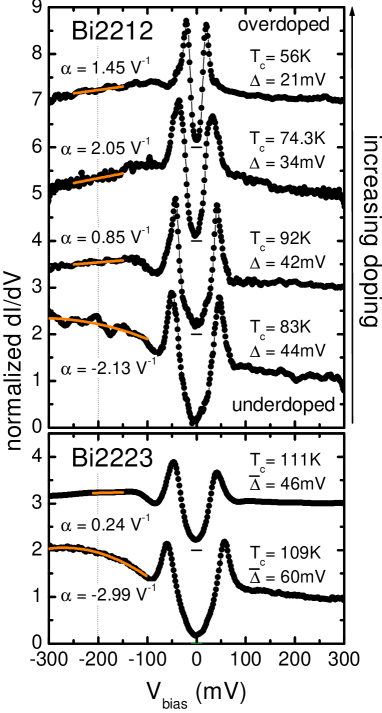
This conclusion is corroborated by a careful comparison of the background conductance in Bi2212 and Bi2223 spectra. Various tunneling experiments on Bi2212 revealed that the background conductance outside the gap is asymmetric and varies with doping [11, 7], the strongest effect occuring below the Fermi level. The background slope taken reasonably far from the Fermi level and the dip-hump structure ( meV) is positive for overdoped samples, about zero for optimal doping and negative for the underdoped case, as illustrated in the top panel of Fig. 5. In Bi2212, this observation has been attributed to a broad van Hove singularity at negative bias that shifts away from the Fermi level as decreases [8]. In the lower panel of Fig. 5 we show the average spectra of the traces on sample and . Focusing on the background slope at negative bias shows a striking similarity between underdoped Bi2212 and sample , and respectively between optimally doped Bi2212 and sample .
We now turn to the analysis of the LDOS variations observed along the trace of sample . Fig. 6 displays the average spectra corresponding to the energy intervalls of the gap distribution shown in Fig. 4. The systematic decrease of the coherence peak intensity with increasing gap magnitude and the corresponding dip-hump shift, are strikingly similar to what is observed in Bi2212 when reducing the doping [16, 17]. Furthermore, for each spectrum we again determined the slope at -200 meV which appears to depend lineraly on the gap magnitude (see Fig. 6 inset). In addition the sign change of the slope occurs at what is believed to be optimal doping. With the tentative background versus doping relation discussed above, it is therefore possible to interprete the spatially varying LDOS in less homogeneous samples as being related to a local variation of doping, as reported in Bi2212 [18].
4 Conclusion
We showed the first STS study on Bi2223 single crystals. Atomic resolution as well as the characteristic supermodulation have been observed. One sample with a transition width of only exhibits an extremely homogeneous LDOS. The LDOS features, i.e. the -wave spectral shape, the strong coherence peaks and the existence of a dip-hump structure, as well as the various LDOS on the surface of a less homogeneous sample, show striking similarity with Bi2212. Using the doping dependence of the background conductance and of the gap of Bi2212 as a template, we made a qualitative estimate of the doping level of our samples. We further evidenced a linear dependence and sign change of the slope of the background as a function of the gap magnitude.
5 Aknowledgements
This work was supported by the Swiss National Science Foundation through the National Centre of Competence in Research ”Materials with Novel Electronic Properties - MaNEP”. C.H. acknowledges support by the Deutsche Forschungsgemeinschaft through grant HE3439.
References
- [1] T. Fujii, T. Watanabe, and A. Matsuda, J. Cryst. Growth 223, 175 (2001).
- [2] E. Giannini, V. Garnier, R. Gladyshevskii, and R. Flükiger, Supercond. Sci. Technol. 17, 220 (2004).
- [3] M. Kugler et al., Rev. Sci. Instrum. 71, 1475 (2000).
- [4] M. Kugler et al., Phys. Rev. Lett. 86, 4911 (2001).
- [5] C. Renner and Ø. Fischer, Phys. Rev. B 51, 9208 (1995).
- [6] H. W. Zandbergen et al., Physica C 156, 325 (1998).
- [7] J. F. Zasadzinski et al., Phys. Rev. Lett. 87, 067005 (2001).
- [8] B. W. Hoogenboom, C. Berthod, M. Peter, and O. Fischer, Phys. Rev. B 67, 224502 (2003).
- [9] K. M. Lang et al., Nature 415, 412 (2002).
- [10] B. W. Hoogenboom, K. Kadowaki, B. Revaz, and O. Fischer, Physica C 391, 376 (2003).
- [11] C. Renner et al., Phys. Rev. Lett. 80, 149 (1998).
- [12] M. R. Presland et al., Physica C 176, 95 (1991).
- [13] T. Fujii, I. Terasaki, T. Watanabe, and A. Matsuda, Phys. Rev. B 66, 024507 (2002).
- [14] Y. Yamada et al., Phys. Rev. B 68, 054533 (2003).
- [15] N. Miyakawa et al., Phys. Rev. Lett. 80, 157 (1998).
- [16] A. Matsuda, T. Fujii, and T. Watanabe, Physica C 388-389, 207 (2003).
- [17] K. McElroy et al., cond-mat/0404005 (2004).
- [18] S. H. Pan et al., Nature 413, 282 (2001).