Four-fold structure of vortex core states in Bi2Sr2CaCu2O8+δ
Abstract
We present a detailed study of vortex core spectroscopy in slightly overdoped Bi2Sr2CaCu2O8+δ using a low temperature scanning tunneling microscope. Inside the vortex core we observe a four-fold symmetric modulation of the local density of states with an energy-independent period of (. Furthermore we demonstrate that this square modulation is related to the vortex core states which are located at meV. Since the core-state energy is proportional to the superconducting gap magnitude , our results strongly suggest the existence of a direct relation between the superconducting state and the local electronic modulations in the vortex core.
pacs:
68.37.Ef, 74.72.Hs, 74.25.-q, 74.50.+rThe high-temperature superconductors are characterized by an unconventional temperature-doping phase diagram, which is the object of numerous studies focusing in particular on the nature of the pseudogap and superconducting states. However, in spite of this effort the microscopic origin of superconductivity in these materials is still not understood. A promising approach to investigate the superconducting state is to study the electronic properties of the vortex cores. Scanning tunneling microscopy (STM) observations of vortex cores were first carried out on NbSe2 Hess-1989 . The behavior of the tunneling conductance, which measures the local density of states (LDOS), was found to agree with the prediction by Caroli et al. Caroli-1964 , that a band of localized states develops in the cores. The subsequent observation of vortices in YBa2Cu3O7-δ (YBCO) Maggio-Aprile-1995 gave a surprising result: contrary to the observations in NbSe2, the vortex-core spectra showed two peaks staying at a constant energy irrespective of the distance to the vortex center, as if the vortex would contain only two localized states instead of a whole band. Following this, several groups investigated theoretically the vortex core in a -wave superconductor, leading to the conclusion that the spectra observed in YBCO cannot be explained in the framework of the BCS theory Wang-1995 and that an extension of this theory is necessary at the very least Franz-1999_Berthod-2001b_Zhu-2001a . The STM study of Bi2Sr2CaCu2O8+δ (Bi2212) uncovered another property of the vortex-core spectra: they display the low temperature pseudogap Renner-1998b . Subsequently it was found that the two localized states are also present in this compound Pan-2000b_Hoogenboom-2000a_Matsuba-2003 , and that the states seen in YBCO and in Bi2212 have a common characteristic, appearing at an energy of about , where is the position of the coherence peaks in the superconducting state Hoogenboom-2001a .
Hoffman et al. observed a spatial modulation of the low energy tunneling conductance in the vortex cores having a period of about Hoffman-2002a . Later, it was found that similar modulations also appear in the absence of magnetic field Hoffman-2002b ; Howald-2003 . Hoffman et al. noticed that the wavelength of these modulations disperse with energy and it was proposed that the effect can be understood in terms of quasiparticle interference due to scattering on impurities and other inhomogeneities Hoffman-2002b ; Wang-2003 . However, some of the periodic modulations reported by Howald et al. Howald-2003 did not disperse in energy, and an explanation in terms of static stripes was put forward. More recently, Vershinin et al. Vershinin-2004 studied the spatial dependence of the tunneling conductance in the pseudogap phase. They observed an incommensurate square lattice with period . The modulations observed above do not disperse and it was thus concluded that they are different from the interference modulations seen in the superconducting state. A non-dispersing square pattern was also reported at low temperatures in strongly underdoped Bi2212 McElroy-2004a and Ca2-xNaxCuO2Cl2 (NCCOC) Hanaguri-2004 , which are characterized by pseudogap-like spectra. Thus there is considerable evidence that a square pattern with a non-dispersing wavelength is associated with the pseudogap, whereas in the superconducting state one observes predominantly dispersing modulations, presumably due to quasiparticle interference.
In this letter we report a detailed study of the LDOS modulation inside the vortex core. We confirm the early observations by Hoffman et al. Hoffman-2002a , but our measurements show in addition that this modulation does not disperse with energy, like the ones observed in the pseudogap phase Vershinin-2004 . We further demonstrate that this square modulation is linked to the localized vortex-core state Maggio-Aprile-1995 ; Pan-2000b_Hoogenboom-2000a_Matsuba-2003 , and we thereby establish a direct relation between the vortex core electronic modulations and the superconducting state.
Our STM measurements were performed on a Bi2212 single crystal grown by the travelling solvent flux zone method and annealed in C under bar oxygen pressure. After annealing we measured K ( K) by ac-susceptibility. The relatively flat background slope of the conductance spectra, as well as the magnitude of the superconducting gap indicate that the sample is slightly overdoped. In the region studied, we observe an average gap meV with a standard deviation meV. This gap distribution is consistent with the observed superconducting transition width Hoogenboom-2003a .
We performed the measurements with a home-built STM Kugler-2000a under ultrahigh vacuum. The sample was cleaved in situ at room temperature before cooling and applying the magnetic field and the tunnel junction was made between the (001) sample surface and an electrochemically etched Iridium tip. All data presented here was acquired at 2 K, first at zero field and then at 6 T.
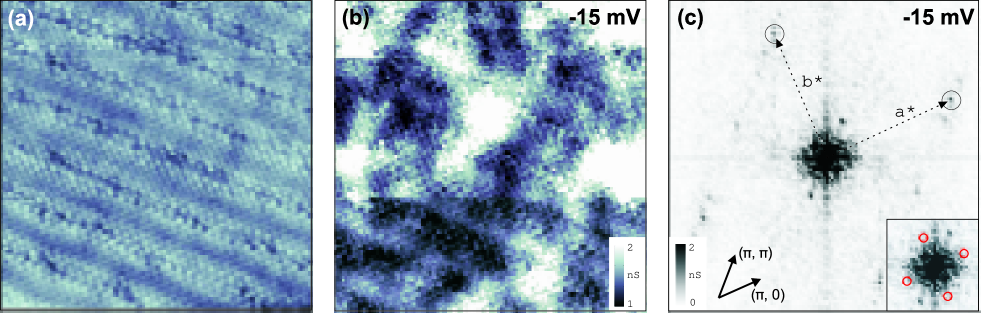
In Fig. 1a we show a topographic scan at zero field which clearly resolves the atomic lattice of the BiO top layer, as well as the characteristic supermodulation running along the (1,1) direction. Figure 1b is a conductance map at mV, which was acquired in the same area simultaneously with the topographic image. The Fourier transform (FT) shown in Fig. 1c reveals four peaks corresponding to the Bi lattice and several peaks due to the supermodulation and its harmonics running along the (,) direction. In contrast to earlier reports Hoffman-2002b ; Howald-2003 ; Vershinin-2004 we do not observe quasiparticle interference peaks in zero field, presumably because of the absence of sufficiently strong scattering centers. The red circles in the inset of Fig. 1c indicate the positions where the peaks of a modulation would have been located.
We now turn to the measurement performed at 6 T and focus on a vortex core. As shown in Fig. 3b, the vortex core spectra are characterized by a gap-like structure similar to the pseudogap measured above Renner-1998b and weak low-energy structures attributed to localized quasiparticle excitations Pan-2000b_Hoogenboom-2000a_Matsuba-2003 . In Fig. 2a we show a conductance map at mV which clearly displays the location of the vortex core. Its size and irregular shape are consistent with previous studies Renner-1998b ; Hoogenboom-2000b . In Fig. 2b we present a conductance map at mV which corresponds to the energy of the core state. Inside the core one can observe a striking square pattern formed by four bright regions, similar to the observations by Hoffman et al. Hoffman-2002a .
In order to quantitatively analyze these structures we performed the FT of conductance maps at several energies. In Fig. 2c we show the FT obtained at mV. In addition to the peaks corresponding to the atomic lattice, we observe two clear structures. First we see four peaks at corresponding to an incommensurate period of oriented parallel to the CuO bond direction. These maxima are clearly visible in all LDOS-FT taken between and mV, and between and mV. We note that their intensity at negative bias (occupied states) is smaller than at positive bias (empty states). Second we see two maxima at which only appear along the direction. Looking closer, one can observe that the quartet of peaks is slightly rotated with respect to the atomic lattice, while the two peaks are not.
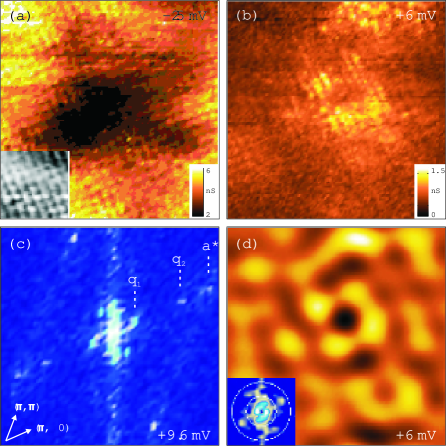
To clearly identify which signal in the real-space conductance map of Fig. 2b originates from the peaks, we show in Fig. 2d the filtered inverse FT. We selected a region in -space containing the four peaks (see inset). The inverse FT exhibits four bright regions at the corners of a square which clearly correspond to the pattern observed in the raw data. We thus demonstrate that the low energy structure in the vortex core shown in Fig. 2b is indeed at the origin of the four peaks.
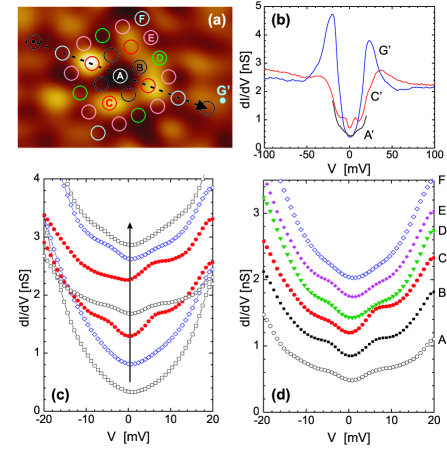
We now address the spatial variation of the LDOS inside the vortex core. In Fig. 3a we indicate 27 circular areas, each of containing 21 pixels of our spectroscopic image. For clarity we used the filtered image (Fig. 2d) to identify the positions. In Fig. 3b we display three spectra: A’ and C’ were taken at the center of area A and C, respectively and G’ was taken at point G, at a distance of nm from the center of the square pattern. Whereas G’ is similar to the zero field spectrum, A’ and C’ differ in a remarkable manner. The core states appear very distinctly in spectrum C’, which is at one maximum of the fourfold pattern, but in A’ there is hardly any signature of the core states. Thus it appears that the square pattern reflects the spatial variation of the localized states. In order to investigate this further and extract the most robust features we have averaged spectra inside each circle of Fig. 3a. Figure 3c shows the average spectra of each circle along the trace indicated by the arrow in Fig. 3a. The core states appear clearly in the two circles located on the maxima of the square pattern (red). At the center A, only a weak signature of the localized states is seen, and this signature disappears when moving outside the fourfold pattern. In Fig. 3d we show a different representation of this data. Whereas A again shows the average spectrum of the central circle, the curves B–F correspond to an average of spectra taken in circles which are equivalent by the four-fold symmetry (same color in Fig. 3a) and at increasing distance from the center. The strongest signature of core states is again seen in curve C taken on the maxima of the square pattern.
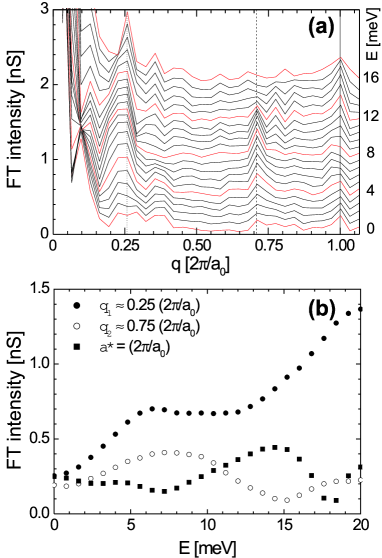
We therefore conclude that the vortex-core states are closely related to the square pattern. In Fig. 4a we plot a cut in the Fourier transform along the direction at several energies. The peak at corresponding to the -period does not disperse with energy within the error margins of our measurement. While a weak dispersion towards longer wavelengths cannot be excluded given our present resolution, this possible dispersion would be in the opposite sense than the one observed along in the superconducting state and attributed to quasiparticle interference Hoffman-2002b . We also remind that the peak at corresponding to a wavelength of is present in the direction, but not in the direction.
Figure 4b shows the intensities of the three dominant peaks as a function of energy. The intensity of the peak has a clear maximum at the energy of the localized state and increases again when approaching meV. In fact this curve mimics the local density of states measured at the four maxima of the square pattern (Fig. 3d, curve C).
Comparing our results with the observations of Vershinin et al. Vershinin-2004 in the pseudogap state above , we find that the ordering in the vortex core is very similar to the ordering in the pseudogap state. The basic structure is a non-dispersing square modulation in the Cu-O bond direction. The period in the vortex core at 2 K is slightly smaller than the period in the pseudogap state at 100 K. In the pseudogap state, the intensity of the peak in the FT was found to be largest and energy independent below meV, whereas we find an energy dependence resembling the tunnel conductance. This discrepancy may be due to temperature broadening at 100 K. Another difference is that we find a modulation in one direction. Such ordering was also seen by Hanaguri et al. Hanaguri-2004 at low temperature in Ca2-xNaxCuO2Cl2 with a main period of .
In this paper we evidence that the amplitude of the vortex core states has a four-fold structure directly reflecting the modulation observed in the vortex core. Since these states appear at an energy proportional to the gap , our results connect the superconducting state to the electronic modulation. We further find that the four-fold modulation has the same behaviour as in the pseudogap phase Vershinin-2004 , what could be expected since the vortex cores display the pseudogap Renner-1998b . The relation between the pseudogap and the superconducting state has been the topic of many theoretical studies possibly leading to spatially modulated structures Zaanen-1989_Zhang-1997b_Emery-1999_Voijta-1999_Wen-1996_Chakravarty-2001 . In particular, several authors have proposed that a pair density wave (PDW) is at the origin of the observed structures Chen-2002_Chen-2004a_Tesanovic-2004_Anderson-2004b . In the context of our study this model is attractive, since we establish a clear link between the superconducting state, the pseudogap and the square pattern in the vortex core. Within the PDW picture, this suggests that the localized states at correspond to the lowest pair breaking excitations of the PDW. The relation between the localized states and the square pattern thus sets a critical test for these theories.
This work was supported by the Swiss National Science Foundation through the National Centre of Competence in Research ”Materials with Novel Electronic Properties - MaNEP”. We acknowledge C. Berthod for very useful discussions and pertinent suggestions and A. P. Petrovic for carefully reading the manuscript.
References
- (1) H. F. Hess, R. B. Robinson, R. C. Dynes, J. M. Valles, and J. V. Waszczak, Phys. Rev. Lett. 62, 214 (1989).
- (2) C. Caroli, P. G. de Gennes, and J. Matricon, Phys. Lett. 9, 307 (1964).
- (3) I. Maggio-Aprile, Ch. Renner, A. Erb, E. Walker, and Ø. Fischer, Phys. Rev. Lett. 75, 2754 (1995).
- (4) Y. Wang and A. H. MacDonald, Phys. Rev. B 52, R3876 (1995).
- (5) M. Franz and Z. Tešanović, Phys. Rev. B 60, 3581 (1999). C. Berthod and B. Giovannini, Phys. Rev. Lett. 87, 277002 (2001). J.-X. Zhu and C. S. Ting, Phys. Rev. Lett. 87, 147002 (2001).
- (6) Ch. Renner, B. Revaz, K. Kadowaki, I. Maggio-Aprile, and Ø. Fischer, Phys. Rev. Lett. 80, 3606 (1998).
- (7) S. H. Pan et al., Phys. Rev. Lett. 85, 1536 (2000). B. W. Hoogenboom et al., Physica C 332, 440 (2000). K. Matsuba, H. Sakata, T. Mochiku, K. Hirata, and N. Nishida, Physica C 388, 281 (2003).
- (8) B. W. Hoogenboom et al., Phys. Rev. Lett. 87, 267001 (2001).
- (9) J. E. Hoffman et al., Science 295, 466 (2002).
- (10) J. E. Hoffman et al., Science 297, 1148 (2002).
- (11) C. Howald, H. Eisaki, N. Kaneko, M. Greven, and A. Kapitulnik, Phys. Rev. B 67, 014533 (2003).
- (12) Q.-H. Wang and D.-H. Lee, Phys. Rev. B 67, 020511 (2003).
- (13) M. Vershinin et al., Science 303, 1995 (2004).
- (14) K. McElroy et al., cond-mat/0404005 (2004).
- (15) T. Hanaguri et al., Nature 430, 1001 (2004).
- (16) B. W. Hoogenboom, K. Kadowaki, B. Revaz, and Ø. Fischer, Physica C 391, 376 (2003).
- (17) M. Kugler, Ch. Renner, V. Mikheev, G. Batey, and Ø. Fischer, Rev. Sci. Instrum. 71, 1475 (2000).
- (18) B. W. Hoogenboom et al., Phys. Rev. B 62, 9179 (2000).
- (19) J. Zaanen and O. Gunnarsson, Phys. Rev. B 40, 7391 (1989). S.-C. Zhang, Science 275, 1089 (1997). V. J. Emery, S. A. Kivelson and J. M. Tranquada, Proc. Natl. Acad. Sci. U.S.A. 96, 8814 (1999). M. Vojta and S. Sachdev, Phys. Rev. Lett. 83, 3916 (1999). X.-G. Wen and P. A. Lee, Phys. Rev. Lett. 76, 503 (1996). S. Chakravarty, R. B. Laughlin, D. K. Morr, and C. Nayak, Phys. Rev. B 63, 94503 (2001).
- (20) H.-D. Chen, J.-P. Hu, S. Capponi, E. Arrigoni, and S.-C. Zhang, Phys. Rev. Lett. 89, 137004 (2002). H.-D. Chen, O. Vafek, A. Yazdani, and S.-C. Zhang, cond-mat/0402323 (2004). Z. Tešanović, cond-mat/0405235 (2004). P. W. Anderson, cond-mat/0406038 (2004).