Cluster size distribution of infection in a system of mobile agents
Abstract
Clusters of infected individuals are defined on data from health laboratories, but this quantity has not been defined and characterized by epidemy models on statistical physics. For a system of mobile agents we simulate a model of infection without immunization and show that all the moments of the cluster size distribution at the critical rate of infection are characterized by only one exponent, which is the same exponent that determines the behavior of the total number of infected agents. No giant cluster survives independent on the magnitude of the rate of infection.
keywords:
Non-equilibrium phase transitions , Contact process , Number of Clusters , Epidemic DynamicsPACS:
89.75.-k , 87.23.Ge , 64.60.H1 Introduction
In a small and highly urbanized nation like Singapore
dengue outbreaks or epidemics are identified as
“clusters”. A dengue cluster or focus of transmission is defined
as at least two confirmed cases, with no recent travel
history, that are located within 200 m of each other
(taken as the flight range of the Aedes aegypti)
and whose dates of the onset of symptoms are within three
weeks of each other [1].
Some efforts have been directed
towards the characterization
of ’SIS’ models of infections, or epidemics without
immunization [2, 3, 4], that is the state
of the particles are healthy or infected, and are susceptible
to re-infection after healing, thus the name of the model
(SIS: susceptible-infected-susceptible).
Analytical and numerical expressions describe the dynamics of
the model in terms of the rate of spreading ,
the evolution of the survival probability of infection , the
mean number of infected agents and the mean square distance of
spreading in time, which are quantities difficult to
compare with real data of epidemics. This work suggests an application
of potential comparison with public health data, analyzing a scaling
function for clusters numbers on a model of infection.
The second important ingredient of this work is the
mobility of agents, contrasted to most of the models of
epidemy where the population is modeled
by static networks [2, 3, 4].
In a previous work [5] we showed that the model of infection
on a system of mobile agents has critical exponents which
depends on the density of the system, i.e spatial correlations
and mobility of the agents play an important role. We obtained a crossover
from mean field behavior for low densities to static -lattices
for higher densities. Here we use our model of mobile agents to define
clusters of infections and analyze its dependency on the rate
of infection (defined in detail bellow) and on the mobility
of the agents.
We propose a time-evolving network model: A link between
two moving agents is created when they collide with
each other and there is transmission of the infection among them
(i.e through infected-susceptible interactions), the
link lasts a characteristic time of infection.
We find that the network of clusters of infections
remains disconnected and no matter how large the rate of infection,
no giant cluster is formed. We show that in the transition
to spreading, the moments of the cluster size distribution are described by
an exponent , which is the exponent that characterizes the fraction
of infected mass , defined as
the ratio of the number of infected agents () and
the total amount of population (). Thus the number of clusters
depends on , and mobility and spatial correlation of
the agents influence its dependency.
2 Model
soft disks, with radius , represent
agents which move in a two dimensional cell of linear size
, with density . The system has periodic
boundary conditions and is initialized as follows: the agents are
placed in the cell with the same velocity modulus
and randomly distributed directions, positions and
states: ’infected’ or ’susceptible’. If a susceptible agent collides
with an infected agent (i.e ),
then becomes infected. Each infected agent heals and becomes
susceptible again after a fixed number of time steps, called
the ’time of infection’ (), which is a free parameter
of the model.
The physical interaction of the agents is modeled by molecular dynamic
with a leap-frog integration method [7], the interaction potential
is a Lennard-Jones truncated potential (see more details in [5]).
The resulting model is a contact process [6], where
the infected species become extinct unless the infection spreads rapidly
enough. The transition between survival and extinction depends on a critical
rate of spreading that marks the transition into an absorbing
state. The infection rate is defined as the number of agents
one agent infects before healing. For this system,
| (1) |
where is the characteristic time of flight between two collisions, which is determined by the density () and the mean velocity of agents (). The critical exponents of the transition to spreading were presented by us for the same kind of system [5], where the study was done in terms of the fraction of infected individuals (). Here we go further and characterize the behavior of the clusters of infected individuals. When agent infects agent a link is created among them, the link lasts until one of them heals, meanwhile each of them continues making links with other susceptible agents through the same rule. A cluster is thus defined as a group of infected agents connected by links. Note that in contrast to percolation, where clusters are given by occupied lattice sites connected by nearest-neighbor distances, for this model each cluster gives a group of agents infected in a given period of time linked by a relation of contagion. Isolated infected agents are regarded as clusters of size unity and any cluster consisting of connected agents is an . We borrow the notation from Stauffer’s book on percolation theory [8] and define here as the number of -clusters per agent, where is the number of clusters of size and the total number of agents in the system. For different values of , in the next section we present the results of the calculation of the first three moments of the cluster size distribution. Namely: , , . Those quantities give us, respectively, information about: the total number of clusters, the fraction of infected agents and the mean size of clusters. In order to keep the analogy with the calculation on percolation, we sum over all values of excluding the largest cluster (). We also present, the calculations of , the fraction of agents that belong to the largest cluster and , the fraction of agents that are infected.

3 Results
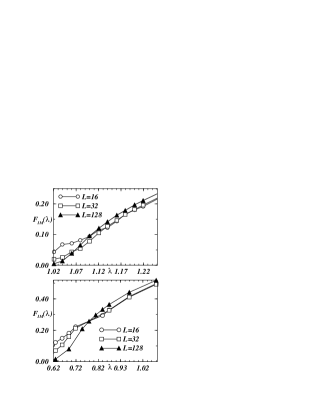
For a fixed density, we vary (Eq. 1)
changing the time of infection ().
Starting with half of the population infected, for
rate of infections near , a given trial
may end into the absorbing state after a few time
steps or it may survive fluctuating with a
quasi-stationary fraction of infected agents, marked
with windows in the left-side of Fig 1.
The calculations are made averaging on time at
the quasi-stationary state, which is described
by the surviving trials following an initial transient.
The number of time steps of this transient
depends on and on the system size (see left side
of Fig. 1). The data here illustrate how
the mean fraction of infected agents (the
superscript denotes an average restricted to
surviving trials) approaches its stationary value
(in the following, we write
just like .
In the right side of the same figure we see the graph of
, which becomes
sharper increasing the system size. We analyze in detail
the number of clusters for the two density values and
, which have critical rate of spreading
and respectively. Note
that at the critical density , surviving trials
tend to stationary values only in the limit .
The left side of Fig. 2 is only for pedagogical reasons, in order
to illustrate how the number of clusters looks in the quasi-stationary state, we see
snapshots of the clusters of infections for different systems
densities and the same rate of infection , here .
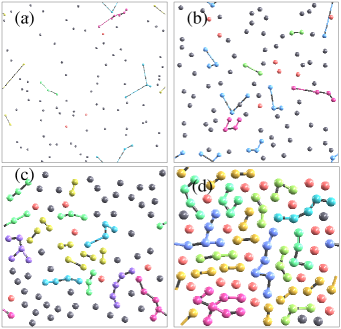
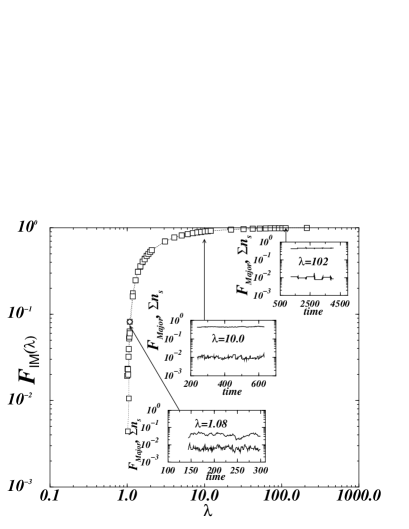
For and , the right side of Fig. 2 shows the variation of and averaged over different realizations. The insets show the change in time of and , for only one realization with , and . In contrast to percolation results, in this model there is no significant variation of with , and the relation remains. Moreover, the number of clusters grows considerably only near .
.
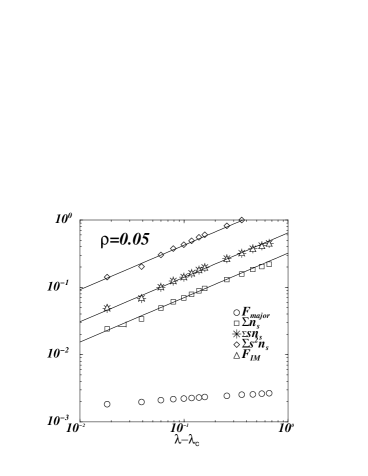
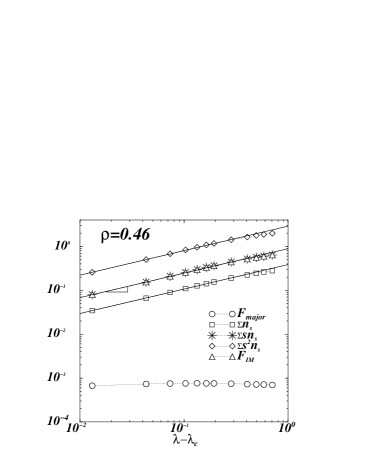
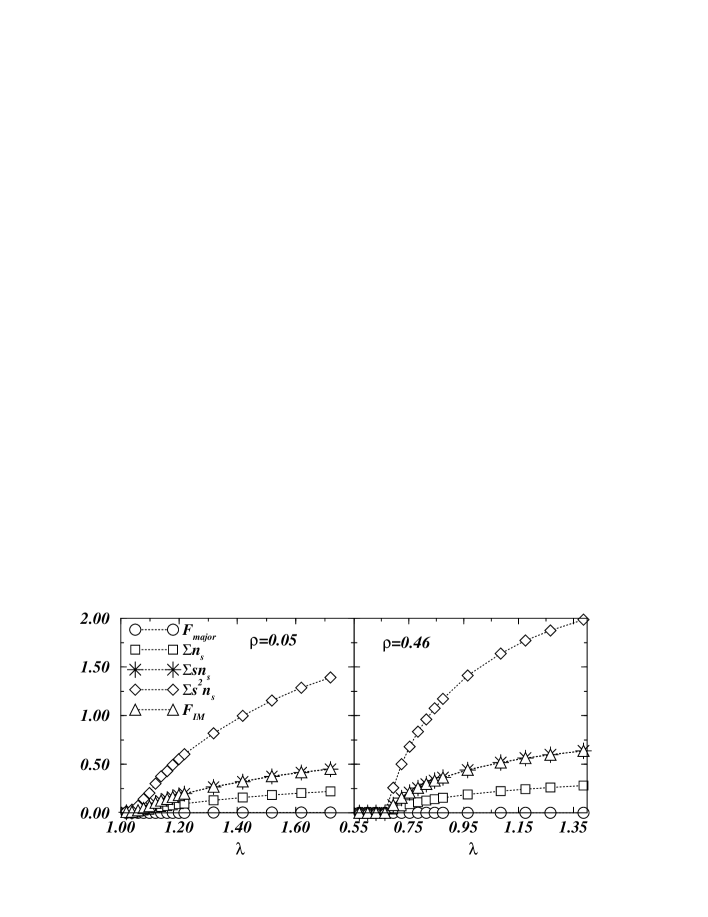
In Fig. 3 for and , we plot the behavior of the cluster numbers near their respective . As the largest cluster remains small compared to the total number of agents (), we have .Additionally one can see that and show the same critical behavior as , plotted in detail in Fig. 4. We observe that all the moments of the cluster size distribution present exactly the same critical behavior than , namely , where depends on the density of the system.
4 Conclusions
This work showed that the cluster size distribution of infected individuals is described in terms of the spreading rate () and the same exponents () previously known for the total mass of infection. Although the agents are free to move there is a homogeneous size distribution of infected clusters at the critical rate of infection, and we did not find any critical exponent associated with the cluster sizes. Comparing with the traditional model on a static network we confirm that mobility and spatial correlations change the value of the critical exponent of the fraction of infected population, and to the same extent the cluster size distribution of infection.
References
- [1] B. Loh and R. Jn Song, Dengue Bulletin, 25,74-78,(2001).
- [2] D. Mollison, J.R. Statist. Soc. B, 39, p. 283 (1977).
- [3] P. Grassberger, J. Phys. A: Math. Gen., 22, p. 3673 (1989).
- [4] R. Pastor-Satorras and A. Vespignani, Phys. Rev. E, 63, 066117, (2001).
- [5] M. C. González, H. J. Herrmann, Physica A, 340, p.741 (2004).
- [6] J. Marro and R. Dickman, Nonequilibrium phase transitions in lattices models (Cambridge University Press, Cambridge , 1999).
- [7] D. C. Rapaport, The Art of molecular dynamics simulation (Cambridge University Press, Cambridge, 1995).
- [8] D. Stauffer, Introduction to Percolation Theory (Taylor & Francis, London, 1985).