Suppression of magnetic relaxation processes in melt-textured YBa2Cu3Ox superconductors by a transverse ac magnetic field
Abstract
The effect of the transverse AC magnetic field on relaxation process in YBa2Cu3Ox melt-textured superconductor was studied. A factor of 50 suppression of the relaxation rate could be achieved at the expense of some reduction in the maximum trapped field, with the magnetic-induction gradient being unchanged. This phenomenon is interpreted as a result of an increase of the pinning force after the action of the transverse AC magnetic field that is confirmed by the measurement of the trapped-induction distribution.
pacs:
74.25.Nf, 74.25.QtThe electrodynamics of hard superconductors was under study for a long time. A wide variety of interesting phenomena were discovered and interpreted on the basis of the developed concepts. One of them is the suppression of static magnetization under the action of a transverse AC magnetic field. First, this phenomenon was observed and interpreted by Yamafuji and coauthors.yama1 ; yama2 . If one places a superconducting strip into a perpendicular static (DC) magnetic field and then apply an AC magnetic field along the strip surface, the critical profile of the static magnetic flux changes noticeably. The short vortices oriented in perpendicular to the strip are shown to bend and move in such a way that the static magnetic flux tends to become homogeneous. This phenomenon and its consequences were studied theoretically in detail in recent papers.brand1 ; brand2
The other origin of the suppression of the static magnetization by the transverse AC magnetic field (the collapse phenomenon) was considered in Refs. col-new, ; cut, ; kin, ; cross, ; felpap, . If the vortex length exceeds significantly the penetration depth of the AC field, the vortex bend does not play an essential role and the flux-line cutting mechanism (the phenomenon predicted by Clem Clem ) is put in the forefront. As was shown in Refs. cut, ; kin, ; felpap, , it is the flux-line cutting that provides the homogenization of the static magnetic flux in the wide areas of the sample bulk where the AC field has penetrated (the creation of collapse zone). If the AC amplitude exceeds the penetration field the distribution of the static magnetic induction becomes homogeneous in the whole sample bulk and the magnetic moment disappears.cross ; Willemin
It is well-known that the inhomogeneous magnetic flux distribution is metastable. According to the classical paper by Anderson,Ander such a state of a superconductor relaxes to the homogeneous one following the logarithmic law. Within the existing concept on the collapse, one could expect a noticeable decrease of the relaxation rate of the magnetic moment after the action of the AC field. Indeed, the surface homogeneous region of the sample, the collapse zone, should be filled by the vortices and the critical gradient should be established before the vortices start to leave the sample and the magnetic moment begins to decrease. In the present paper we have checked this assumption and made sure that the relaxation rate of the DC magnetic moment is actually decreased significantly by the action of the transverse AC magnetic field. Surprisingly, we have observed a striking concomitant phenomenon which appears to be of general interest in vortex matter. Not only the magnetic moment does not changes, but the spatial distribution of the static magnetic flux holds the shape without significant relaxation for a long time after the action of AC field. Moreover, this distribution conserves after the moderate temperature increase. This strongly suggests that the critical current density grows after the action.
Melt-textured YBCO plate-like samples of mm3 (sample A) and mm3 (sample B) in sizes were cut from a homogeneous part of bulk textured cylinders grown by the seeding technique. The homogeneity was checked by a scanning Hall-probe. The c-axis was perpendicular to the largest face of the sample. At K, the characteristic value of the critical current density in the ab plane is of the order of 13 and 22 kA/cm2 for samples A and B (in self-field), respectively. The ‘static’ magnetization was measured by a vibrating sample magnetometer in the external magnetic field created by an electromagnet. The zero-field cooled sample was exposed to the magnetic field of 12 kOe which was further reduced to 5 kOe; from this point, the relaxation measurement was started. The above-mentioned fields are essentially higher than the penetration field of the sample (1.6 kOe). A commercial Hall-probe was fixed on the sample to measure the evolution of the magnetic induction locally. The other Hall-probe with the sensitive zone of mm2 was used to scan the magnetic induction distribution on the sample surface. The distance from the sample to the sensitive zone of the probe was about 0.2 mm. The Hall measurements were performed in the zero field after exposition of the sample to kOe. The AC magnetic field was a computer-generated triangle-wave with the frequency Hz. The AC field could be applied for a definite number of periods and stopped exactly at the end of the period (at ). In our experiments we used 999 full cycles of the AC field. Most of the measurements were performed at the liquid nitrogen temperature K.
Figure 1(a) demonstrates the influence of the orthogonal AC magnetic field on the relaxation of . The conventional (without the AC field) relaxation is shown to follow the logarithmic law, that implies an exponential current-voltage characteristic (CVC) (see inset), where is a depinning current at the zero temperature and is a pinning-well depth.Ander For the other run, at s the AC field of the amplitude was applied, followed by the sharp drop in the magnetization due to the collapse-effect.cross When the AC field action has finished, we can see almost no relaxation for the first 100 seconds and essentially reduced logarithmic relaxation rate for the rest of the observation period.
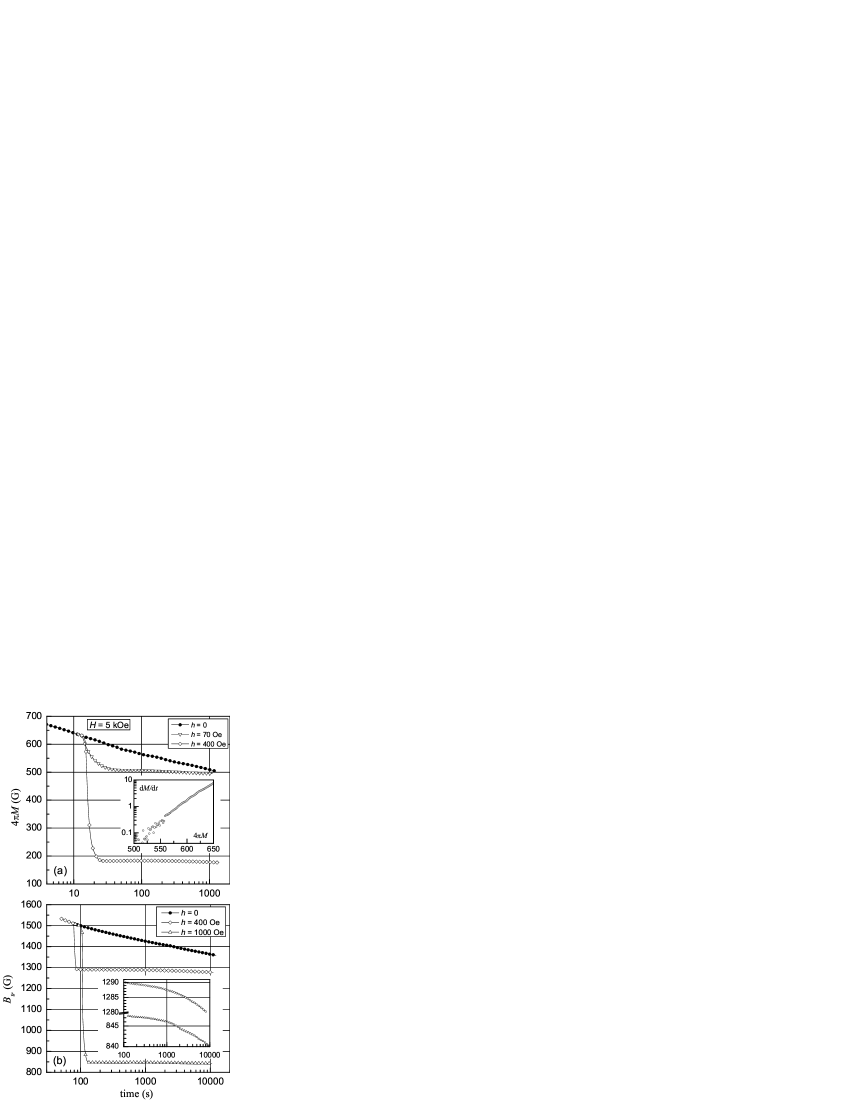
To reduce the minor effect of the magnetic-field relaxation in the electromagnet on the magnetization we studied the temporal dependence of the trapped magnetic induction in the central part of the sample without any external magnetic field by the Hall-probe. Three curves in Fig. 1(b) correspond to the same magnetic prehistory of the sample, but differ from each other because of the action of the AC field with different amplitudes. The upper curve is obtained for the case when the AC field was not switched on during the measurement at all, . Two lower curves demonstrate the influence of the AC field on the relaxation of . All curves in Fig. 1(b) follow the same logarithmic-like law before switching on the AC field. Switching on the AC field results in a giant suppression of the relaxation rate (5 – 60 times). The inset to Fig. 1(b) shows that the decrease of the relaxation rate depends essentially on the amplitude of the AC field and does not follow the logarithmic law for the whole time-window.
The abrupt decrease of the static magnetization under the action of the AC field (the jumps shown in Fig. 1) is connected to the suppression of the DC shielding currents in all sample regions where the AC field penetrates. The suppression of the relaxation of and could be easily interpreted as a result of the collapse: vortices can not leave the sample before the sufficient gradient of the magnetic induction would be restored in the surface regions of the sample. From the macroscopic point of view, the other explanation looks plausible. As we reduce the magnetization (and current density) significantly, we should get a huge decrease in in accordance with the exponential CVC (see inset to Fig. 1(a)). However, this explanation will work only in the case of the uniform distribution of the shielding currents. As we will see below this is not the case.
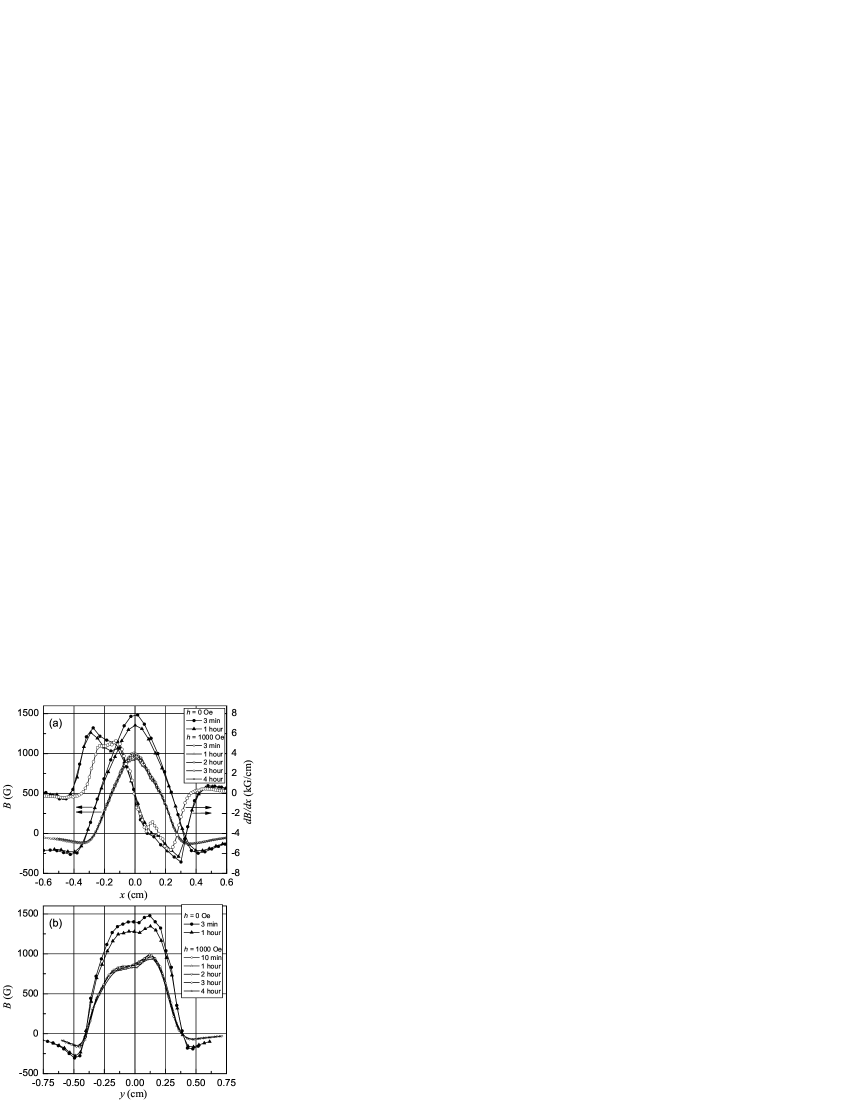
To clarify the real influence of the AC field on the relaxation process we have investigated the temporal evolution of the DC magnetic field distribution by the scanning Hall-probe. The spatial distribution (across the AC field direction) of the trapped DC magnetic field is shown in Fig. 2(a). The unperturbed curves (closed symbols) demonstrate Bean-like profiles of the magnetic flux distribution which relaxes obviously in one hour. After the action of the AC field (open symbols) the relaxation is suppressed significantly in accordance with the data of Fig. 1(b). The change in the profile width along -axis is due to the collapse of the DC shielding currents in the regions of the sample where the AC field has penetrated (the ‘collapsed’ regions marked with ‘C’ in Fig. 3). Even at a first glance at the curves in Fig. 2(a) one can reveal a very important consequence of the action of the AC field. The magnetic field distribution in the central part of the sample before and after this action differs by the vertical displacement, with the gradient being the same. Numerically calculated curves shown in Fig. 2 (a), confirm this observation to be true everywhere except most outer regions. This means that the current densities in R1-regions remain their initial values in all sample regions where the AC field has not penetrated along the -direction. However the regions occupied by the currents flowing along the -direction (R2) are not changed. This, together with the decrease of the maximum trapped field results in the decrease of the current density in R2 regions (see Fig. 2(b)) that makes them subcritical and suppresses the relaxation in the -direction. This decrease of the local induction itself could affect the relaxation rate directly, due to an increase of the or a change in the CVC exponent. However, the change of the CVC exponent with the magnetic field is too low to explain the huge change in .Kupfer The influence of local on through the change could be estimated comparing the data of Fig. 1 (a) and (b). The external magnetic field in Fig. 1 (a) is well higher than the penetration field and the ac field. In this case, the change of the local is essentially lower than for zero-field measurement Fig. 1 (b), but the effect of the relaxation suppression does exist and is qualitatively the same.
The most interesting feature of the relaxation after the action of the AC field is the following. Not only the magnetization and the magnetic induction but the distribution of the DC-field gradient, i. e. distribution of the DC shielding currents, stops the relaxation after the action of the AC field. The vortices in the central part of the sample (R1 and R2-regions in Fig. 3) could not move into the collapsed regions (‘C’). This is probably due to impossibility to overcome the cutting barrier,park ; Indenbom because the C-regions are (at least partially) filled with the vortices aligned with the -axis. However, the other possible origin of the suppression of relaxation has to be considered.
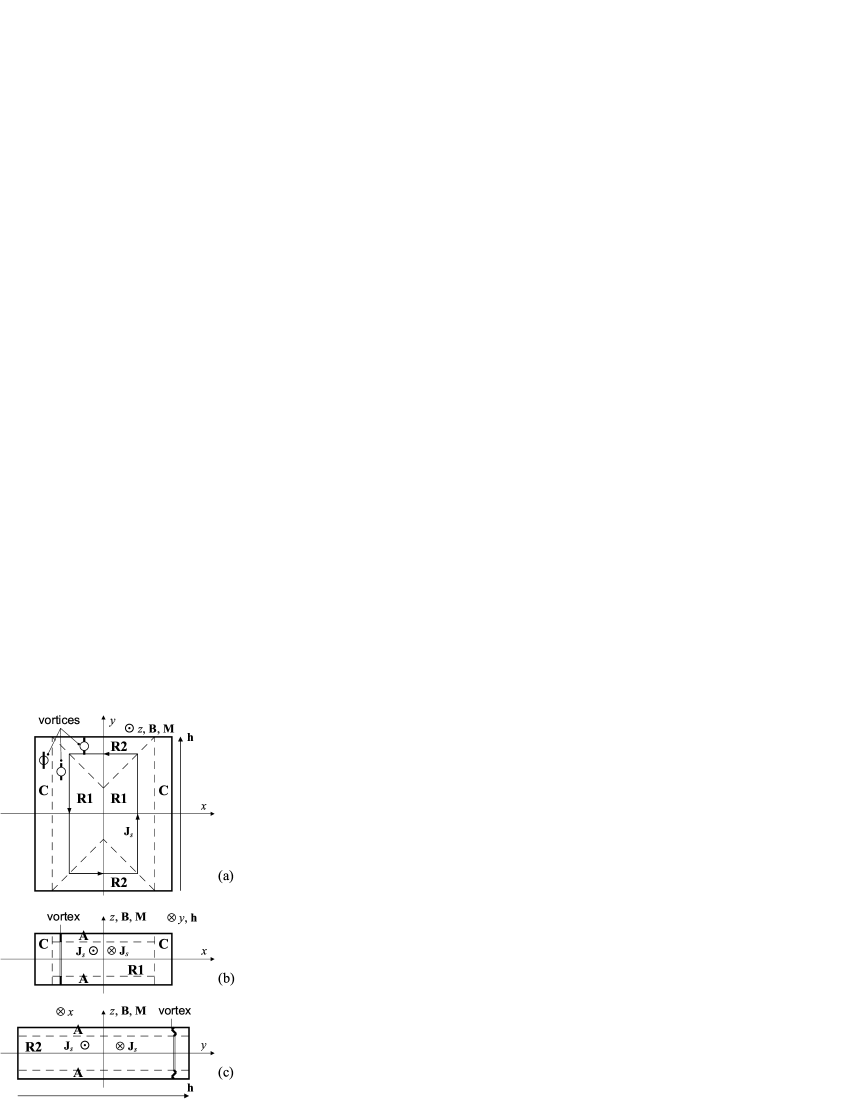
We suppose the penetration of the AC field from the largest () faces of the sample to be of great importance. The first possible reason is an increase in the vortex length accompanied by the pinning energy gain, tending to the increase of the , because the vortices turn out to be ‘anchored’ by their tails (in the A-regions). The elongation of the vortices occurs in such a way (along -axis) that there is no additional Lorentz force directed outside the sample (along - and -directions). Thus, the shielding currents become subcritical resulting in the exponential decrease of the relaxation rate. However, to explain the significant decrease of by the vortex-length increase along, the relative vortex elongation must be of the order of the logarithmic relaxation-rate decrease, which is hardly possible. Moreover, in the collective pinning approach Blatter the vortex elongation gives only sublinear term in the free energy. The other explanation could be based on the anisotropy of the pinning force in the YBCO superconductors. After the action of the AC field, parts (segments) of the vortices in the A-regions can be aligned and locked-in in the ab-plane leading to an increase of the pinning force. The action of the AC field could also result in the bend or entangling of the vortices in the A-regions at the scale of 100 – 1000 vortex-lattice periods. As a result, a significant increase of the vortex-bundle size can take place. This, in turn, can lead to the increase of the collective pinning potential Blatter and to the observed suppression of the relaxation rate.
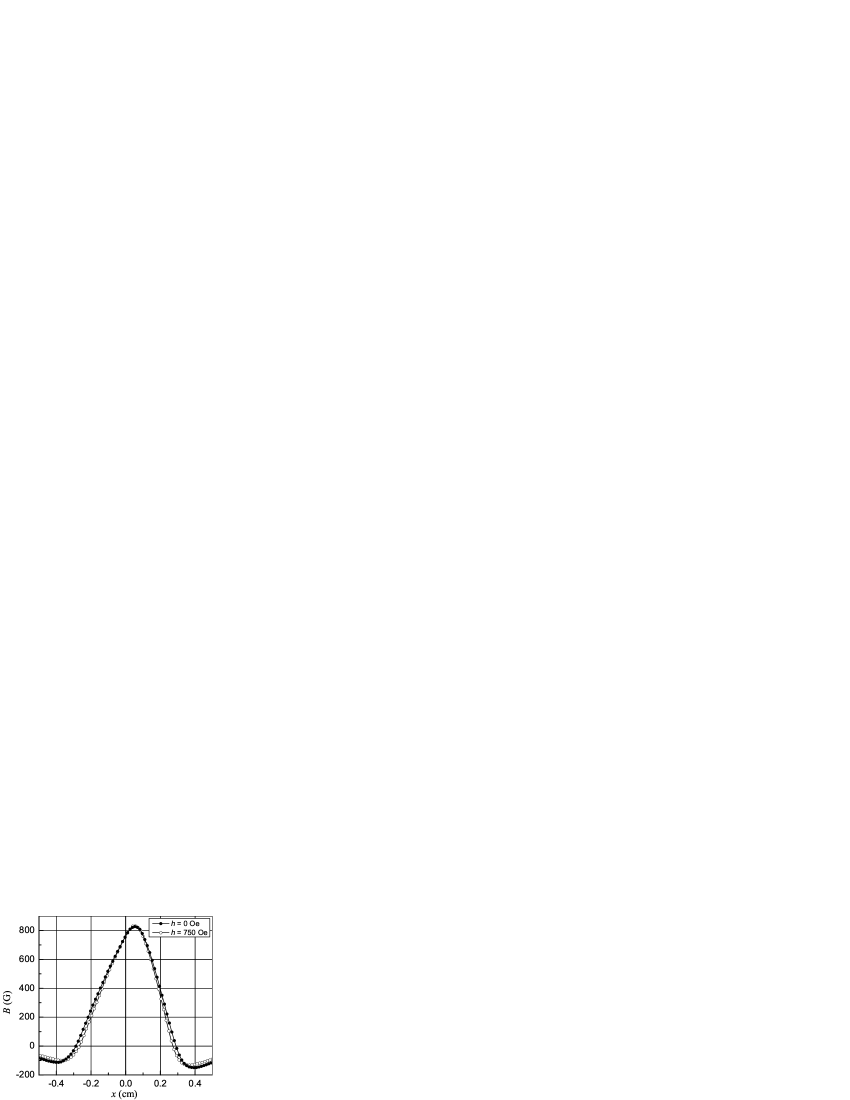
To check if the action of the AC field does increase the critical current density, the following experiment was done. Suggesting the shielding currents becomes subcritical after the action we could increase the temperature without decrease of the current density. Our scanning-Hall-probe setup permits only 77 K measurements, so we have to decrease the temperature back to 77 K to investigate the changes. This temperature decrease should not change the magnetic flux profile in any way in the absence of the external magnetic field, thus we can study a distribution frozen from the higher temperature. The magneto-thermal history was as follows. Sample B was cooled to 83 K in the external magnetic field of 10 kOe then the field was switched off. At this point the AC field was applied (or not applied in the other run). Further, the sample was heated by 3 K to ‘develop’ a difference between perturbed and non-perturbed flux profiles. Before this heating, they should look like the profiles on Fig. 2(a) (the gradients are the same). Upon heating the non-perturbed profile should follow the changes and perturbed one will go from subcritical to a critical state (possibly with a higher ). Finally, the sample was cooled down to 77 K and profiles were measured. (Note, that these profiles correspond to the critical current at K.) These experiments were repeated several times, with the temperatures reproducibility being better than 0.05 K. The result is shown in Fig. 4. The perturbed profile is seen to keep narrower form but the maximum field is the same. This means that the magnetic-induction distribution is steeper and the critical current density in the ‘perturbed’ sample is higher. The crude evaluation gives the increase of at least 8%.
Summarizing, we have observed the giant decrease of the relaxation rate after the action of the transverse AC magnetic field. This effect exists in the relaxation of the ‘static’ magnetization and the local value of the trapped magnetic induction. After this action, the distribution of the magnetic induction across the AC field direction turns out to be frozen with the same current density. This distribution conserves even if the temperature of the sample increased by several Kelvin giving a new critical state with a higher . We suppose the increase of the vortex length accompanied by partial locking of the vortex segments in the ab-planes could be a reason of this phenomenon. The observed effect can also be a result of the increase of the collective pinning potential due to the increase of the vortex-bundles dimension in the ab-plane.
We thank A. L. Rakhmanov for helpful discussions. This work is supported by INTAS (grant 01-2282), RFBR (grant 03-02-17169), and Russian National Program on Superconductivity (contract 40.012.1.1.11.46).
References
- (1) K. Funaki and K. Yamafuji, Jpn. J. Appl. Phys. 1, 299 (1982).
- (2) K. Funaki, M. Noda, and K. Yamafuji, Jpn. J. Appl. Phys. 21, 1580 (1982).
- (3) E. H. Brandt and G. P. Mikitik, Phys. Rev. Lett. 89, 027002-1 (2002).
- (4) G. P. Mikitik and E. H. Brandt, Phys. Rev. B67, 104511 (2003).
- (5) L. M. Fisher, A. V. Kalinov, I. F. Voloshin, I. V. Baltaga, K. V. Il’enko, and V. A. Yampol’skii, Solid State Commun. 97, 833 (1996).
- (6) I. F. Voloshin, A. V. Kalinov, S. E. Savel’ev, L. M. Fisher, V. A. Yampol’skii, and F. Pérez-Rodríguez, JETP 84, 592 (1997).
- (7) S. E. Savel’ev, L. M. Fisher, and V. A. Yampol’skii, JETP 85, 507 (1997).
- (8) L. M. Fisher, A. V. Kalinov, S. E. Savel’ev, I. F. Voloshin, V. A. Yampol’skii, M. A. R. LeBlanc, and S. Hirscher, Physica C 278, 169 (1997).
- (9) L. M. Fisher, K. V. Il’enko, A. V. Kalinov, M. A. R. LeBlanc, F. Pérez-Rodríguez, S. E. Savel’ev, I. F. Voloshin, and V. A. Yampol’skii, Phys. Rev. B61, 15382 (2000).
- (10) J. R. Clem, Phys. Rev. B26, 2463 (1982).
- (11) M. Willemin, C. Rossel, J. Hofer, H. Keller, A. Erb, and E. Walker, Phys. Rev. B58, R5940 (1998).
- (12) P. W. Anderson and Y. B. Kim, Rev. Mod. Phys. 36, 39 (1964).
- (13) H. Küpfer, S. N. Gordeev, W. Jahn, R. Kresse, R. Meier-Hirmer, T. Wolf, A. A. Zhukov, K. Salama, D. Lee, Phys. Rev. B50, 7016 (1994).
- (14) S. J. Park, J. S. Kouvel, H. B. Radousky, and J. Z. Liu, Phys. Rev. B48, 13998 (1993).
- (15) M. V. Indenbom, C. J. van der Beek, V. Berseth, W. Benoit, G. D’Anna, A. Erb, E. Walker & R. Flukiger, Nature 385, 702 (1997).
- (16) G. Blatter, M. V. Feigel’man, V. B. Geshkenbein, A. I. Larkin, V. M. Vinokur, Rev. Mod. Phys. 66, 1125 (1994).