Magnetic Order and Spin Dynamics in Ferroelectric HoMnO3
Abstract
Hexagonal HoMnO3 is a frustrated antiferromagnet (TN=72 K) ferroelectric (TC=875 K) in which these two order parameters are coupled. Our neutron measurements of the spin wave dispersion for the Mn3+ on the layered triangular lattice are well described by a two-dimensional nearest-neighbor Heisenberg exchange J=2.44 meV, and an anisotropy that is 0.093 meV above the spin reorientation transition at 40 K, and 0.126 meV below. For the magnetic structures and phase diagram have been determined, and reveal additional transitions below 8 K where the ferroelectrically displaced Ho3+ ions are ordered magnetically.
pacs:
75.30.Ds, 75.30.Et, 75.50.EeMagnetic ferroelectric materials are rare, and rarer still are systems where these two disparate order parameters exhibit significant coupling Hill (2000). Such multiferroics have been of particular interest recently both to understand the fundamental aspects of this coupling Sugie et al. (2002); Kimura et al. (2003); Hur et al. (2004); Lorenz et al. (2004); Lottermoser et al. (2004), and because of the intriguing possibility of using these coupled order parameters in novel device applications H. Zheng et al. (2004). The hexagonal HoMnO3 system of particular interest here is a prototype multiferroic where the Ho-O displacements give rise to a ferroelectric moment (TK) along the c-axis, the Mn moments order at 72 K, and the order parameters are naturally coupled through the Ho-Mn exchange and anisotropy interactions. The magnetic system has the added interest that the Mn moments occupy a fully frustrated triangular lattice. Our inelastic neutron scattering measurements of the Mn spin dynamics reveal the planar nature of the spin system, and allow us to establish the basic model for the magnetic interactions in the system and determine the interaction parameters. Field-dependent neutron diffraction measurements reveal the nature of the magnetic phase diagram, and in particular the Ho involvement in the hysteretic magnetic transitions at low temperatures. Our results also suggest that the Ho coupling may be responsible for the first-order spin-flop transition found at intermediate temperatures.
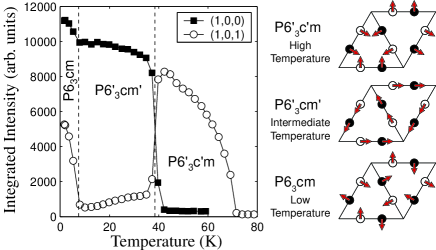
We have grown single crystals of HoMnO3 using a traveling solvent optical floating zone furnace, and the diffraction and inelastic neutron measurements were performed at the NIST Center for Neutron Research on the BT2 and BT9 thermal triple-axis instruments. The magnetic structure of HoMnO3 has been studied previously with neutron powder diffraction Koehler et al. (1964); Muñoz et al. (2001); Lonkai et al. (2002), optical second-harmonic generation (SHG) Fiebig et al. (2000a, b, 2002a, 2002b), and magnetic and dielectric susceptibility Sugie et al. (2002). The Mn3+ ions are arranged in a 2-dimensional (2D) triangular lattice, with successive layers offset from each other. Fig. 1 shows the integrated intensities of the (1,0,0) and (1,0,1) (commensurate) magnetic Bragg peaks, where we see that below 72K the spin-2 Mn3+ moments order antiferromagnetically in a non-collinear 120-degree structure within each plane. At 40 K a sharp spin reorientation transition is observed associated with a change in the magnetic symmetry to the structure, as indicated in Fig. 1. Below 8 K half of the Ho3+ moments order Muñoz et al. (2001); Lonkai et al. (2002), which results in a third zero-field spin reorientation transition of the Mn spins. The three zero-field Mn spin structures are also shown in Fig. 1.
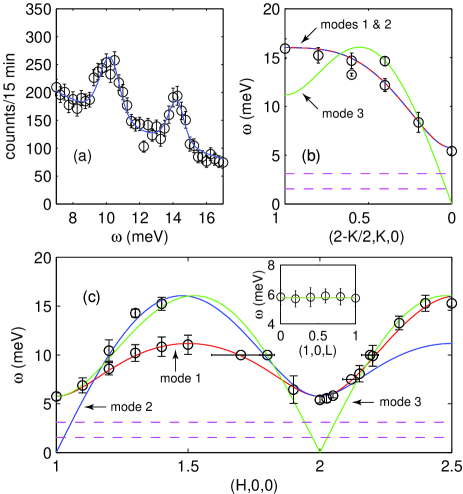
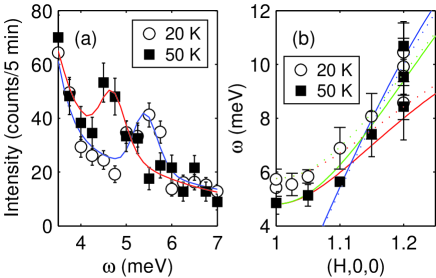
Measurements of the spin-wave dispersion were performed on a 1.8 gram single crystal in both the (H,K,0) and (H,0,L) scattering planes. An example of a constant-Q scan at 20K showing two distinct magnetic modes is shown in Fig. 2a. Fits to individual scans were used to establish the peak positions. The dispersion relations at 20K, in the intermediate-temperature phase, are plotted in Fig. 2b and 2c along two different directions in reciprocal space. Data for the spin-wave dispersion along the (1,0,L) direction (inset Fig. 2c) show no discernible dispersion in the out-of-plane direction, indicating primarily 2D spin dynamics. Data were also taken at 50K, in the high-temperature phase, and a comparison of two constant-Q scans at the magnetic zone center are shown in Fig. 3a. The zone-center gap decreases significantly, as shown in the comparison of the 20K and 50K dispersion data in Fig. 3b.
The dispersion of the excitations in HoMnO3 was calculated using a linear spin-wave analysis. We start from the Hamiltonian
| (1) |
where indicates the sum is over nearest-neighbor in-plane pairs, is the primary antiferromagnetic exchange, and is the anisotropy. Introducing three different flavors of bosons and using a Holstein-Primakoff transformation, we derive a linearized Hamiltonian which we diagonalize by mapping to the Hamiltonian of the quadratic quantum mechanical oscillator, similarly to Ref Harris et al. (1992). We define the lattice Fourier sum as
| (2) | |||||
For simplicity, we now define
| (3) |
We obtain three modes whose dispersion is given by
| (4) |
where = 1, 2, or 3, and is the spin at the Mn3+ ion. Equation 4 was used to fit our data, with the results shown by the curves in Figs. 2b, 2c, and 3b. This simple model provides a remarkably good description of the spin dynamics. Quantitatively, we obtain meV and at 20 K. Data taken away from the zone center showed little temperature dependence, while at the zone center there was a significant difference between the 20K and 50K data, indicating that the temperature dependence of the spin-wave spectrum comes largely from changes in the anisotropy. For the 50K data, was therefore kept fixed at 2.44 meV, yielding . The increase in the anisotropy at lower temperatures is signficant, and suggests that this anisotropy, likely originating from the holmium, drives the spin reorientation transition.
In the presence of a magnetic field shifts to lower T and broadens, and HoMnO3 develops a reentrant phase. A sharp anomaly in the dielectric susceptibility at indicates a coupling between the magnetic and ferroelectric order Lorenz et al. (2004). SHG measurements as a function of magnetic field also show the change in magnetic symmetry and the reentrant phase as a function of magnetic field suggested by dielectric susceptibility Fiebig et al. (2002a). More recent measurements show a marked decrease in the strength of the SHG signal (which is due to the magnetic ordering of the Mn3+ ions) when an electric field is applied Lottermoser et al. (2004).
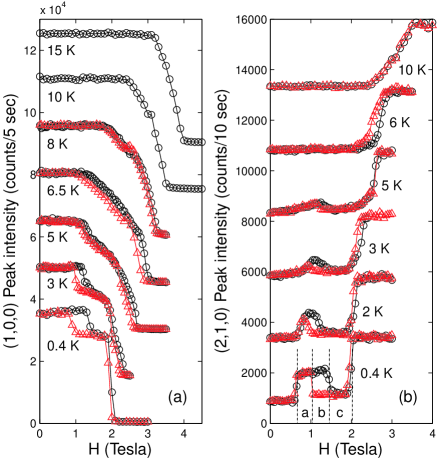
To investigate the magnetic field-dependent phase diagram, a 0.5 gram sample was mounted in the (H,K,0) scattering plane inside a vertical-field 7 Tesla superconducting magnet with a Helium-3 insert. A magnetic field of up to 5 Tesla was applied along the axis, and the (commensurate) (1,0,0) and (2,1,0) magnetic peaks were used to track the evolution of the magnetic phases with magnetic field and temperature. In the intermediate temperature phase, a sufficiently strong applied magnetic field along the axis pushes HoMnO3 into the high-temperature phase Fiebig et al. (2002a); Lorenz et al. (2004). The boundary between the intermediate- and high-temperature phases (shown in Fig. 5 as a function of temperature and magnetic field) is in agreement with the phase diagram established from dielectric susceptibility measurements Lorenz et al. (2004); lor .
At lower temperatures the transition becomes considerably more complicated. Figure 4a shows the peak intensity of the (1,0,0) Bragg scattering as a function of magnetic field at several temperatures. At higher temperatures, the intensity decreases approximately linearly with increasing field over a well-defined transition region. At 0.4K, however, there are two distinct, step-like transitions, with considerable hysteresis in the lower-field transition, indicating the existence of a well-defined intermediate phase between the low- and high-field phases. As the temperature increases, these transitions become broader and the hysteresis decreases, merging together into the single transition (without appreciable hysteresis) observable at higher temperatures.
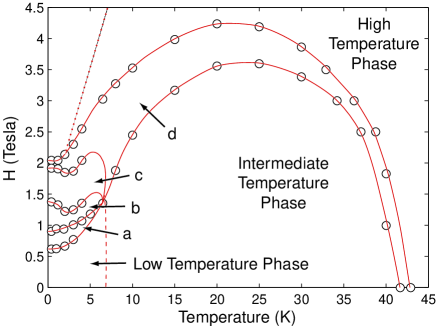
Figure 4b shows equivalent measurements of the (2,1,0) Bragg peak intensity. Again, at high temperatures, an approximately linear change in scattering intensity over a well-defined transition region is observable. At low temperatures, as for the (1,0,0) reflection, the situation becomes more complicated. Instead of two, we find three transitions, with an additional lower-field transition not observable in the (1,0,0) data. Unlike the (1,0,0) reflection, the scattering intensity of the (2,1,0) reflection does not change monotonically.
Figure 5 shows a phase diagram extracted from the (1,0,0) and (2,1,0) diffraction data. Below 4K there are two distinct intermediate phases (labeled and ) between the zero-field and high-field phases, with significant hysteretic overlap between them. These data are not sensitive to the low-temperature spin reorientation observable in the (2,1,0) diffraction data (Fig. 1), indicated roughly by the dashed line in Fig. 5. It is interesting to note, however, that the intermediate phases are only observable below the low-temperature spin reorientation transition where Ho3+ ordering becomes significant.
At higher temperatures, our phase diagram agrees well with previous dielectric measurements Lorenz et al. (2004). These SHG measurements did not observe any intermediate phase at low temperatures Fiebig et al. (2002a), while more recent magnetic susceptibility and heat capacity measurements have identified one intermediate phase lor . While we observe two unambiguous, distinct intermediate phases at low temperatures, the combined intermediate phases we observe agree qualitatively with the intermediate phase recently observed lor . Further measurements of out-of-plane magnetic peaks will be necessary in order to determine the exact magnetic structure of these intermediate phases. Recent SHG measurements suggest that Ho3+ magnetic moments can even be ordered ferromagnetically with the application of an electric field Lottermoser et al. (2004). Neutron scattering reveals considerable complexity in the magnetic field phase diagram for HoMnO3, and extending these neutron measurements to the electric field phase diagram may also prove similarly revealing.
The out-of-plane magnetic interactions in HoMnO3, both between successive Mn3+ layers and between Mn3+ and Ho3+, are almost completely frustrated. It is therefore not surprising that the spin dynamics in the intermediate and high temperature phases are two-dimensional in nature, and we find that the spin-wave spectrum is well described by Eq. 1. Ferroelectric lattice distortions relieve the interplane frustrations in HoMnO3 Lottermoser et al. (2004), and may be the driving force behind the spin-reorientation transitions of the Mn3+ magnetic lattice. The role of Ho in these reorientation transitions may be very similar to the role of Nd in Nd2CuO4, another layered transition-metal oxide in which frustrated interplanar interactions enable weak, higher-order interactions to dictate the magnetic structure. Nd2CuO4 has a non-collinear structure Skanthakumar et al. (1993) with Cu spin-reorientation transitions Skanthakumar et al. (1989); Endoh et al. (1989) that are controlled by the rare earth single-ion anisotropy Sachidanandam et al. (1997); Petitgrand et al. (1999). We suggest that it is a similar interaction in HoMnO3 that controls the spin-flop transition, and is the origin of the magnetic-ferroelectric coupling.
There has been considerable experimental progress in recent years on mapping out the magnetic phase diagram of HoMnO3 and discovering signatures of the interplay of magnetic and ferroelectric order in various physical properties. However, a theoretical understanding of these interactions is still lacking. Although a complete theoretical description of HoMnO3 will necessarily require significantly more complexity than Eq. 1, having experimentally determined the dispersion relations and values for the primary magnetic exchange constants is an important step toward being able to model the interaction between ferroelectric and magnetic order in HoMnO3.
Acknowledgements.
Work at Rutgers was supported by NSF-MRSEC Grant No. DMR 00-80008. Work at NIST was supported in part by the Binational Science Foundation, Grant No. 2000073. MK was supported by the National Science Foundation through DMR-0306940. Data reduction was performed with DAVE software, supported by NSF Agreement No. DMR-0086210.References
- Hill (2000) N. A. Hill, J. Phys. Chem. B 104, 6694 (2000).
- Sugie et al. (2002) H. Sugie, N. Iwata, and K. Kohn, J. Phys. Soc. Jpn. 71, 1558 (2002).
- Kimura et al. (2003) T. Kimura, T. Goto, M. Shintani, K. Ishizaka, T. Arima, and Y. Tokura, Nature 426, 55 (2003).
- Hur et al. (2004) N. Hur, S. Park, P. A. Sharma, J. S. Ahn, S. Guha, and S. Cheong, Nature 429, 392 (2004).
- Lorenz et al. (2004) B. Lorenz, A. P. Litvinchuk, M. M. Gospodinov, and C. W. Chu, Phys. Rev. Lett. 92, 087204 (2004).
- Lottermoser et al. (2004) T. Lottermoser, T. Lonkai, U. Amann, D. Hohlwein, J. Ihringer, and M. Fiebig, Nature 430, 541 (2004).
- H. Zheng et al. (2004) H. Zheng et al., Science 303, 661 (2004).
- Koehler et al. (1964) W. C. Koehler, H. L. Yakel, E. O. Wollan, and J. W. Cable, Phys. Lett. 9, 93 (1964).
- Muñoz et al. (2001) A. Muñoz, J. A. Alonso, M. J. Martínez-Lope, M. T. Casáis, J. L. Martínez, and M. T. Fernández-Díaz, Chem. Mater. 13, 1497 (2001).
- Lonkai et al. (2002) T. Lonkai, D. Hohlwein, J. Ihringer, and W. Prandl, Appl. Phys. A 74, S843 (2002).
- Fiebig et al. (2000a) M. Fiebig, D. Fröhlich, K. Kohn, S. Leute, T. Lottermoser, V. V. Pavlov, and R. V. Pisarev, Phys. Rev. Lett. 84, 5620 (2000a).
- Fiebig et al. (2000b) M. Fiebig, D. Fröhlich, T. Lottermoser, and K. Kohn, Appl. Phys. Lett. 77, 4401 (2000b).
- Fiebig et al. (2002a) M. Fiebig, C. Degenhardt, and R. V. Pisarev, J. Appl. Phys. 91, 8867 (2002a).
- Fiebig et al. (2002b) M. Fiebig, D. Fröhlich, T. Lottermoser, and M. Maat, Phys. Rev. B 66, 144102 (2002b).
- Harris et al. (1992) A. B. Harris, C. Kallin, and A. J. Berlinsky, Phys. Rev. B 45, 2899 (1992).
- (16) B. Lorenz et al., cond-mat/0408499.
- Skanthakumar et al. (1993) S. Skanthakumar, J. W. Lynn, J. L. Peng, and Z. Y. Li, Phys. Rev. B 47, R6173 (1993).
- Skanthakumar et al. (1989) S. Skanthakumar, H. Zhang, T. W. Clinton, W. Li, J. W. Lynn, Z. Fisk, and S. Cheong, Physica C 160, 124 (1989).
- Endoh et al. (1989) Y. Endoh, M. Matsuda, K. Yamada, K. Kakurai, Y. Hidaka, G. Shirane, and R. J. Birgeneau, Phys. Rev. B 40, 7023 (1989).
- Sachidanandam et al. (1997) R. Sachidanandam, T. Yildirim, A. B. Harris, A. Aharony, and O. Entin-Wohlman, Phys. Rev. B 56, 260 (1997).
- Petitgrand et al. (1999) D. Petitgrand, S. V. Maleyev, P. Bourges, and A. S. Ivanov, Phys. Rev. B 59, 1079 (1999).