Sensitivity of the stress response function to packing preparation
Abstract
A granular assembly composed of a collection of identical grains may pack under different microscopic configurations with microscopic features that are sensitive to the preparation history. A given configuration may also change in response to external actions such as compression, shearing etc. We show using a mechanical response function method developed experimentally and numerically, that the macroscopic stress profiles are strongly dependent on these preparation procedures. These results were obtained for both two and three dimensions. The method reveals that, under a given preparation history, the macroscopic symmetries of the granular material is affected and in most cases significant departures from isotropy should be observed. This suggests a new path toward a non-intrusive test of granular material constitutive properties.
pacs:
81.05.Rm, 45.70.Cc, 45.70.-nParticular attention has been devoted to the study of the static properties of granular assemblies over the past 15 years [1]. In that regard, a now famous and paradigmatic example is that of the stress distribution under a pile of sand. Depending on the manner this pile is built, different pressure profiles are measured. For example, when the material is poured from a point source, e.g. a hopper, then a stress ‘dip’ occurs at the base, under the apex of the pile [2, 3, 4], whereas when the material is poured in a rain-like procedure only a slight ‘hump’ occurs [4]. In this context, a discussion on the nature of the equations governing the distribution of stresses in granular media has emerged [5, 6, 7]. The proposition of hyperbolic equations [8, 9, 10] as opposed to the elliptic equations of elasticity lead to the need for newer more discriminating tests. These typically involved determinating the stress response to a localized force for a slab of grains (the response function). The initial motivation was that the hyperbolic equations predict a double peaked response (a ring in 3D) which would contrast with a single peaked profile expected for elliptic equations out of isotropic elasticity. It is now clear that for generic granular assemblies made of rough grains, an elastic description using elliptic equations is most likely correct [11, 12, 13]. But it is important to note that this need not be the case for samples prepared in the specific case of isostaticity (see [14, 15, 16, 17, 18] and references therein).
One interesting outcome from the previous studies is the fact that, as the layer geometry is simpler than that of the pile, this stress response is a powerful tool to explore the effects of preparation procedures and details of the microstructure. The ultimate goal is to be able to link the response profiles to the internal texture of the packing. For instance, the microscopic texture of the packing is quite sensitive to the details of external actions such as pouring, shearing, etc… One would like to have a probe of this structure which determines the effective elastic properties.
In this paper, we focus on the sensitivity of stress response profiles to the system preparation. First, we give a summary of recent experimental measurements on two-dimensional packings made of photoelastic grains [12, 19]. Then in the second section, we show series of experiments on three-dimensional piling [11, 20]. In the third section we present new data obtained from numerical simulations of granular layers. All these stress profiles and the impact on future investigations are finally discussed in the conclusion.
1 Two-dimensional photoelastic experiments
Experiments were carried out on 2D granular systems consisting of disks and pentagonal particles that were cut from a photoelastic material. In these experiments, it was possible to measure forces on individual particles internally – hence the significant value of the approach. In principle, it is possible to directly obtain the forces at contacts by solving an inverse problem for the stress fields internal to the particles that satisfy the patterns seen in photoelastic images. This is a formidable task to carry out for large collections of particles. Hence, we chose a simpler approach in which we calibrated the mean force applied to a particle to the gradient of the image intensity associated with that particle. Specifically, we determine the mean force vs. , where is the integral of the square magnitude of the gradient of the image intensity, integrated over a particle. The justification for this approach is contained in [12, 19].
We then carried out a series of experiments with the following general approach. We created nearly vertical stacks of particles that were supported very slightly by a vertical glass plate. With this arrangement, the friction force between particles and the plate was tiny. Necessarily, this approach caused some gravitational gradients in the sample, which we removed during the subtraction process described next. Typical sample sizes contained roughly 1000 particles and the sample was usually about twice as wide as it was deep. Each experiment then consisted in the following: (1) a sample was prepared as above; (2) images with and without polarizer in place were obtained; (3) a point force was applied and a third image was obtained; (4) the point force was removed and a fourth image was obtained to see if there were shifts in the positions of the particles. Generally, we rejected an experiment if there were shifts in the particles positions between the first and fourth images. We then took the difference between the images with polarizers in places with and without the applied force.
This then yielded an experimental approximation to the response function. It is not a priori manifest that there is a linear regime available in these experiments. However, we were able to identify such a regime in all cases, and we restricted our observations to this linear regime. An additional point is the fact that for any given set of macroscopic conditions, such as types of particles, friction, etc. any given realization was unique, as shown in figure 1. Only by obtaining an ensemble of responses was it possible to generate the mean response function. Throughout these experiments, we generated ensembles of typically 50 different realizations for each set of conditions. These data also yielded information on the variance of the distribution, and hence the range of local outcomes that one might expect for a given experiment. In these experiments, we considered a variety of different conditions. Specifically, we considered ordered hexagonal and square packing, for which we varied the particle friction coefficient and we considered completely disordered packing of pentagons. In the last case, we considered controlled amounts of disorder through bi-disperse packing of disks. In most of these experiments, we considered weakly compressed states (compressed due to gravity) and in one set of experiments, we explored the effect of modest amounts of shear.
Here, we focus on only two issues, namely the role played by spatial order within the sample, and the effect of modest shear on force transmission. The effect of order is highlighted by parts (a) and (b) of figure 2. The left side of this figure shows the force response in a spatially order hexagonal packing of particles, and the middle panel shows data for pentagons. In the ordered case, transmission occurs chiefly along the lattice directions of the packing, with some friction-dependent widening with depth. This is consistent with the general predictions of anisotropic elasticity [13, 21, 22, 23] but experimental limitations could not rule out predictions of hyperbolic models for a weakly disordered system [24]. The case of the pentagons shows a single peak that broadens linearly with depth, consistent with an elastic-like picture. The linear broadening with depth is not consistent with a diffusive-like model, such as the -model [25, 26]. The right panel of this figure shows the response to a normal force applied to a sample that has been subjected to a simple shear deformation. The shear sets up a strong network of force chains that align along a direction of . Indeed, along this direction, a force-force correlation function suggests long-range ordering, limited here by the sample size. And, interestingly, the force response is most strongly refocused to a direction of about with respect to the vertical direction.
In these experiments, we exploited the power of birefringence in polymeric materials, to directly show the decisive influence of local granular organization on the macroscopic mechanical properties of a granular piling. As evidenced by the mean response to a localized force, this method reveals a connection between local symmetries of the contact forces and macroscopic anisotropy. On the other hand, the birefringence method is restricted to 2D. Thus, it is important to see whether the effects displayed in 2D would persist for a more conventional granular packing such as sand. This is the purpose of the following section.
2 Three-dimensional experiments
A priori, the assessment of the stress response to a small localized force in 3D is a challenging experimental question. First, there is no easy way to directly probe stresses in the bulk. Second, the direct estimation of stresses at the boundaries, especially the bottom boundary, puts us in a situation where the measured stress signal would always be overwhelmed by the hydrostatic pressure. The method that we employ here to determine the small force response in the large hydrostatic background is based on a lock-in detection of the stress response to a slightly modulated signal added to the main localized force. This turns out to be extremely sensitive and able to discriminate the response part of the signal [11, 20]. We also checked explicitly that the responses obtained are restricted to a linear regime.
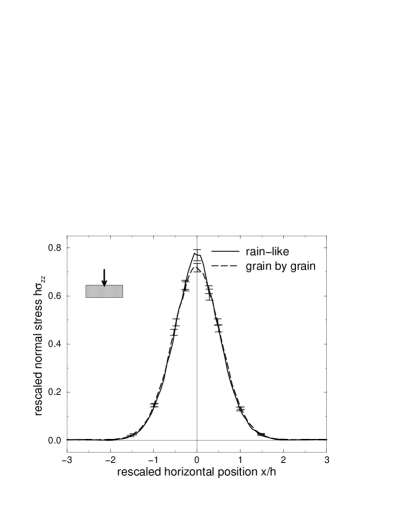
An interesting test of our method is provided by the study of a model elastic material such as gelatine with a known Poisson ratio . It is first important to note that the necessary presence of boundaries for all practical purpose is an element that needs to be considered explicitly in an elastic analysis. In the case of the stress profiles of an isotropic semi-infinite slab, the response function is solely dependent on the spatial dimensions but this nice property is lost for finite depth elastic layers. For example, boundary roughness and Poisson ratio appear directly in the isotropic elasticity solution [20]. The gelatine results are plotted on figure 3. The data have been rescaled by the thickness, , of the layer and by the amplitude of the extra force. The comparison to isotropic elasticity is excellent. Note, however, that the sensitivity of the response to the exact value of the Poisson coefficient is not particularly high; for instance, solutions with and show very similar shapes.
We now turn to response functions obtained with different preparations of Fontainebleau sand (m). To date, we have tested granular assemblies using the four following preparation methods: (i) a loose packing, (ii) a dense packing, both cases having the direction of gravity as a symmetry axis [20], (iii) a sheared granular assembly and, (iv) an horizontal slab prepared using successive avalanches [27]. We present in figures 4 and 5 cases (i), (ii) and (iii). In all situations a linear elastic-like rescaling of the response with depth was obtained – the scaling here refers to the fact that elastic stress fields have the form ( in 3D, in 2D).
Except for case (i), the predictions of isotropic elasticity are more or less inconsistent with our experimental results. For instance, the dense packing prepared by successive compression of deposited layers gives a response which is far too wide to be well fitted by such a model. For preparations obtained either in a shearing box or by avalanches – cases (iii) and (iv) – a shift of the response maximum with respect to the vertical direction below the applied force is present. It directly attests to the presence of an anisotropic medium with a symmetry axis other than the vertical direction. From all these data, as in 2D, we conclude the existence of a macroscopic anisotropy induced by the pile preparation. Similar conclusion could be drawn for 3D response functions experiments [28, 29] or simulations and calculations performed on highly symmetrical crystalline packing [13, 30, 31, 32, 33].
Recently, there have been attempts to describe granular assemblies using orthotropic elasticity [21, 27], where the direction of larger compression is taken as the stiff direction and thus the main symmetry axis of the model. This approach can provide a good qualitative account of all the experimental results but the number of parameters involved is too high to provide a decisive interpretation. Therefore, there is a crucial need to measure other quantities based on the response function method, such as shear stresses or responses to a non-vertical force as in [19]. This is also the object of a numerical study in the following section. A large collection of these experimental data can provide severe tests of any proposed mechanical modelling of granular assemblies under quasistatic deformation. We pursue this issue further via a numerical study which we discuss in the following section.
3 Numerical simulations
In order to complement the experimental data presented above, we performed extensive 2D simulations of various grain packings obtained with different preparation methods. The control of all the parameters of the simulations as well as the ability to measure both micro (grain size) and macro (system size) quantities ensures a useful feedback to the experiments. In addition, a numerical approach allows an easier exploration of a larger range of preparation procedures. Similar numerical studies have been recently carried out, either on granular packings [34, 35] or on amorphous elastic bodies such as Lennard-Jones particles [36].
3.1 Simulation model and parameters
The system consists of a set of polydisperse discs, with random radii homogeneously distributed between and . This system is simulated using a discrete element method – molecular dynamics (MD) with a third order predictor-corrector scheme [37]. The rheology of contacts is that of Kelvin-Voigt. All grains interact via a linear elastic law and Coulomb friction when they are in contact. The normal contact force is related to the normal apparent interpenetration of the contact as , where is a normal stiffness coefficient ( if a contact is present, if there is no contact). Note that this linear behaviour is consistent with Hertz law for discs. The tangential component of the contact force is proportional to the tangential elastic relative displacement, with a tangential stiffness coefficient . The Coulomb condition requires an incremental evaluation of every time step, which leads to some amount of slip each time one of the equalities is imposed. A normal viscous component opposing the relative normal motion of any pair of grains in contact is also added to the elastic force to obtain a critical damping of the dynamics. We chose a value for both the static and dynamic friction coefficients between the grains. All grains can be considered as quite rigid, , where is a dimensionless parameter which expresses the level of contact deformation and where is a pressure related to the weight of grains assembly. The ratio was set to or [38]. The bottom of the system is a horizontal line of similar but fixed grains, with intergranular distances chosen in order to avoid grains escaping from the system. We use horizontally periodic boundary conditions. Finally, we have carried out simulations on eight different samples of particles.
We considered two different system preparations. The first is a rain-like (RL) procedure where all grains are initially placed at the nodes of a to aspect ratio grid. When the deposition starts, all the constraints are removed at the same time, letting the particles settle down under gravity with random initial velocities. In the second preparation scheme, each grain is deposited individually (grain by grain, or GG) with no initial velocity, by choosing a random initial position in contact with a grain already present at the outer surface. The next particle is deposited after 100 MD time steps if all grains already present have at least one contact. The equilibrium criteria consists of the five following tests which are applied after each period of MD time steps: (1) the number of gained/lost contacts between particles during this period is zero, (2) similarly, the number of sliding contacts is also zero, (3) the integrated force measured at the bottom of the layer is equal to the sum of the weight of all the grains within a minimal tolerance, (4) all the particles have formed at least two contacts, and (5) the total kinetic energy is lower than some low threshold.

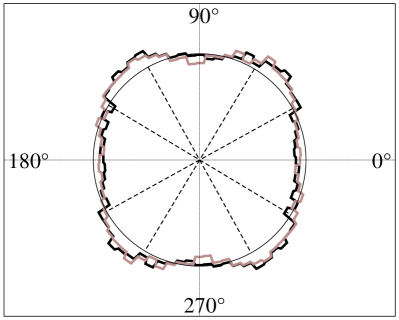
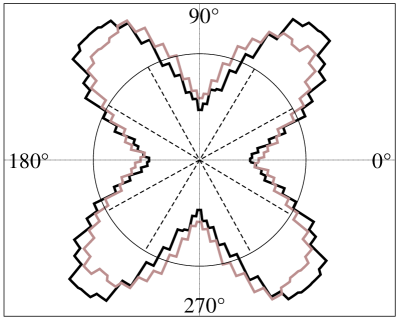
We then carried out a microscopic characterization of the deposited layers and computed such quantities as the contact and force angle distributions. These are plotted in polar representation in figure 6. It is striking to see the difference between the two plots: the first one is close to a circle (quasi-isotropic distribution) whereas the second one shows four distinct lobes. Similar features have been observed experimentally by Calvetti et al. [39] on a Schneebeli assembly [40] prepared using something like the GG procedure, and also by Radjai et al. [41, 42, 43] with discrete element method simulations (Contact Dynamics). In the same vein, Geng et al. [44] found that a raining procedure for building 2D heaps of photoelastic particles resulted in more nearly axisymmetric distributions of contacts than did a point-source pouring method. Interestingly, in these latter experiments, the underlying symmetry was hexagonal rather than square. At the system size level, the difference is less impressive: we have computed the solid fraction and found and respectively. The average numbers of contacts per grain, , are also rather close: and .
3.2 The response function
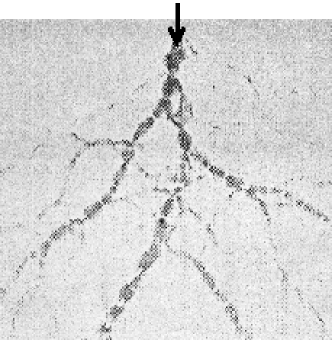
After the deposition procedure converges to a static equilibrium, which typically takes MD time steps, an additional force localized on a single grain is added at the top of the layer. Its value is typically of the order of a few times the weight of a grain. As we emphasize below, can be either vertical or inclined at a . This force is applied progressively over MD time steps, and we checked that this overloading does not lead to important rearrangements of the packing. More precisely, no contacts are either broken or created, and the few observed sliding events do not push the response out of a linear and reversible regime. Figure 7 shows a map of the contact forces in response to this extra force – the force network before the overloading was subtracted. In order to get the averaged stress response function, several tens of such independent overloads were performed on assemblies of particles. The stress components and are measured at the bottom of the system in the following manner. Like the experimental pressure probe of size , the stress component at position is obtained as the sum over the -components of the forces exerted on the bottom grains located at horizontal distances between and from the overload point. This sum is divided by the coarse graining length, , and by the number of samples . It is also normalized by the force . Finally:
| (1) |
We checked that this procedure yields results consistent with a more general definition of the stress tensor [13, 22, 45, 46, 47]. We note that the stress components become independent of the coarse graining length only when is large enough compared to the mean grain diameter [47]. Here we used , which is about the crossover value.
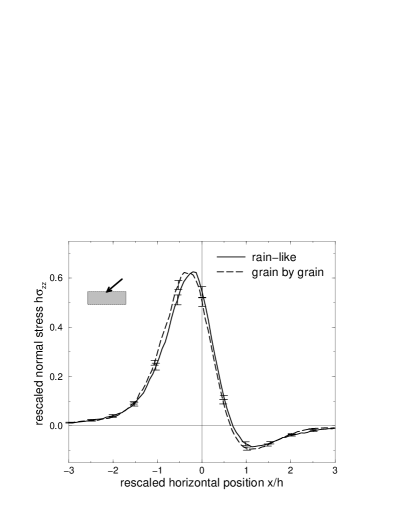

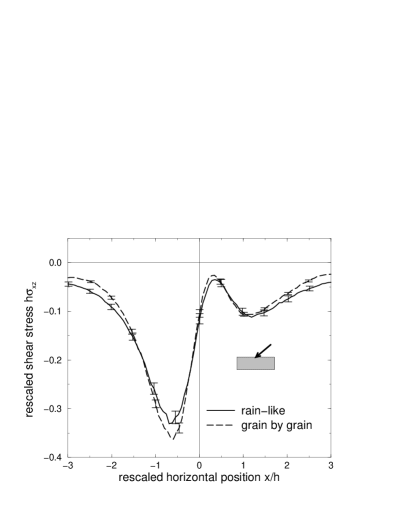
Figures 8 and 9 show the different stress response profiles. They exhibit a single broad peak. Although not shown here, and in accordance with the experimental data presented in the previous sections, these profiles also scale linearly with the layer thickness. The profiles measured from the RL or the GG procedures are distinct but close. Interestingly, the difference between the two preparations is much more visible on the plots. In particular, the amplitude of the shear maximum is typically larger in the more anisotropic case (GG).
3.3 Comparison with isotropic elasticity
As in the loose and dense cases of the previous section, both rain-like and grain-by-grain preparations have the vertical axis as an axis of symmetry. It is not clear a priori that any piling obtained under such conditions would ever be isotropic. From a microscopic point of view, an inspection of the contact distribution (figure 6) suggests that that the RL procedure is more likely to yield an isotropic effective medium than the GG deposition procedure. The question is how much are the texture properties reflected in macroscopic features. Here, we simply try to adjust the stress response functions predicted by a isotropic elasticity, and we seek to identify which features of these functions would be most sensitive for identifying a departure from isotropy.
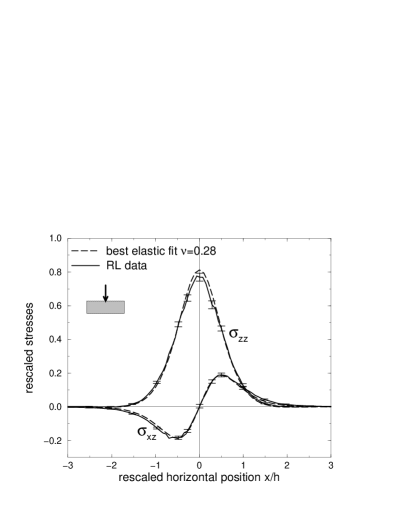
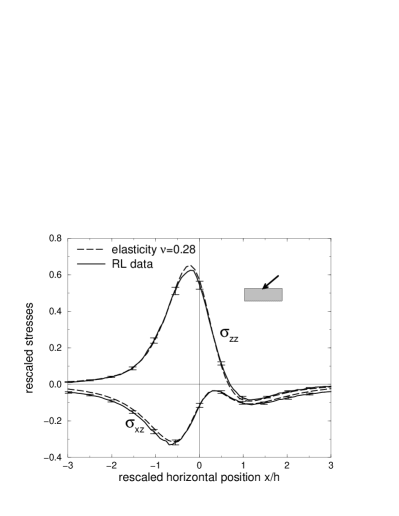
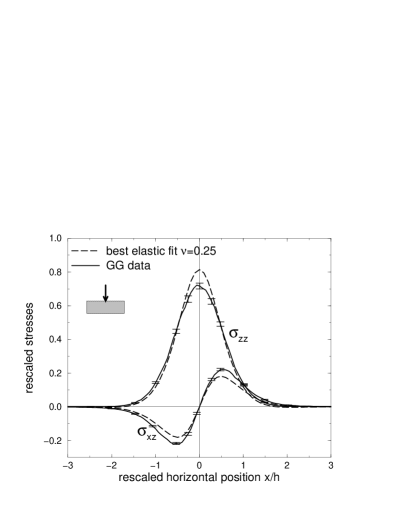
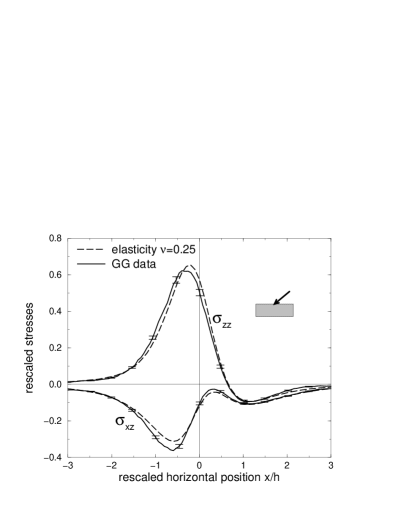
In the same vein as the experiments discussed above, [20], we performed fits of the numerical profiles by minimizing the quadratic distance between the data and the theoretical predictions, including the weight of the uncertainties. Recall that the fitting parameter is the Poisson coefficient . As shown in figure 10, the RL profiles can be well reproduced with (best fit) when the extra force is vertical. This value of the Poisson ratio also fits well the stresses in response to an overload inclined at . In the case of the GG preparation (figure 11), the best fit of the stress responses to a vertical () is not as well adjusted to the numerical data. The discrepancy between isotropic elasticity and the GG data is also clearly visible for the inclined situation. Using a range of directions for the applied extra force provides a good test to identify a medium showing weak anisotropy such as occurs for preparations under gravity.
4 Discussion and conclusion
Here we presented a summary of recent results based on the measurement of stress responses to localized forces. These results are basically consistent with an elastic description. We have shown experimentally for 2D model granular assemblies and for 3D sand piles that the response function is a useful probe of constitutive properties of the granular material. Indeed, this type of probe is a non intrusive method that could replace or supplement standard acoustic techniques, since it is well adapted to weakly cohesive material under low confining pressures where sound propagation methods are more difficult to implement.
We have shown that the response function is sensitive to small differences in the preparation history and also that its shape may change significantly after a quasi-static deformation. Using numerical simulations, we associate these macroscopic differences to different microscopic features which appear in the angular distribution of contacts. Nevertheless, exactly how these features would quantitatively emerge at the macroscopic level and how they are likely to change due to an external loading path is still a challenging and unanswered question.
Finally, we propose a new path of systematic measurements where the normal and shear stress profiles are obtained for various directions of the applied localized force. A collection of such data would yield crucial information on the structure evolution for a given loading history and, therefore, provide a severe test of any model such as anisotropic elasticity models.
We thank C. Goldenberg, I. Goldhirsch, J. Jenkins, S. Luding and J. Snoeijer for fruitful discussions. A.P.F. Atman’s present address is Departamento de Física, Instituto de Ciências Exatas, Universidade Federal de Minas Gerais, C.P. 702, 30123-970, Belo Horizonte, MG, Brazil. P. Brunet’s present address is Royal Institute of Technology – Department of Mechanics, 10044 Stockholm, Sweden. The LPMMH is UMR 7636 of the CNRS. The work of RPB was supported by NSF grants DMR-0137119 and DMS-0204677.
References
- [1] For a broad perspective see: The focus issue on the physics of granular media of the Comptes-Rendus de l’Académie des Sciences, Physique 3, pp 129-245 (2002); the focus issue on granular materials of Chaos 9, pp 509-696 (1999); Physics of Dry Granular Media, H.J. Herrmann, J.-P. Hovi, and S. Luding editors, NATO ASI Series, Kluwer, (1997); Powders and Grains 97, R.P. Behringer and J.T. Jenkins editors, Balkema, (1997); H.M. Jaeger, S.R. Nagel, and R.P. Behringer, Rev. Mod. Phys. 68, 1259 (1996).
- [2] J. Šmíd and J. Novosad, Pressure distribution under heaped bulk solids, Proc. Powtech. Conference 1981, Ind. Chem. Eng. Symp. 63, D3V 1 (1981).
- [3] R. Brockbank, J.M. Huntley and R.C. Ball, Contact force distribution beneath a three dimensional granular pile, J. Phys. (France) II 7, 1521 (1997).
- [4] L. Vanel, D.W. Howell, D. Clark, R.P. Behringer and E. Clément, Memories in sand: experimental tests of construction history on stress distributions under sandpiles, Phys. Rev. E 60, R5040 (1999).
- [5] M.E. Cates, J.P. Wittmer, J.-P. Bouchaud and P. Claudin, Jamming, force chains and fragile matter, Phys. Rev. Lett. 81, 1841 (1998).
- [6] M.E. Cates, J.P. Wittmer, P. Claudin and J.-P. Bouchaud, Development of stresses in cohesionless poured sand Phil. Trans. R. Soc. London A 356, 2535 (1998).
- [7] S. Savage, Modeling and granular material boundary value problems, in ‘Physics of dry granular media’, H.J. Herrmann, S. Luding and J.P Hovi Editors, NATO ASI series, Kluver Amsterdam, 25 (1998).
- [8] J.-P. Bouchaud, M.E. Cates and P. Claudin, Stress distribution in granular media and nonlinear wave equation, J. Phys. (France) I 5, 639 (1995).
- [9] J.P. Wittmer, P. Claudin, M.E. Cates and J.-P. Bouchaud, An explanation for the central stress minimum in sandpiles, Nature 382, 336 (1996).
- [10] J.P. Wittmer, M.E. Cates and P. Claudin, Stress propagation and arching in static sandpiles, J. Phys. (France) I 7, 39 (1997).
- [11] G. Reydellet and E. Clément, Green’s function probe of a static granular piling, Phys. Rev. Lett 86, 3308 (2001).
- [12] J. Geng, D. Howell, E. Longhi, R. P. Behringer, G. Reydellet, L. Vanel, E. Cl ment and S. Luding, Footprints in sand: the response of a granular material to local perturbations, Phys. Rev. Lett. 87, 035506 (2001).
- [13] C. Goldenberg and I. Goldhirsch, Force chains, microelasticity and macroelasticity, Phys. Rev. Lett. 89, 084302 (2002).
- [14] J.-N. Roux, Geometric origin of mechanical properties of granular materials, Phys. Rev. E 61, 6802 (2000).
- [15] D.A. Head, A.V. Tkachenko and T.A. Witten, Robust propagation direction of stresses in a minimal granular packing, Eur. Phys. J. E 6, 99 (2001); see also the comment of J.-N. Roux, Eur. Phys. J. E 7, 297 (2002).
- [16] R.C. Ball and R. Blumenfeld, Stress field in granular systems: loop forces and potential formulation, Phys. Rev. Lett. 88, 115505 (2002).
- [17] C.F. Moukarzel, Random multiplicative processes and the response functions of granular packings, J. Phys. Condens. Matter 14, 2379 (2002).
- [18] A. Kasahara and H. Nakanishi, Isostaticity and mechanical response of two-dimensional granular piles, cond-mat/0405169.
- [19] J. Geng, G. Reydellet, E. Clément and R.P. Behringer, Green’s function measurements of force transmission in 2D granular materials, Physica D 182, 274 (2003).
- [20] D. Serero, G. Reydellet, P. Claudin, E. Clément and D. Levine, Stress response function of a granular layer: quantitative comparison between experiments and isotropic elasticity, Eur. Phys. J. E 6, 169 (2001).
- [21] M. Otto, J.-P. Bouchaud, P. Claudin and J.E.S. Socolar, Anisotropy in granular media: classical elasticity and directed force chain network, Phys. Rev. E 67, 031302 (2003).
- [22] C. Goldenberg and I. Goldhirsch, Small and large scale granular statics, Granular Matter 6, 87 (2004).
- [23] C. Gay and R. da Silveira, Anisotropic elastic theory of preloaded granular media, Europhys. Lett. 68, 51 (2004).
- [24] P. Claudin, J.-P. Bouchaud, M.E. Cates and J.P. Wittmer, Models of stress fluctuations in granular media, Phys. Rev. E 57, pp 4441-4457 (1998).
- [25] C.-h. Liu, S.R. Nagel, D.A. Schecter, S.N. Coppersmith, S. Majumdar, O. Narayan, and T.A. Witten, Force fluctuations in bead packs, Science 269, 513 (1995).
- [26] S.N. Coppersmith, C.-h. Liu, S. Majumdar, O. Narayam and T.A. Witten, Model for force fluctuations in bead packs, Phys. Rev. E 53, 4673 (1996).
- [27] A.P.F. Atman, P. Brunet, G. Reydellet, P. Claudin, E. Clément and R.P.Behringer, From the stress response function (back) to the sandpile ‘dip’, To appear in Eur. Phys. J. E, cond-mat/0501118.
- [28] N.W. Mueggenburg, H.M. Jaeger and S.R. Nagel, Stress transmission through three-dimensional ordered granular arrays, Phys. Rev. E 66, 031304 (2002).
- [29] M.J. Spannuth, N.W. Mueggenburg, H.M. Jaeger and S.R. Nagel, Stress transmission through three-dimensional granular crystals with stacking faults, cond-mat/0308580.
- [30] L. Breton, P. Claudin, E. Clément and J.-D. Zucker, Stress response function of a two-dimensional ordered packing of frictional beads, Europhys. Lett. 60, 813 (2002).
- [31] S. Ostojic and D. Panja, Response of a hexagonal granular packing under a localized external force, J. Stat. Mech. P01011 (2005); Response of a hexagonal granular packing under a localized external force: exact results, cond-mat/0409160.
- [32] R. da Silveira, G. Vidalenc and C. Gay Stress propagation in two dimensional frictional granular matter, cond-mat/0208214.
- [33] C. Goldenberg and I. Goldhirsch, Friction enhances elasticity in granular solids, preprint (2004).
- [34] J.-J. Moreau, in the proceedings of the colloque ‘Physique et mécanique des matériaux granulaires’, Champs-sur-Marne (France), 199 (2000).
- [35] N. Gland, P. Wang and H.A. Makse, Numerical study of the stress response of dense granular packings, preprint (2004).
- [36] F. Leonforte, A. Tanguy, J.P. Wittmer and J.-L. Barrat, Continuum limit of amorphous elastic bodies II: Linear response to a point source force, Phys. Rev. B 70, 014203 (2004).
- [37] M.P. Allen and D.J. Tildesley, Computer simulation of liquids, Oxford University Press, Oxford (1987).
- [38] S. Schäfer, S. Dippel and D.E. Wolf, Forces schemes in simulations of granular materials, J. physique (France) I 6, 5 (1996).
- [39] F. Calvetti, G. Combe and J. Lanier, Experimental micromechanical analysis of a 2D granular material: relation between structure evolution and loading path, Mech. Coh. Frict. Materials 2, 121 (1997).
- [40] G. Schneebeli, Une analogie mécanique pour les terres sans cohésion, Comptes Rendus de l’Académie des Sciences 243, 125 (1956).
- [41] F. Radjai, D. Wolf, M. Jean and J.-J. Moreau, Bimodal character of stress transmission in granular packings, Phys. Rev. Lett. 80, 225 (1998).
- [42] F. Radjai, S. Roux and J.-J. Moreau, Contact forces in a granular packing, Chaos 9, 544 (1999).
- [43] F. Radjai, H. Troadec, and S. Roux, Micro-statistical features of cohesionless granular media, Italian Geotechnical Journal 3, 39 (2003).
- [44] J. Geng, E. Longhi, R.P. Behringer and D.W. Howell, Memory in two-dimensional heap experiments, Phys. Rev. E 64, 060301(R) (2001).
- [45] J. Christoffersen, M.M. Mehrabadi and S. Nemat-Nasser, A micromechanical description of granular material behaviour, J. Applied Mechanics 48, 339 (1981).
- [46] L. Rothenburg and A.P.S. Selvadurai, A micromechanical definition of the Cauchy stress tensor for particulate media, Proc. Int. Symp. Mechanical Behaviour of Structured Media, 469 (1981).
- [47] C. Goldenberg and I. Goldhirsch, On the microscopic foundations of elasticity, Eur. Phys. J. E 9, 245 (2002).