Electron spin coherence in Si/SiGe quantum wells
Abstract
The mechanisms limiting the spin coherence time of electrons are of great importance for spintronics. We present electron spin resonance (ESR) and transport measurements of six different two dimensional electron gases in silicon/silicon-germanium (Si/SiGe 2DEGs). The spin decoherence time is presented in conjunction with the 2DEG density and momentum scattering time as measured from transport experiments. A pronounced dependence of on the orientation of the applied magnetic field with respect to 2DEG layer is found which is not consistent with that expected from any mechanism described in the literature.
Spin decoherence mechanisms are of fundamental importance to spintronics. Silicon is an excellent model system for studies of decoherence, and electron spins in silicon have long coherence times, making them particularly attractive for applications. The electron spin coherence time for phosphorus-bound donor electrons in isotopically pure 28Si has been measured to be as long as 14 ms at 7K, and extrapolates to on the order of 60 ms for an isolated spin Tyryshkin et al. (2003a). Loss and DiVincenzo Loss and DiVincenzo (1998) proposed the use of spins of single electrons as quantum bits, and Kane Kane (1998) has discussed the advantages of working in silicon. Vrijen and Yablonovitch et al. Vrijen et al. (2000) have extended that approach to include donor bound electrons in silicon-germanium heterostructures, and schemes have been proposed for electron spin-based quantum computation in silicon-germanium electron quantum dots Levy (2001); Friesen et al. (2003).
There have been only a few studies examining the spin coherence time of silicon/silicon-germanium two dimensional electron gases (Si/SiGe 2DEGs) Tyryshkin et al. (2003b); Wilamowski et al. (2002); Wilamowski and Jantsch (2004); Malissa et al. (2004). In this paper we provide a comprehensive treatment of six different samples, using transport measurements to extract the electron density and scattering time and ESR to measure and to provide an indication of the spin decoherence mechanism. A detailed study indicates that the dominant decoherence mechanism is strongly dependent on the orientation of the magnetic field, but it is inconsistent with the published mechanisms.
The Si/SiGe heterostructures are grown by ultrahigh vacuum chemical vapor deposition at the University of Wisconsin - Madison and at IBM-Watson Ismail et al. (1995). The 2DEG sits near the top of a strained Si layer grown on a strain-relaxed Si1-xGex buffer layer, as shown in Figure 1(a) of reference Klein et al. (2004). Above the 2DEG is a Si1-xGex offset layer, followed by a phosphorus-doped dopant layer, and then a Si1-xGex spacer layer capped with Si at the surface. Table 1 contains details for each sample.
| Sample |
|
|
|
|
|
|
|
|
|
|
||||||||||||||||||||||
|---|---|---|---|---|---|---|---|---|---|---|---|---|---|---|---|---|---|---|---|---|---|---|---|---|---|---|---|---|---|---|---|---|
| ibm-01 | 8.0 | 0.30 | 14 | 1 | 14 | 3.5 | 4.0 | 37,300 | 4.3 | 0.6 | 1.0 | 1.6 | ||||||||||||||||||||
| uw-030827 | 10 | 0.35 | 15 | 22 | 35 | 10 | 4.8 | 90,000 | 9.7 | 0.1 | 4.7 | 38 | ||||||||||||||||||||
| uw-030903 | 10 | 0.25 | 13 | 17 | 35 | 10 | 4.3 | 86,700 | 9.4 | 0.2 | 2.1 | 13 | ||||||||||||||||||||
| uw-031121 | 10 | 0.30 | 20 | 6 | 60 | 20 | 5.4 | 38,000 | 5.0 | 0.1 | 2.0 | 25 | ||||||||||||||||||||
| uw-031124 | 10 | 0.30 | 20 | 26 | 40 | 20 | 4.7 | 63,200 | 6.9 | 0.1 | 2.0 | 18 | ||||||||||||||||||||
| uw-031203 | 10 | 0.30 | 60 | 6 | 60 | 20 | 2.6 | 17,100 | 1.8 | 0.5 | 2.3 | 10 |
Hall measurements are performed on all samples. Hall bars are etch defined and Ohmic contacts are made to the 2DEG by Au/Sb metal evaporation and annealing at 400∘C for 10 minutes. These data are used to extract the electron density and mobility, and from the mobility we derive the momentum relaxation time , an important parameter in spin relaxation via spin-orbit and related interactions. The parameters reported in Table 1 have been corrected for a small parallel conduction path using the method of Kane et al. 111The unchanging slope of the transverse resistance shows that the conductivity of the parallel conduction path is much less than the conductivity of the 2DEG, and allows us to take a limit of Kane’s expressions and extract the 2DEG mobility and electron density as well as the parallel conduction path conductivity., and in each case this correction was smaller than 1% Kane et al. (1985).
Electron spin resonance data were acquired with a Bruker ESP300E X-band spectrometer, using an Oxford Instruments ESR900 continuous flow cryostat to maintain a sample temperature of 4.2K. Magnetic field calibration and tracking was done with an ER035M NMR Gaussmeter.
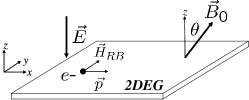
The ESR spectra for all samples were measured as a function of the orientation of the applied magnetic field, determined by the angle between the magnetic field and the growth direction of the sample (see Fig. 1). Figures 2(a) and (c) are two-dimensional maps of the ESR intensity as a function of magnetic field and orientation angle for two selected samples. The peak-to-peak ESR linewidths were extracted by fitting the lineshapes to the derivative of a Lorentzian (see insets in Fig. 2(b) and (d)). These linewidths show a pronounced dependence on the orientation angle (see Fig. 2(b) and (d)). The minimal ESR linewidth (at ) and the observed linewidth anisotropy for all samples are summarized in Table 1.222In many of the ESR data sets (e.g., the inset of Fig. 2(b)) there is a small peak near 3341 Gauss (in the region of Landé g-factor ) with no orientational dependence that is wider than the 2DEG peak. Because this peak is almost perfectly equidistant between two 42G split phosphorous peaks (not shown in the figures), we ascribe this peak to electrons in the dopant layer shared among clusters of phosphorous nuclei (see reference Feher (1959), Figures 15 and 16).
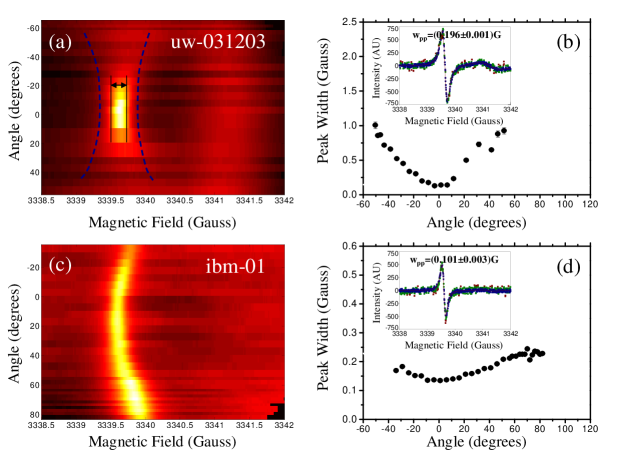
The ESR linewidth is directly related to the coherence time through the expression Poole (1996)
| (1) |
where is the Landé g-factor and is the Bohr magneton. It has been proposed Wilamowski and Jantsch (2004) that the orientation dependence of (and thus of ) in similar 2DEG structures results from a D’yakonov-Perel spin relaxation mechanism due to fluctuating Rashba fields D’yakonov and Perel’ (1972). Electrons in the quantum well leave behind positive charge on their donors, setting up an electric field that is in addition to any interface electric field. The electrons in the well on the Fermi surface move with the Fermi velocity in this electric field and therefore feel an effective magnetic field in the plane of the 2DEG (see Fig. 1). This field is called the Rashba field . Scattering of the 2D electrons results in a fluctuating field which is always in the 2DEG plane (see Fig. 1). Therefore, when the external magnetic field is applied perpendicular to the 2DEG (), the fluctuating are perpendicular to . However, when is tilted with respect to the 2DEG (), a component of the fluctuating field appears along driving decoherence more rapidly, which results in an orientational dependence of and the ESR linewidth through Eq. (1). In general, there may be other contributions to the linewidth as well, and the spin coherence time can be written as
where is the Rashba term contribution, and includes all other contributions to the linewidth (such as inhomogeneous broadening or other decoherence mechanisms).
Two groups have derived expressions for in the limit . Both can be written as
| (2) |
where for Wilamowski and Jantsch (2004) and for Tahan and Joynt (2004), is the Rashba coefficient (defined by the Hamiltonian , are the Pauli spin matrices), () is the electron (Fermi) wavevector, is the momentum relaxation time, is the angle the magnetic field makes relative to the sample growth direction, is the cyclotron frequency, and is the spin precession (Larmor) frequency Wilamowski and Jantsch (2004). The limit implies that Eq. (2) is valid only for small angles .
If is the dominant term in , then Equation 2 can be normalized as follows to obtain an expression that does not depend on the value of the Rashba parameter ,333The presumed origin of the Rashba field in these samples is charge left behind in the dopant layer and the breakdown of the effective mass approximation at the sharp quantum well interface. In general, any charge asymmetry can give rise to an electric field that would drive decoherence in the same manner. There are four different types of asymmetries: (a) bulk inversion asymmetry (BIA) due to the unit cell of the growth materials Pfeffer and Zawadzki (1999), (b) structural inversion asymmetry (SIA) due to growth structure (e.g., the location of dopants) Pfeffer and Zawadzki (1999), (c) native interface asymmetry (NIA) due to chemical bonding at the interface Olesberg et al. (2001), and (d) fluctuations in the dopant concentration Sherman (2003a). Neither (a) BIA nor (c) NIA are present in Si/SiGe heterostructures Sherman (2003b), which leaves (b) SIA and (d) dopant concentration fluctuation as the possible sources of electric fields. In our case, with an asymmetrically doped Si/SiGe quantum well, the SIA will come from the dopant layer as in (b) and (local) fluctuations in the charge density (d). Together with interface effects, these will influence the value of . but only on the momentum scattering time :
| (3) | |||||
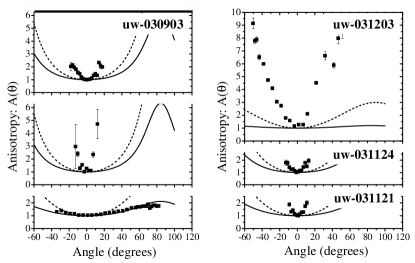
The orientational dependence of the normalized ESR linewidths for all samples and Eq. (3) (using each sample’s transport-measured ) are plotted in Fig. 3. The observed anisotropies at small angles differ substantially from those that Eq. (3) predicts. To see this quantitatively, and since this expression only applies for small , we Taylor expand Eq. (3) to
| (4) |
where the quadratic coefficient is a measure of how quickly the anisotropy increases with angle . For each sample the quadratic coefficient can be extracted from a parabolic fit (of Eq. (4)) to the data. A plot of the quadratic coefficient as a function of the parameter with the measured samples is given in Fig. 4 for both values of . For all six samples the quadratic coefficients differ substantially from both theoretical predictions. Even more striking, the maximum quadratic coefficient that Eq. (3) can give (for any value of ) is 1.07 rad-2, which is nearly an order of magnitude smaller than that observed for five of the six samples.
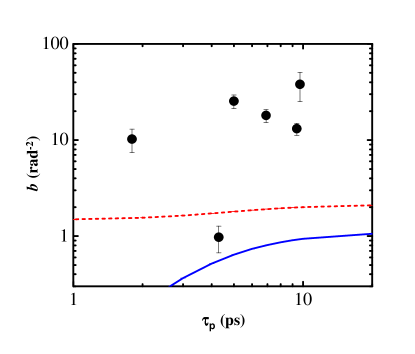
As Fig. 4 shows for these samples, the semi-classically derived does not account for the observed . A fully quantum mechanical derivation of the Rashba decoherence may be necessary, or there may be other mechanisms contributing to the linewidth through the additional component . If the latter is the case, then is necessarily orientationally-dependent, since an orientationally-independent term cannot change the functional form of the anisotropy, and so cannot affect . That is, the observed discrepancy must be due to an orientationally-dependent effect. Since silicon possesses an inverison symmetry, orientationally dependent mechanisms originating from the anti-symmetric term in the Hamiltonian introduced by Dresselhaus Dresselhaus (1955) (see references Ivchenko (1973) and Wilamowski and Jantsch (2004)) should not contribute to the linewidth. It is conceivable that the data are showing some kind of orientationally dependent inhomogeneous broadening. One way to test this would be to do pulsed EPR experiments, measuring instead of and removing the sensitivity to inhomogeneous broadening (such as the static dipole-dipole interactions with residual 29Si). The interactions to residual 29Si can also be eliminated through the use of isotopically pure 28Si in the quantum well.
In summary, we have performed a combination of ESR and transport measurements on six Si/SiGe 2DEGs and characterized the orientation dependence of the ESR linewidths. We observe an orientationally dependent spin decoherence with an anisotropy larger than any current theory predicts.
This work was supported in part by the NSA and ARDA under ARO contract number W911NF-04-1-0389, and by the National Science Foundation under Grant Nos. DMR-0325634 and DMR-0079983.
References
- Tyryshkin et al. (2003a) A. M. Tyryshkin, S. A. Lyon, A. V. Astashkin, and A. M. Raitsimring, Phys. Rev. B 68, 193207 (2003a).
- Loss and DiVincenzo (1998) D. Loss and D. P. DiVincenzo, Phys. Rev. A 57, 120 (1998).
- Kane (1998) B. E. Kane, Nature 393, 133 (1998).
- Vrijen et al. (2000) R. Vrijen, E. Yablonovitch, K. Wang, H. W. Jiang, A. Balandin, V. Roychowdhury, T. Mor, and D. DiVincenzo, Phys. Rev. A 62, 012306 (2000).
- Levy (2001) J. Levy, Phys. Rev. A 64, 052306 (2001).
- Friesen et al. (2003) M. Friesen, P. Rugheimer, D. E. Savage, M. G. Lagally, D. W. van der Weide, R. Joynt, and M. A. Eriksson, Phys. Rev. B 67, 121301(R) (2003).
- Wilamowski et al. (2002) Z. Wilamowski, W. Jantsch, H. Malissa, and U. Rössler, Phys. Rev. B 66, 195315 (2002).
- Wilamowski and Jantsch (2004) Z. Wilamowski and W. Jantsch, Phys. Rev. B 69, 035328 (2004).
- Tyryshkin et al. (2003b) A. M. Tyryshkin, S. A. Lyon, W. Jantsch, and F. Schäffler, preprint cond-mat/3004284 (2003b), URL http://xxx.lanl.gov/abs/cond-mat/0304284.
- Malissa et al. (2004) H. Malissa, W. Jantsch, M. Mühlberger, F. Schäffler, Z. Wilamowski, M. Draxler, and P. Bauer, Appl. Phys. Lett. 85, 1739 (2004).
- Ismail et al. (1995) K. Ismail, M. Arafa, K. L. Saenger, J. O. Chu, and B. S. Meyerson, Appl. Phys. Lett. 66, 1077 (1995).
- Klein et al. (2004) L. J. Klein, K. A. Slinker, J. L. Truitt, S. Goswami, K. L. M. Lewis, S. N. Coppersmith, D. W. van der Weide, M. Friesen, R. H. Blick, D. E. Savage, et al., Appl. Phys. Lett. 84, 4047 (2004).
- Kane et al. (1985) M. J. Kane, N. Apsley, D. A. Anderson, L. L. Taylor, and T. Kerr, J. Phys. C 18, 5629 (1985).
- Poole (1996) C. Poole, Electron Spin Resonance (Dover Publications, Inc., 1996), 2nd ed.
- D’yakonov and Perel’ (1972) M. D’yakonov and V. Perel’, Sov. Phys. Solid State. 13, 3023 (1972).
- Tahan and Joynt (2004) C. Tahan and R. Joynt, unpublished (2004).
- Dresselhaus (1955) G. Dresselhaus, Phys. Rev. 100, 580 (1955).
- Ivchenko (1973) E. L. Ivchenko, Sov. Phys. Solid State 15, 1048 (1973).
- Feher (1959) G. Feher, Phys. Rev. 114, 1219 (1959).
- Pfeffer and Zawadzki (1999) P. Pfeffer and W. Zawadzki, Phys. Rev. B 59, R5312 (1999).
- Olesberg et al. (2001) J. T. Olesberg, W. H. Lau, M. E. Flatté, C. Yu, E. Altunkaya, E. M. Shaw, T. C. Hasenberg, and T. F. Boggess, Phys. Rev. B 64, 201301(R) (2001).
- Sherman (2003a) E. Y. Sherman, Appl. Phys. Lett. 82, 209 (2003a).
- Sherman (2003b) E. Y. Sherman, Phys. Rev. B 67, 161303(R) (2003b).