Raman thresholds and rigid to floppy transitions in calcium silicate glasses
Abstract
Alkaline earth silicate glasses exhibit a well marked threshold in Raman lineshapes which can be related to the onset of network rigidity as the concentration of calcium oxide is decreased. The present results are analyzed by constraint counting algorithms and more deeply characterized by a size increasing cluster approximation that allows to perform Maxwell mechanical constraint counting beyond the usual mean-field treatment. This permits to discuss under which structural conditions an elastic intermediate phase can be obtained.
pacs:
61.20N-81.20PI Introduction
Magmatic liquids are the principal agents of mass and heat transfer in the Earth and terrestrial planets and intensive research has been accomplished to understand the processes of mass or energy transfer with respect to melt or structural properties r1 ; r2 . Viscosity, thermal or electrical conductivity are indeed directly related to the structure of silicate melts which furthermore control the temperature behavior of magmas and their formation or crystallization r3 ; r4 .
In this context, calcium silicates of chemical formula have received little attention as compared to the corresponding alkaline systems so that much of their properties over the whole calcium glass formation range are still object of active research. Most studies have indeed focused on the molar concentration which corresponds to the crystalline wollastonite composition r5 . Several studies have stressed the special role played by the calcium atom which acts as a modifier in the silicate networks r6 and leads to a global increase of the density from at to at the pyrosilicate composition Doremus ; Doweidar . Extensive studies have been performed to understand the miscibility limits in this system and in other alkaline earth silicates r7 ; r8 .
A special attention has been devoted to the coordination number of the calcium atom using EXAFS r9 and X-ray spectroscopy r10 . More recently, Yannopoulos and co-workers have been studying inelastic light scattering of calcium silicates around the composition by polarized Raman spectroscopy r11 . The results with composition show a marked change in behavior around calcium. Specifically, intensity ratios of particular Raman lines as well as the Boson peak frequency present a sharp jump at this concentration. On the other hand, a line at shows an abrupt increase but there remain some uncertainety about its attribution to the so-called ring line r12 . However, the conclusion obviously suggests the presence of a transition that has not been characterized by the authors.
In this work, we show from the investigation of Raman spectroscopy that a very particular elastic state is reached in the glass when the concentration of calcium equals . This threshold is identified with a rigid to floppy transition from Maxwell mechanical constraint counting and suggests that elastic transitions can take place in calcium silicate glasses as in chalcogenides r13 ; r14 . In the latter, the addition of cross-linking units such as germanium or silicon into a basic network made of two-folded chalcogenide atoms (sulphur, selenium) constraints indeed internal degrees of freedom of the network by increasing the number of bond-bending and bond-stretching forces that can lead to a very peculiar situation when the number of constraints per atom equals the number of degrees of freedom r15 . It has been identified by M.F. Thorpe from numerical simulations on amorphous silicon as being a floppy to rigid transition which is characterized by the vanishing of the number of normal (floppy) modes of the dynamical matrix r16 ; r17 . The glass transition of such systems undergoing a rigid to floppy transition is also substantially affected Naumis0 . Understanding to what extent the methods used with success for the chalcogenides can be applied to oxide glasses is therefore not only of fundamental interest but also an attractive perspective for applied purposes r18 .
We first display the results of the Raman analysis and the deconvolution of the spectra which show a marked change in behaviour for some modes at . Next, we apply on this system mean-field Maxwell mechanical constraint counting that permits to compute the concentration at which the fraction of zero frequency (floppy) modes vanishes r16 . We improve the approach in Section IV by analyzing the present system with size increasing cluster approximations (SICA) that infer the effect of medium-range order on the nature and the location of the transition which is found to be in harmony with experimental findings. Finally, we show which conditions in terms of medium range order have to be satisfied in order to obtain an intermediate self-organized phase r19 that is bounded by a rigidity and a stress transition r20 , in close correspondance with the chalcogen analog.
II Experimental results
II.1 Sample preparation
The samples were prepared by mixing pre-dried (99.99 ) and (99.95 ) powders in the correct proportions. For each sample, the mixture was melted in a platinum crucible at C for two hours, and quenched by placing the bottom of the crucible in cold water. The samples were then annealed at a temperature around for five hours and cooled slowly to room temperature. The glasses were transparent and free of crystallization as confirmed by the absence of Bragg peaks in XRD spectra. Chemical microanalysis using the energy-dispersive X-ray (EDX) performed on optically polished glasses showed a very low departure (less than 0.4 mol of Ca) between the theoretical and the real composition for all the studied samples. The glass transition temperatures were determined with a differential scanning calorimeter Setaram DSC-1600 at a heating rate . These values (see Table 1) are slightly larger than those reported by ShelbyShelby using the dilatometric technique, but they exhibit the same global trend
| Concentration | 42 | 44 | 47 | 50 | 53 |
| [] | 769 | 769 | 770 | 781 | 795 |
II.2 Raman scattering
Raman spectra were obtained on a Jobin-Yvon T64000 spectrometer, with CCD detection, and through a BX40 Olympus microscope (objective x100). The excitation wavelength was the argon line of a Coherent Innova 70 Spectrum laser. The power was typically 300mW at the laser output ( on the sample). The low-frequency part range () was obtained in triple substractive mode (gratings ). For the high frequency part (above ), the spectrometer was in simple monochromator configuration with Notch filter (grating ). This allows a sufficient recovering spectral range for merging the spectra. All the data on the different compositions were collected in exactly the same conditions, one following each other, in order to be the most confident possible in any variation between subsequent spectra.
II.3 Peak deconvolution
The experimental spectra were first corrected from first-order Bose-Einstein factor, and also from scattering law (). The latter (a second-order correction compared to Bose-Einstein factor) is not of primary importance but is theoretically needed to extract the Raman susceptibility, which is the relevant physical quantity which can be used to extract information on dynamics. The Bose Einstein reduction does not include the prefactor generally used for describing the low-frequency part of Raman spectra in glasses r24 , according to the Shuker-Gammon formalism r25 . Examination of the bare spectra shows that the main variations upon increasing content from to lie at wavenumbers above and then justify to focus attention on this spectral range, dominated by intratetrahedron or motions. The boson peak reflects order at larger distances. After this, the spectra were reconstructed with the FOCUS software Simon , by using a log-normal law for the boson peak at low frequencies, and gaussian shapes for higher frequency ones. The low-frequency (boson peak) part was fitted to insure a correct description of the mid-frequency range, due to its long tail, but is clearly out of the scope of the present paper. Moreover, recent hyperRaman measurements in silica tend to show that the Boson peak responsable for the excess density of states is directly observed in hyperRaman and inelastic X-ray scatteing, meaning that the low-frequency Raman component implies other degrees of freedom and is then much more complicated to interpret Vacher . For higher frequency modes, gaussian shapes gave a better reconstruction of the spectra than lorentzian or damped harmonic oscillator ones
III Discussion
III.1 Spectra description
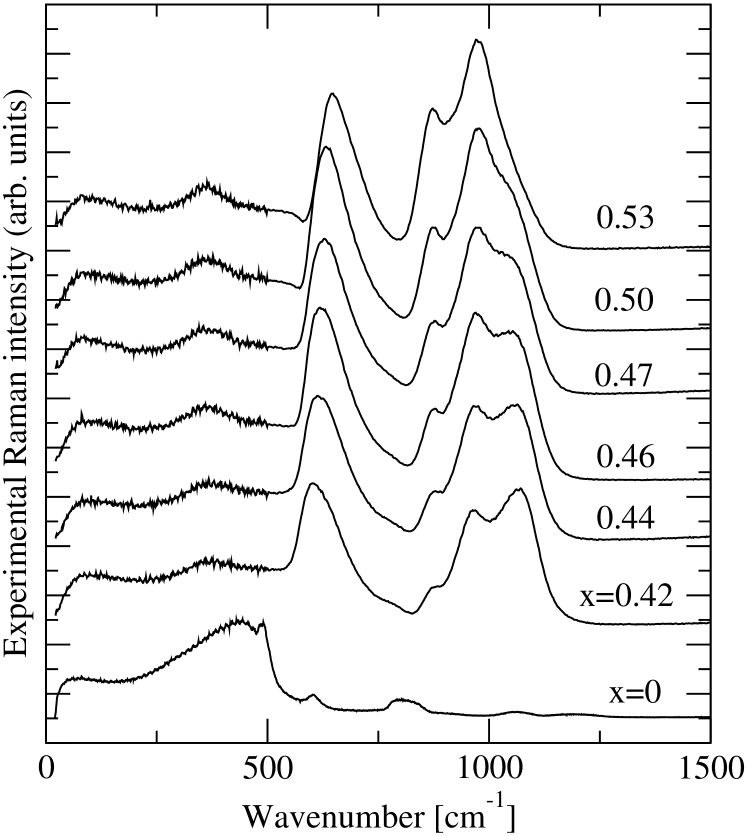
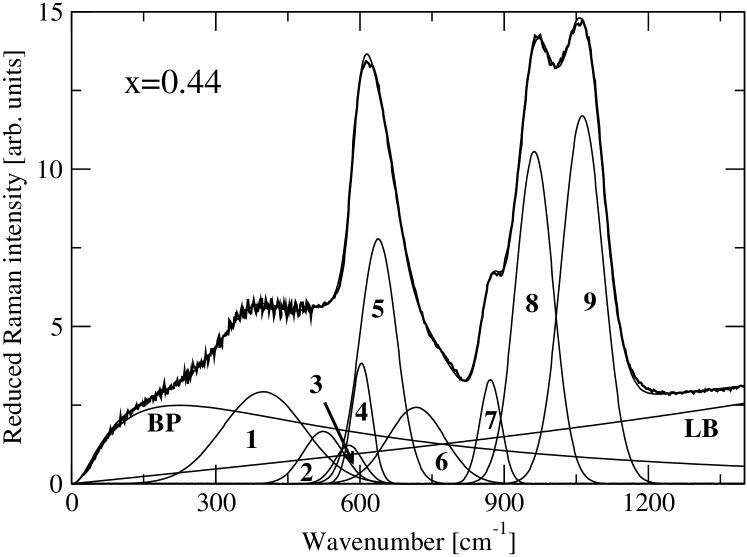
Figure 1 displays the experimental Raman data for the six concentrations to . Figure 2 exhibits the typical agreement between experimental and fitted spectra (Bose-Einstein and scattering corrected). Results of the fitting procedure are displayed in the different panels of Figure 3 and 4 (line wavenumbers, linewidths and integrated intensity). The whole concentration range was described with 9 modes (plus the boson peak) : 3 modes in the range below , 3 modes to describe the sharp and assymetric peak near , and 3 modes for the higher-frequency group around . A broad luminescence background was needed to describe the intensity increase up to high relative frequencies, a feature that can be connected with the presence of 3d impurities in the precursor.
For the group, it is sometimes described by four components, or even more. We consider that, as only three bumps are unambiguously visible on the spectra, the lowest number of components giving satisfactory reconstruction of the experimental data is the best possible choice. The four components needed by Kalampounis et al. r11 look obviously necessary on their data for and , but not in the range investigated here.
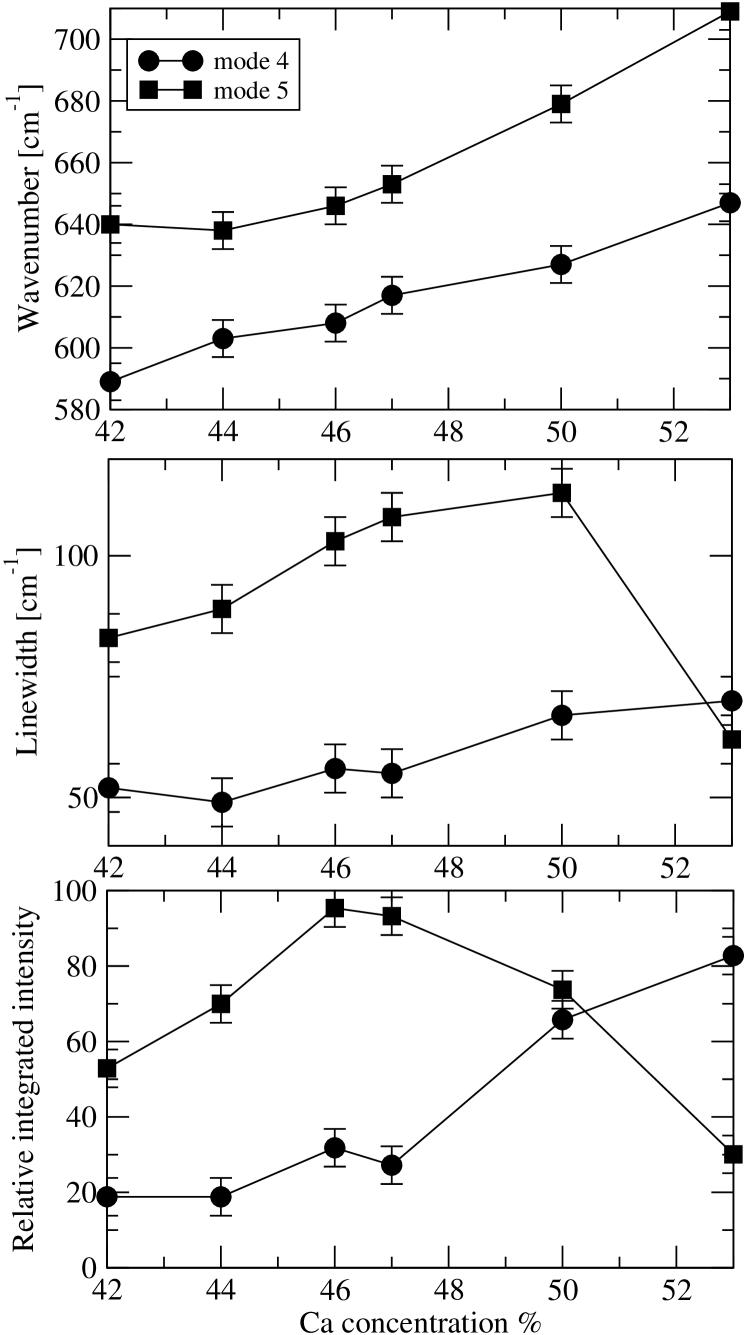
Modes 2-3 are somewhat weak and large, and then are rather inaccurate (at least compared to other ones) as their possible parameter variation in the range is hindered by experimental uncertainty. Mode 1 is discussed below. For the following modes and , the accuracy is better. Both wavenumbers monotonously increase upon increasing concentration (see Figure 3). Their intensities show a transfer from to somewhat above . For linewidths, mode smoothly broadens whereas mode suddenly narrows above . The greater effects concern the higher frequency modes, , , and . One can first consider the latter three modes, clearly connected in one broad band. This assignement slightly differs from r11 , where mode 7 is assigned to species, and from Frantz and Mysen Mysen where corresponds to a weaker mode and mode 8 is assigned to Si-bonding oxygen stretching vibrations. The superscript in denotes the number of bridging oxygens (not connected to Ca) on a tetrahedron.According to Zotov Zotov , mode can be assigned to species, mode to and mode to . The wavenumbers for modes and are practically constant. It is not the case of their intensities, which show a continuous increase for modes and , whereas mode is rather constant up to , and decreases rapidly after. The wavenumber of mode displays a decrease up to around , and then a slight increase. This effect is small but clearly larger than experimental error. One can note that the sum of intensities of modes and is roughly constant above this value (Figure 4). For linewidths, modes and are slightly increasing, whereas mode is constant up to , and shortens after (slightly, but clearly above experimental error).
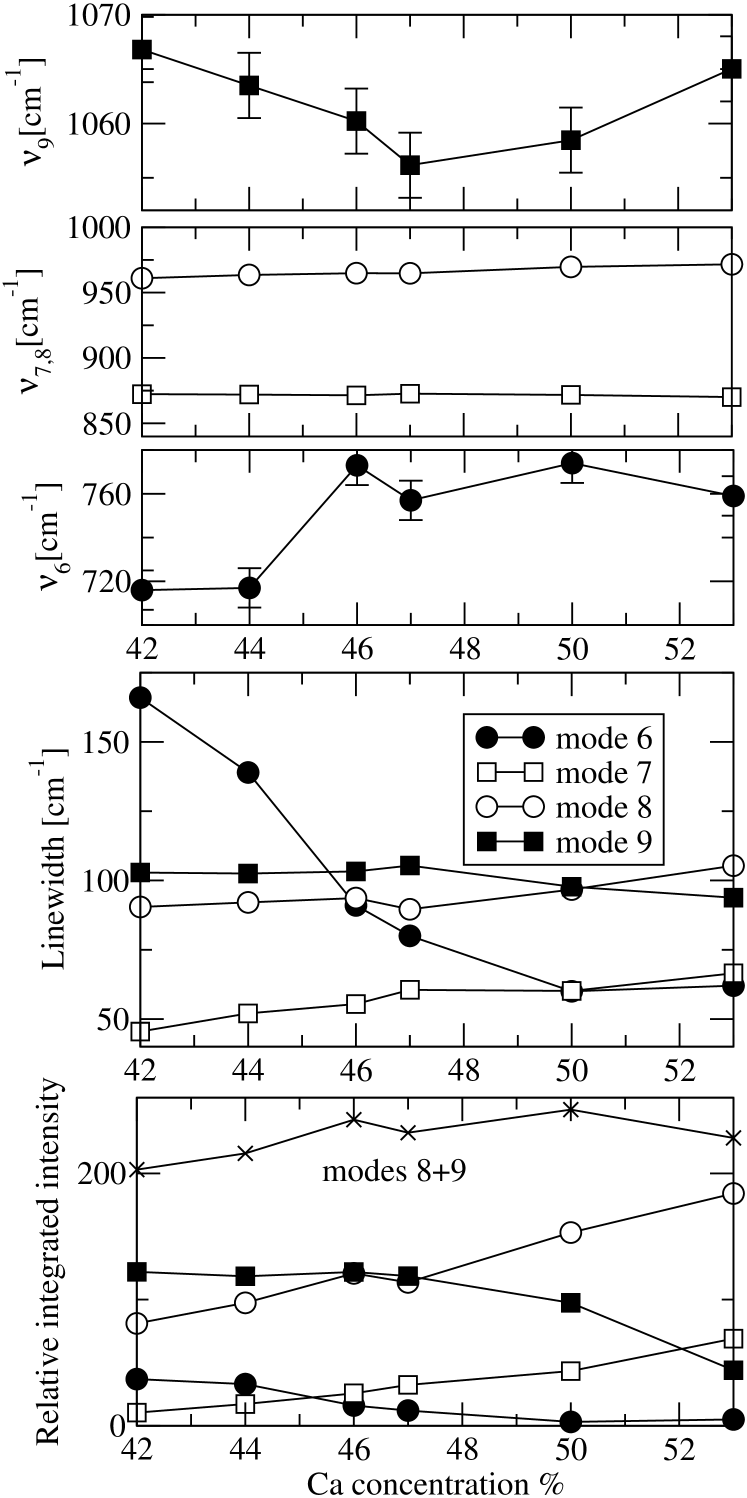
One can then conclude on this part that the increase of acts in two ways : a first one, continuous, leading to increase the number of and species, to equilibrate the higher number of cations, and a second one, sharper, which consists in a transfer from species to ones upon increasing content above . Then the remaining are more decoupled of the network, as shown by their lower linewidth.
Mode is the most affected by the modification of content as shown on Fig. 4. Its frequency is hugely increased (more than , which is considerable), the width of the line is decreased by more than a factor , between to calcium, and its integrated intensity falls down by one order of magnitude in the same concentration range. When comparing with Ref. r11 where the asymmetric component is described only by one line, the present work shows that the anomaly standing around is only due to mode 6, the other modes 4 and 5 overlapping in this component evolve monotonously in this composition range. This mode 6 cannot then be assigned to species as the corresponding intensity must increase upon enriching content. It is more plausibly connected with motions. The intensity dependence which is more rapid than for mode 9, would lead to think that mode could correspond to vibrations of species.
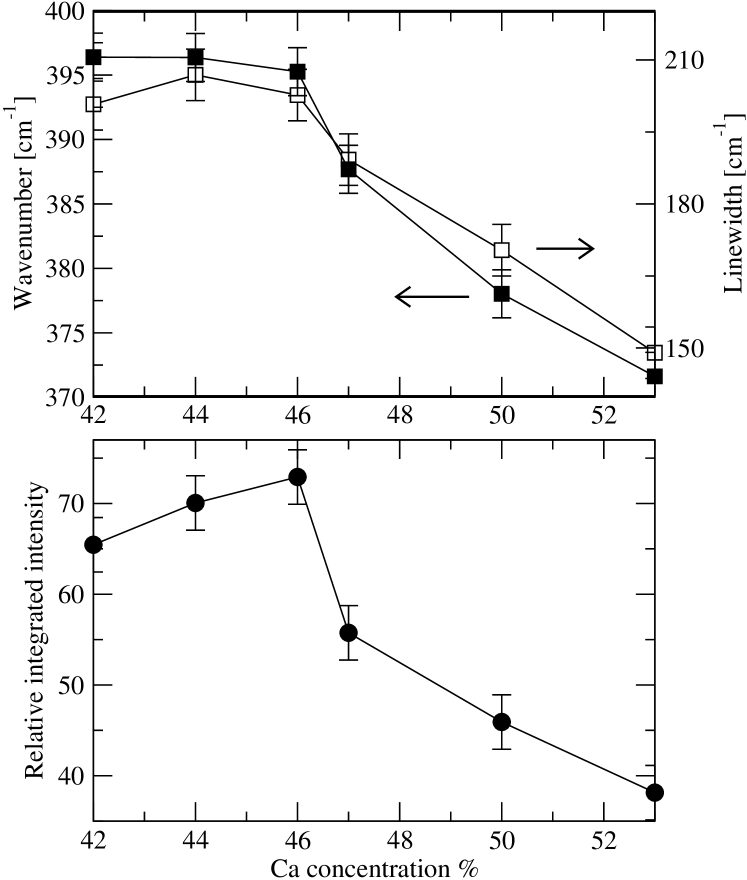
Mode 1 displays two specific features around Ca. Its frequency exhibits a noticeable downshift (), the width decreases by , and the integrated intensity falls down by a factor two (Figure 5). Even if this mode is broader than the preceding ones, these parameter evolutions are sufficiently large to be unambiguous. This frequency downshift and line narrowing upon increasing Ca content is different from high-frequency modes (6, 9). This softening and narrowing is an uncommon behavior and can be qualitatively explained only by a significant change of eigenvectors. Due to its frequency (it is the lowest-frequency mode apart from the boson peak), it implies some Ca vibrations. These vibrations would then more decoupled, and softer, above ca. , that can be attributed to floppy regions in the glass.
III.2 Raman threshold and rigid to floppy transitions
The results obtained from Raman scattering and the behaviour with concentration of some modes closely parallels the one found in chalcogenides PRB2000 . The frequency increase exhibited by modes and above calcium can indeed be discussed in the context of rigid to floppy transitions. In fact, these modes look to harden just when the network becomes softer. This apparent contradiction can be explained by a non-uniform distribution of stress : in the stressed rigid range close to our observed threshold at , the network is mainly hardened by interconnected species. Upon undergoing a rigidity transition, these links should become much less numerous, leading to a network which is dominated by connections. The remaining islands should become somewhat decoupled from this network, producing an increase of the mode 9 wavenumber and a noticeable line narrowing : the distribution of force constants is less important, leading to a linewidth closer to a lorentzian one. In the floppy range at high calcium concentration, the structure should be a network of elements, separated by small ’harder’ islands. The narrowing exhibited by mode above can be also interpreted in the same way.
IV Analysis from constraint theory
Maxwell constraints counting appears to be useful to understand the present results as the calcium silicate network can be described by a molecular system constrained by bond-stretching and bond-bending (angular) forces.
IV.1 Maxwell global constraint counting
We consider the system as a network of atoms composed of atoms that are fold coordinated. Enumeration of mechanical constraints r15 -r17 associated with bond-stretching (radial) forces leads to , while the number of bond-bending (angular) constraints is . The average number of floppy modes per atom in this three-dimensional network is given byr17 :
| (1) |
where is the dimension of the network and . Applied to the system of interest leads to:
| (2) |
The latter equation holds if one assumes that silicon is four-fold, calcium and oxygen are two-fold coordinated RKJCP . As one can see, the number of floppy modes vanishes when the network attains the critical concentration which is in close agreement with the thresholds observed from our Raman results.
Equation (2) defines a mean-field transition in which the number of mechanical constraints is computed from the macroscopic concentration . Obviously, this elastic transition may be attained at provided that some macroscopic floppy subregions can emerge with the addition of alkaline earth oxide. On the other hand, it has been recently shown r20 ,PRB2003 that the underlying nature of the floppy to rigid transition was more subtle and could contain under certain circumstances r19 two transitions instead of the single one predicted by mean-fied constraint counting. In this context, stress will not spread randomly over the whole network as initially believed but will accumulate in underconstrained subregions leading to the occurence of an intermediate elastic phase that is found to be stress free. The detection of this intermediate phase has been mostly accomplished from calorimetric probes using temperature modulated differential scanning calorimetry (MDSC) r27 . Here, a sinusoidal variation is added on the usual linear DSC ramp and permits to decompose the total heat flow into a reversing part that tracks the initial modulation and a residue. The latter is found to vanish in the intermediate phase r19 .
IV.2 Cluster construction
Size increasing cluster approximations (SICA) appear to be a useful tool to describe the elastic nature of the network backbone (floppy, intermediate, stressed rigid) and permits to take into account medium-range order effects that may, or may not, serve as ingredient for the presence of an intermediate phase. Furthermore, SICA start from the mean-field description as basic level and takes into account non-random structural elements and their related mechanical constraints in a systematic fashion. This method has been first introduced to study the formation of fullerenes C60 or Penrose tilings in quasicrystals quasi and was then applied to quantify the boroxol ring statistics in amorphous Dina . Recently, SICA has been used in the context of floppy to rigid transitions PRB2003 in an archetypal chalcogenide network () and has led to the definition of a stress-free intermediate phase that depends substantially on the fraction of small rings in the structure.
The basic level () of the SICA construction corresponds to the mean-field approximation, having as elements structural species that depend directly on the macroscopic concentration. The construction permits to generate clusters at step sharing all possible combination of the basic () elements, clusters at step having three () units, etc. The probabilities of the clusters are computed within the Canonical Ensemble having energy levels related to bond creation between the basic level molecules. The construction is furthermore supposed to be performed at the formation of the network when T equals the fictive temperature which is defined by the intersection of the extrapolated supercooled liquid and glass curves Galeener . Mathematically, these probabilities will involve statistical weights (or degeneracies of a corresponding energy level) which correspond to the number of equivalent ways to connect two () basic units, and a Boltzmann factors Galeener of the form .
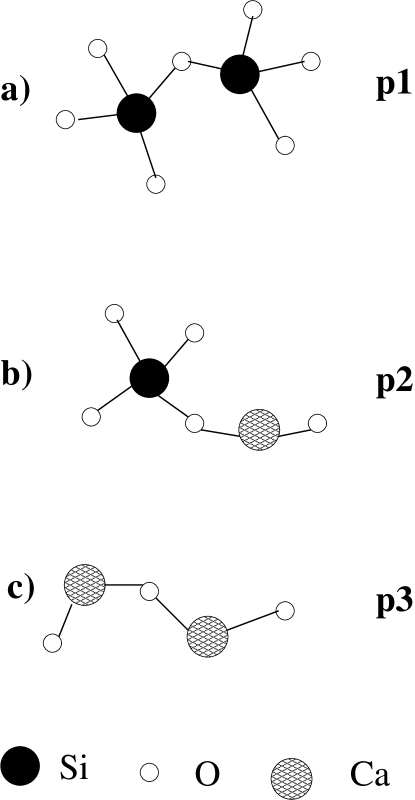
We have used as basic units the molecule and a tetrahedron, having for respective probabilities the macroscopic concentration and . The energy levels are defined from the consideration of all possible connections at the step and permit to distinguish the mechanical nature of the underlying clusters (floppy, isostatic, stressed). The creation of a chain-like floppy structure () is related to an energy gain of while the creation of a CaO connected to a silicon tetrahadron (an isostatically rigid cluster, ) is associated with an energy . Finally, the basic network former represented by two connected tetrahedra (a stressed rigid cluster, ) corresponds to an energy gain of . At step , three different clusters can be obtained (see fig. 6) and their probabilities are given below.
We mention that edge-sharing have been excluded from the construction as they have no experimental evidence at all in silicates r29 . The probabilities at setp are:
| (3) |
| (4) |
| (5) |
out of which can be computed the () concentration of calcium atoms
| (6) |
Due to the initial choice of the basic units, the energy will mostly determine the probability of isostatic clusters since the related Boltzmann factor is involved in the probability (4) of creating the isostatic cluster (a bonding). In the case where , the bonding of the network construction will be mainly achieved by isostatic clusters.
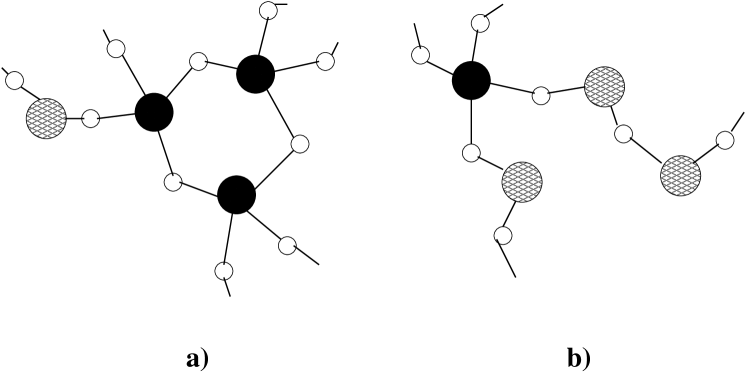
For larger steps (), one has to take care of possible isomers produced by two distinct clusters at the lower level. The cluster displayed in Fig 7a can for example be produced either by connecting two tetrahedra onto a () cluster or by adding and onto a () cluster. The statistical weight of such isomers will be of course larger than the one of low connected clusters having a single pathway of production.
As seen from equs. (3)-(5), the cluster probabilities will depend only on two energetical parameters (i.e. the factors and ) and the problem can still be reduced by using a charge conservation law Bray for the calcium atom applied on the population of clusters of size .
| (7) |
The -dependence of either or means that either the fictive temperature or the energies depend Galeener on but here only the dependence is relevant for the analysis.
In order to obtain some clusters having significant medium range order, the SICA construction has been realized up to the step .
IV.3 Maxwell cluster constraint counting
Next, one can apply on the generated set of clusters Maxwell constraint counting by enumeration of bond-bending and bond-stretching constraints and calculation of the corresponding expressions of and . Of particular importance are the structures containing a ring having less than six atoms (see Fig. 7a), because one has to remove some extra constraints r16 .
For each step has been computed the total number of constraints :
| (8) |
where is the total number of clusters of size and and are respectively the number of constraints and the number of atoms of the cluster of size with probability . Applied to the set of clusters at step , one obtains for example:
| (9) |
We have determined either or as a function of concentration, by solving the charge conservation law (7). With these factors depending on the concentration , it is possible to compute the cluster probabilities of a given step as a function of composition and finally obtain the composition where the number of floppy modes vanishes. It can be also computed the statistics of species with Ca concentration as discussed next.
V Results
V.1 Structural properties and speciation
In this section, we consider the solutions of the SICA construction in terms of structure. One principal objective of the present investigation is first to compare the model results with some experimental data on calcium silicate glasses such as the relative abundances and mixing properties of the structural units with respect to the concentration.
Figures 8 and 9 represent the distribution of units computed from SICA at step , respectively as a function of Ca concentration and as a function of the relative abundance of non-bridging oxygens NBO/T that is defined by:
| (10) |
where is the fraction of non-bridging oxygens per tetrahedra and is the concentration of species. The quantity defined by equation (10) is commonly used to quantify network depolymerization with non-bridging oxygens r30 .
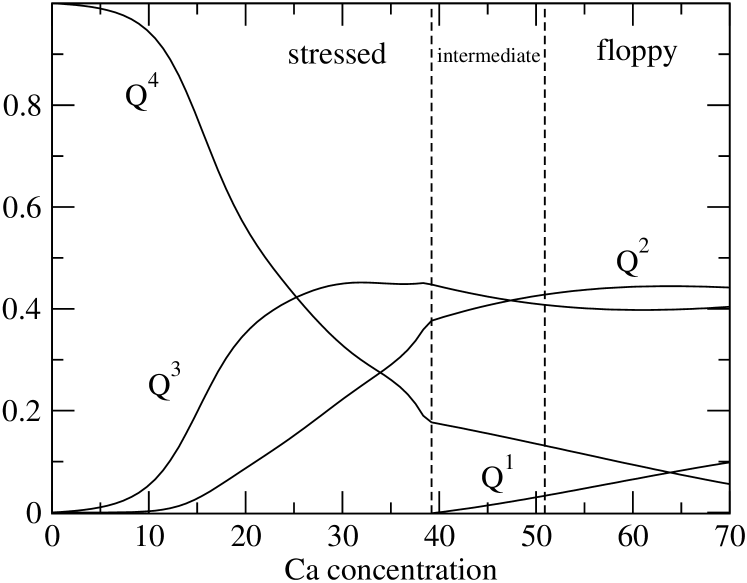
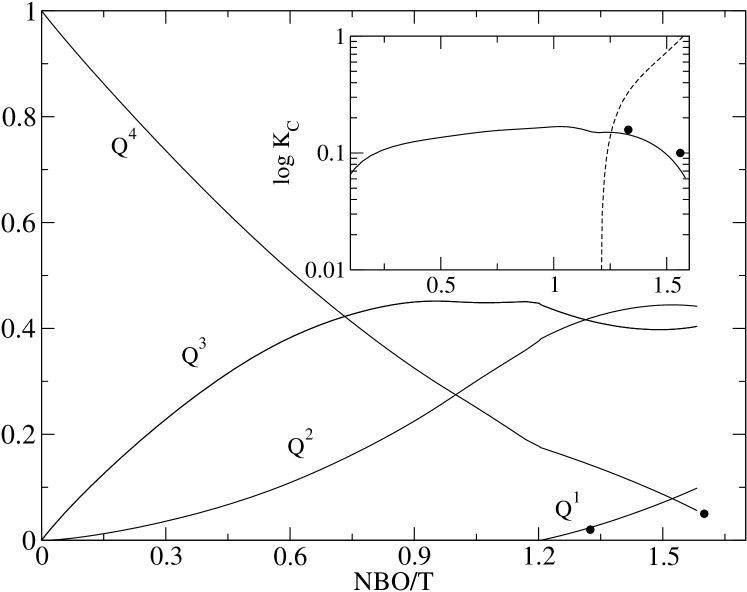
As one can see, the probability of finding a unit decreases smoothly with the addition of calcium whereas the emergence of () and () groupings is noticeable. One can furthermore remark the crossover of the abundance of and at the concentration , a behaviour that has been also observed from the integrated intensity of mode 8 and 9 in the Raman spectra.
Several limitations of the approach can however be objected. First, the fact that we limit the cluster construction to the step does not permit to generate as these species are made of a central tetrahedron that shares four Ca atoms (that structure would be created by ). As a consequence, the distribution of our () are slightly overestimated in the high calcium range. Secondly, as the energetical factors are introduced only on the basis of the overall mechanical character of the bonding type (stressed, isostatic, floppy) between two basic units, difficulties arise in order to describe the behaviour with changing alkaline earth cation as the size (or energetics, or steric hindrance,…) does not appear in this approach. This means that other ingredients RKJCP are necessary to describe the differences arising in Magnesium or Barium silicates.
Next, we can focus on equilibrium constant r31 and between species respectively related to the equilibria:
| (11) |
| (12) |
The mass action constants can be computed from the above equilibria using the computed distribution of species. It is obvious that equ.(11) will be the dominant equation in the low calcium region while both equilibria will have to be taken into account in the concentration range lying around the rigid to floppy transition when NBO/T is larger than the value . As one can see from the insert of Fig. 9, the calculated from the equilibrium constant of (11) is in fair agreement with the two data points number reported by Mysen Mysen . We note also that remains almost constant over the entire concentration range of interest suggesting that the conversion between species is not favoured in the stressed rigid side of the glass formation range. On the other hand, the rapid variation of can arise from the floppy nature of the backbone, when . The change in equilibrium constant following the underlying elastic nature of the network has been questioned by Eckert and co-workers in phosphorus chalcogenides Eckert .
V.2 Rigidity transitions from cluster probabilities
From the constraint counting applied on the set of cluster of a given size , it is possible to extract a certain number of quantities of interest in the context of rigid to floppy transitions.
The simplest case allowed in the case of the SICA construction is the case of random bonding when no selective rules are given on the energies to retain specific clusters as starting point for the next cluster generation. This means hat the cluster probabilities are only given by their statistical weights and reduces for instance the probability of a cluster (see equ. (4)) at step to:
| (13) |
or the probability of a three-membered ring at to:
| (14) |
It is found (see Table 2) that the vanishing of the number of floppy modes occurs at a somewhat higher value than the macroscopic Maxwell value of . Also, if one considers only dendritic clusters (i.e. no allowance for ring structures), the threshold is lowered for steps and . No change occurs for step as there are no rings created at this step. The lowering of for dendritic clusters arises from the fact that the stressed rigid ring structures which have a high statistical weight due to their higher connectivity, are now absent leading to a number of constraints computed from equ. (8) that is lowered.
| SICA step | 1 | 2 | 3 | 4 |
|---|---|---|---|---|
| 0.500 | 0.739 | 0.690 | 0.715 | |
| (dendritic) | 0.500 | 0.739 | 0.667 | 0.681 |
The probability of finding floppy, isostatically rigid and stressed rigid clusters can be computed for each SICA step and it is found that for dendritic clusters there is a global increase of the floppy and isostatically rigid clusters with increasing Ca concentration whereas the probability of stressed rigid clusters is continuously decreasing (see Figure 10).
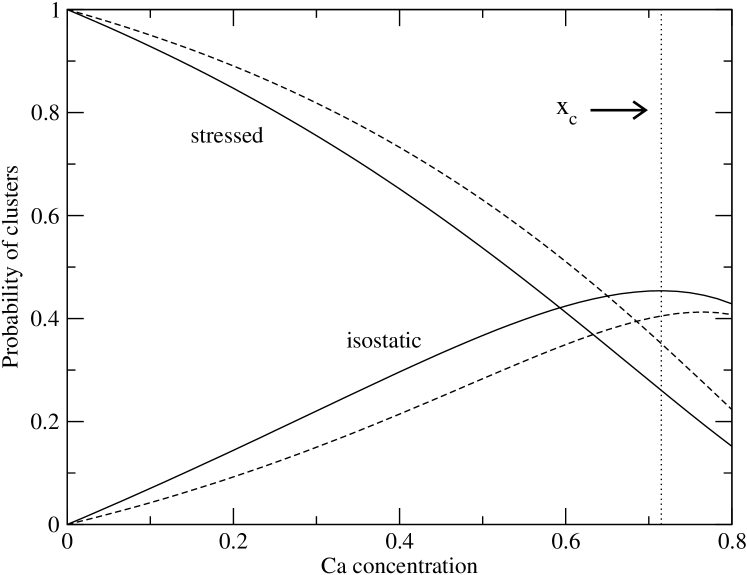
However, no threshold is observed as the one suggested by the Raman analysis and one obtains a single solution corresponding to the glass optimum point defined by the vanishing of the number of floppy modes.
V.3 Boolchand intermediate phase
We now turn to self-organization that permits to obtain an elastic intermediate phase r20 ,PRB2003 . This elastic phase has been first observed by Boolchand and co-workers in chalcogenides r19 , but as rigid to floppy transitions have been also detected in oxide glasses Science , there is no reason why this intermediate phase should not exist in the present system as well. We consider here the strutural possibilities that can lead to an intermediate phase. It is achieved with SICA by selecting the pathways of cluster production. One starts for example with a underconstrained (floppy) cluster of size which exists at high calcium concentration. Agglomeration of basic units onto this cluster is only allowed if the creation of a stressed rigid region can be avoided on the generated cluster of size . This would happen if one starts to connect two tetrahedra together, involving an energy gain of . On the other hand, if is decreased one will accumulate with this rule isostatically rigid regions on the generated clusters as the only allowed connections are either floppy or bondings. Alternatively, if one starts from the low calcium side, self-organization can be obtained by selecting along the same scheme stressed rigid and isostatically rigid connections and excluding systematically the possibility of floppy bondings in the SICA construction.
With decreasing calcium content, one will be able to maintain that rule up to a certain point beyond which connections between two silicon tetrahedra (or a stressed rigid connection) can not be avoided anymore. The latter point corresponds to a stress transition PRB2003 and appears only if some medium range order (MRO) made of rings is accepted in the construction. The concentration range bounded on its low calcium side by the stress transition and on its high calcium side by the vanishing of the number of floppy modes, defines the intermediate phase of width .
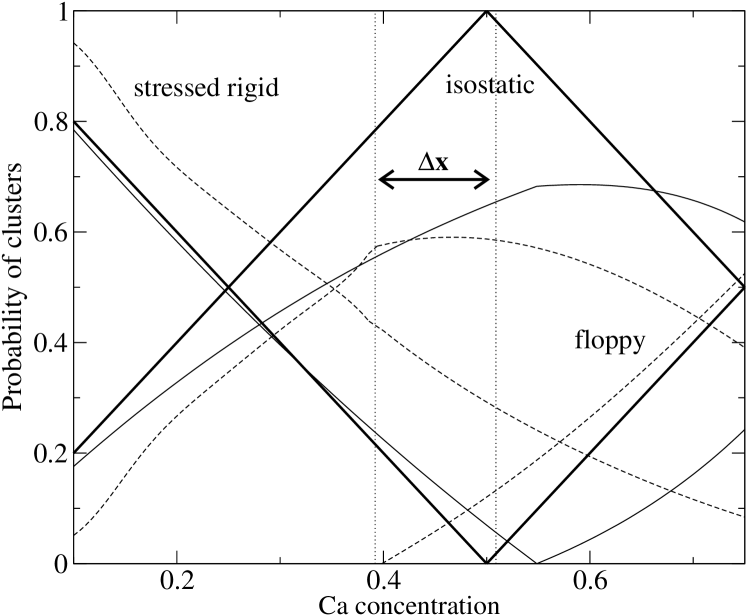
Results of self-organization are displayed in Fig. 11. The simplest case for self-organized clusters is again the case where rings are removed from the construction corresponding to dendritic clusters which would correspond in the limit to Bethe lattice solutions RBM or Random Bond Models Bethe obtained in the context of floppy to rigid transitions. We obtain here a single transition for all SICA steps either at the mean-field value or closeby ( for ). No intermediate phase is obtained. The probabilities of floppy, isostatically rigid and stressed rigid clusters can be displayed as a function of calcium content (Fig. 11) and show that the abundance of isostatically rigid clusters is maximum at the threshold defined by . This is obviously the case for the case, but also for larger SICA steps.
The intermediate phase shows up if a certain amount of medium range order (MRO) is allowed. This is realized in the SICA construction by generating in the construction ring clusters such as the one displayed in Fig. 7. The requirement of self-organization in the cluster construction still holds for dendritic stressed rigid structures made of at least two connected tetrehadra which propagate stress in the structure. But now cyclic structures such as rings are preserved from self-organization. Two transitions are obtained for every SICA steps (see Fig. 11. The first transition one lies always around the concentration calcium and corresponds to a rigidity transition where the number of floppy modes vansihes. The second transition that emerges with increasing MRO is located for at and corresponds to the stress transition. When starting from a floppy network at high calcium concentration, the progressive stiffening of the network can be accomplished by requirement of self-organization leading to the accumulation of isostatically rigid regions and stressed rigid ring structures. This will work for any decreasing up to below which stressed rigid bondings outside of ring structures can not be avoided anymore.
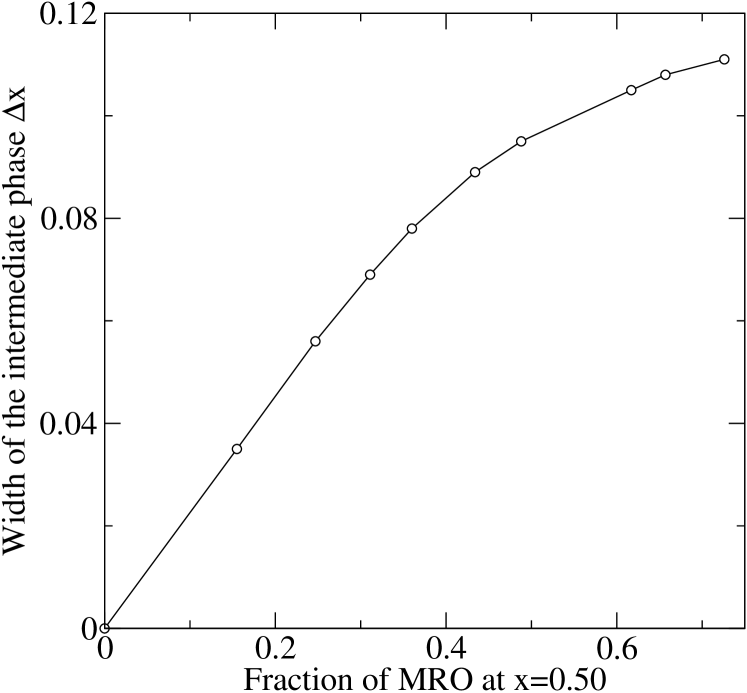
The two transitions and will define an intermediate phase that depends on the fraction of MRO allowed and we show that is anincreasing function of the MRO (Fig 12). Furthermore, as the rigidity transition at is almost not affected by the presence of MRO, the increase of the width with the latter quantity arises mostly from the decrease of with growing MRO. Finally, as seen from Fig. 11, there is kink observable at which would produce in first-order derivatives such as the energy Naumis a jump suggesting a first-order stress transition at r20 ,PRB2003 and a continuous rigidity transition at.
The elastic nature of the network can be also analyzed within this framework. Fom Fig. 11, one can see that the probability of finding isostatically rigid clusters is maximum in the window . It is equal to 1 for the SICA step and about or for the larger steps thus providing evidence that the molecular structure of the network in the window is almost stress-free.
VI Summary and conclusions
We have shown in the present work from Raman measurements that a particular transition was observed at around calcium in the calcium silicate system, in harmony with previous findings r11 . We have elucidated the origin of the observed threshold as being the manifestation of a global softening of the glass structure that signals ultimately in a rigid to floppy transition. Constraint counting algorithms applied on size increasing clusters permit to refine the picture by predicting the possibility of an intermediate phase in the Raman threshold region.
Recent calorimetric and spectroscopic studies have shown that this kind of elastic transitions could be found in alkaline silicates as well, with a well-defined signature of the intermediate phase in both sodium Vaills2004 and potassium glasses unpub . We are confident that a similar generic behaviour should be expected in the alkaline earth silicate glasses. A definite probe of the existence of the intermediate phase in the present system could be obtained using MDSC measurements during the glass transition. The results present always a vanishing of the kinetic dependent heat flow inside that phase r19 and provide an unambigous signature for both transitions, rigidity and stress. Unfortunately, the glass transition temperatures of calcium silicates are too high to be accepted from the actual performances of the MDSC apparatusMDSC .
ACKNOWLEDGMENTS
Discussion and comments with P. Boolchand are gratefully acknowledged. We thank Emmanule Veron for the EDX analysis and Boris Robert for help during the cours of this work. LPTL is Unité Mixte de Recherche du CNRS n. 7600. CRMHT is Unité Propre du CNRS n. 4212.
References
- (1) Chemical Fundamentals of Geology, R. Gill, Kluwer Academic, N.Y. 1996
- (2) Structure, Dynamics and properties of silicate melts, Ed. J.F. Stebbins, P. McMillan, D. Dingwell, Review in Mineralogy 32, Mineral. Soc. Am. Washington D.C. 1995.
- (3) F.A. Seifert, B.O. Mysen and D. Virgo, Geochim. Cosmochim. Acta 45, 1879 (1981)
- (4) L. Grànàsy, T. Wang and P.F. James, J. Chem. Phys. 108, 7317 (1998)
- (5) V. Swamy and L. S. Dubrovinsky, Geochim. Cosmochim. Acta 61, 1181 (1997)
- (6) J.B. Murdoch, J.F. Stebbins and I.S.E. Carmichaël, Am. Mineral. 70, 32 (1985)
- (7) N.B. Basal, R.H.Doremus, Handbook of Glass Properties, Academic Press, New York, 1990
- (8) H. Doweidar, J. Non-Cryst.Solids 249, 194 (1999)
- (9) S.S. Kim and T. H. Sanders Jr., J. Am. Ceram. Soc. 82, 1901 (1999)
- (10) V. R. Mastelaro, E.D. Zanotto, N. Lequeux and R. Cortès, J. Non-Cryst. Solids 262, 191 (2000)
- (11) T. Taniguchi, M. Okuno and T. Matsumoto, J. Non-Cryst. Solids 211, 56 (1997)
- (12) T. Taniguchi, M. Okuno and T. Matsumoto, Mineral. J. 17, 341 (1995)
- (13) A.G. Kalampounias, G.N. Papatheodorou and S.N. Yannopoulos, J. Non-Cryst. Solids 322, 35 (2003)
- (14) A.E. Geissberger and F.L. Galeener, Phys. Rev. B28, 3266 (1983)
- (15) W. Bresser, P. Boolchand and P. Suranyi, Phys. Rev. Lett. 56, 2493 (1986)
- (16) R. Böhmer and C.A. Angell, Phys. rev. B45, 1091 (1992)
- (17) J.C. Phillips, J. Non-Cryst. Solids 34, 153 (1979)
- (18) M.F. Thorpe, J. Non-Cryst. Solids 57, 355 (1983)
- (19) H. He and M.F. Thorpe, Phys. Rev. Lett. 54, 2107 (1985)
- (20) A. Huerta and G.G. Naumis, Phys. Rev. Lett. 90, 145701 (2003); J. Non-Cryst. Solids 329, 100 (2003)
- (21) see Insulating and Semiconducting Glasses, P. Boolchand Ed., World Scientific, 2000
- (22) P. Boolchand, D.G. Georgiev and B. Goodman, J. OptoElec. Adv. Mater. 3, 703 (2001)
- (23) M.F. Thorpe, D.J. Jacobs, M.V. Chubynsky and J.C. Phillips, J. Non-Cryst. Solids 266-269, 859 (2000)
- (24) J.E. Shelby, J. Appl. Phys. 50, 8010 (1979)
- (25) F.L. Galeener, A.J. Leadbetter and M.W. Stringfellow, Phys. Rev. B27, 1052 (1983)
- (26) R. Shuker and R.W. Gammon, Phys. Rev. Lett. 25, 222 (1970)
- (27) D. De Sousa-Meneses, J.F. Brun, P. Echegut and P. Simon, Appl. Spectrosc. 58, 969 (2004)
- (28) B. Hehlen, E. Courtens, A. Yamanaka and K. Inoue, J. Non-Cryst. Solids 307-310, 87 (2002); B. Hehlen, E. Courtens, R. Vacher, A. Yamanaka, M. Kataoka and K. Inoue, Phys. Rev. Lett. 84, 5355 (2000).
- (29) J.D. Frantz and B.O. Mysen, Chem. Geol. 121, 155 (1995)
- (30) N. Zotov, J. Non-Cryst. Solids 287, 231 (2001)
- (31) D. Selvenathan, W. Bresser and P. Boolchand, Phys. Rev. B61, 15061 (2000)
- (32) R. Kerner and J.C. Phillips, Solid State Comm. 117, 47 (2000)
- (33) M. Micoulaut, J.C. Phillips, Phys. Rev. B67, 104204 (2003)
- (34) X. Feng, W. Bresser and P. Boolchand, Phys. Rev. Lett. 78, 4422 (1997)
- (35) R. Kerner, K. Penson and K.H. Bennemann, Europhys. Lett. 19, 363 (1992)
- (36) R. Kerner and D.M. dos Santos-Loff, Phys. Rev. B37, 3881 (1988)
- (37) M. Micoulaut, R. Kerner and D.M. dos Santos-Loff, J. Phys. Cond. Matt. 7, 8035 (1995)
- (38) F.L. Galeener, D.B. Kerwin, A.J. Miller and J.C. Mikkelsen Jr., Phys. Rev. B47, 7760 (1993)
- (39) A.C. Wright, G. Etherington, J.A. Derwin-Desa, R.N. Sinclair, G.A.N. Connell and J.C. Mikkelsen, J. Non-Cryst. Solids 49, 63 (1982)
- (40) P.J. Bray, S.A. Feller, G.E. Jellison and Y.H. Yun, J. Non-Cryst. Solids 38-39, 93 (1980).
- (41) K.S. Mills, ISIJ Intern. 33, 148 (1993)
- (42) B.O. Mysen, Structure and Properties of Silicate Melts, Elsevier, Amsterdam, 1988
- (43) R. Maxwell and H. Eckert, J. Am. Ceram. Soc. 116, 682 (1994). In glasses, onset of rigidity appears for phosphorus. See D.G. Georgiev, P. Boolchand, H. Eckert, M. Micoulaut and K.A. Jackson, Europhys. lett. 62, 49 (2003)
- (44) M. Zhang and P. Boolchand, Science 266, 1355 (1994)
- (45) M.F. Thorpe, D.J. Jacobs and N.V. Chubynsky, Rigidity Theory and Applications, Kluwer Academic/ Plenum Press, New York, 1999
- (46) D.J. Jacobs and M.F. Thorpe, Phys. Rev. Lett. 80, 5451 (1998)
- (47) G.G. Naumis, Phys. Rev. B62, R9205 (2000)
- (48) Y. Vaills, T. Qu, M. Micoulaut, F. Chaimbault and P. Boolchand, cond-mat/0406509
- (49) F. Chaimbault, M. Micoulaut, Y. Vaills, P. Boolchand, unpublished
- (50) http://www.tainst.com