Inherent Relation between Nernst Signal and Nodal Quasiparticle Transport in Pseudogap Region of Underdoped High Temperature Superconductors
Abstract
In-plane Nernst signal and resistivity have been measured for three single crystals (x=0.09, 0.11 and 0.145) with the magnetic field parallel to c-axis. A quadratic temperature dependence of resistivity, i.e., is observed below a certain temperature . It is found that the upper boundary of the Nernst signal coincides with , which points to an inherent relation between the anomalous Nernst signal and the nodal quasiparticle transport in the pseudogap region. Finally a phase diagram together with the pseudogap temperature is presented, which suggests a second energy scale in the pseudogap region.
pacs:
74.25.Dw, 74.25.Fy, 74.72.DnOne of the core issues in high temperature superconductors is the origin of a pseudogap above in underdoped region. In order to understand the physics behind the pseudogap, many models have been proposed, such as resonating valence bond (RVB)RVB theory, spin fluctuationSpinFluc , preformed Cooper pairsEmery , charge stripesEmeryKivelson , d-density wave (DDW)Chakravarty ; Affleck , etc. Among many of them, the pseudogap state has been considered as a precursor to the superconducting state. In this precursor state, Cooper pairs have already formed before the long range phase coherence (or Bose-Einstein like condensation) is established. Measurements on the high frequency complex conductivity illustrate that a short-life phase coherence can persist up to about 30 K above and these data can be described by the dynamics of thermally generated topological defects (free vortices)Corson . The Princeton group found that a significant in-plane Nernst signalXuZA appears in the pseudogap region with H c. This may be understood by the phase-slip due to the thermal drifting of vortex-like excitations. However, it remains unknown how does this strong Nernst signal relate to the nodal quasiparticles which are supposed to dominate the in-plane transport properties in low temperature region. In this Letter we present the evidence for an inherent relation between the Nernst signal and nodal quasiparticle transport: The upper boundary temperature of Nernst signal is found to coincide very well with a crossover temperature below which a quadratic temperature dependence of resistivity is observed. Possible reasons are given to explain this coincidence.
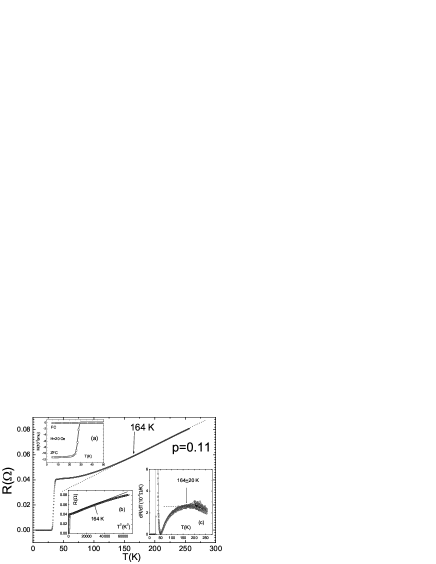
The single crystals measured in this work were prepared by travelling solvent floating-zone technique. Samples with three different doping concentrations p=0.09(=24.4K, as grown, x=0.09), 0.11(=29.3K, as grown, x=0.11), 0.145(=36.1K, nominal x=0.15) have been investigated. The quality of our samples has been characterized by x-ray diffraction, and data showing a narrow transition 2 K. For some samples, the full width at the half maximum (FWHM) of the rocking curve of (008) peak is only 0.10∘ZhouFang . The samples have also been checked by AC and DC magnetization and resistive measurements. Inset(a) of Fig.1 shows a typical curve of the diamagnetic transition of sample measured at .
The resistivity was measured by using standard four-point technique. For measuring the Nernst effect we adopted the one-heater-two-thermometer technique. A heating power of 2 mW is applied to one end of the single crystal and two tiny thermometers with distance of 1.5 mm are attached to the sample for measuring the temperatures along the heat flow (longitudinal) direction. The Nernst voltage is measured through two contacts on two opposite planes at the symmetric positions. Very small contacting resistance () has been achieved by using silver paste. All samples are shaped into a bar structure with dimensions of (length) 1 mm (width) 0.5 mm (thickness). All measurements are based on an Oxford cryogenic system ( Maglab-12 ) with temperature fluctuation less than 0.04% and magnetic fields up to 12 T. During the measurement for Nernst signal the magnetic field is applied parallel to and swept between 7 to -7 T and the Nernst signal is obtained by subtracting the positive field value with the negative one in order to remove the Faraday signal during sweeping the field and the possible thermal electric power due to asymmetric contacts. The Nernst voltage is measured by a Keithley 182-Nanovoltmeter with a resolution of about 5 nV in present case. In this paper we show the Nernst signal , where with the distance between the two contacts for Nernst voltage, is the temperature gradient along the heat flow direction.
Fig.1 shows the temperature dependence of resistivity for sample (as a typical example). One can see that a quasi-linear behavior is observed above a characteristic temperature at about . It is necessary to note that this quasi-linear part (as marked by the dotted line) is different from the linear part above which is about for . Below the resistivity deviates from the linear behavior. In Fig.1(b) we present vs. . One can see that below about , the curve posses a linear behavior which indicates a relation of . In order to determine with higher accuracy, we present in Fig.1(c) the derivative of resistivity vs. , it is evident that at about the derivative starts to drop down showing a crossover from a quasi-linear behavior (above ) to a quadratic behavior below . Similar features are observed for other two samples ( and ). Note that Ando et al.AndoT2 recently reported that the relation in low temperature region for underdoped La-214 and Y-123 systems, and proposed that this behavior is characteristic of the nodal quasiparticles on the so-called Fermi arcs. It is found also by these authors that increases towards more underdoping.
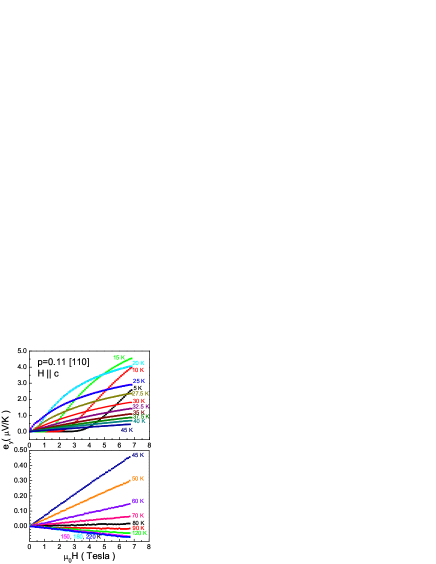
Fig.2 presents the Nernst signal of sample with thermal stream along [110] direction (the sample was cut with the longitudinal direction along [110]) and at temperatures from to . In order to show the reliability of the measurement, we repeated the measurements at , and after a 2-day delay. One can see that the two sets of data for each temperature coincide very well showing a high reproducibility. In low temperature region, the Nernst signal is dominated by the motion of Abrikorsov vortices. One can easily see that the background when the vortices are freezed (see data at in low field region) is actually precisely zero. This is contrasted by the slight negative background at high temperatures (above ). As first discovered by the Princeton groupXuZA and later checked by usWenHHNernst , a strong in-plane Nernst signal can be measurable far above (here = 29.3 K for ). Here it shows the same case. When is above , the signal becomes negative and gradually it approaches a background with a negative slope. And when is above about the Nernst signal does not change anymore with , therefore it is reasonable to define a upper boundary for the Nernst signal which locates in the region of for sample with thermal flow direction along [110].
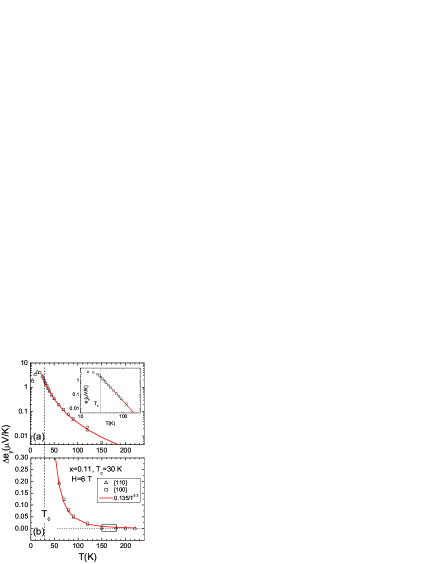
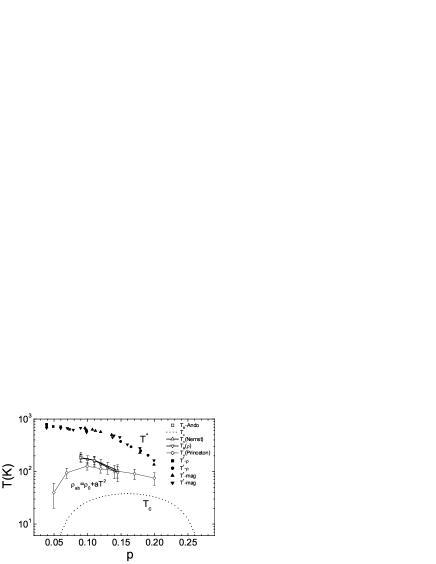
In Fig.3 the Nernst signal from both samples ( along [110] and [100]) at 6 T is shown vs. T. The red (solid) curve is an empirical relation which describes the data very well up to about and a deviation from this behavior with a faster dropping rate occurs above about . It is thus safe to conclude that the Nernst signal vanishes in the region of to as marked by a rectangular in Fig.3(b). Surprisingly this upper boundary temperature of Nernst signal coincides rather well with the crossover temperature as mentioned above. For sample () we have measured on two specimens, one with the heat stream along [100] and another one along [110]. The results on these two samples turn out to be almost identical (as shown by open squares and triangles in Fig.3). Then we checked for other two samples with doping =0.09,0.145 and found that this coincidence of and is true also for them. From the recent published data of Ando et al.AndoT2 the has also been determined and shown together with our data in Fig.4. It is clear that the data from both groups overlap each other. In Fig.4 we also present the doping dependence of given by the Princeton group. In the very underdoped region, according to Ando et al.AndoT2 , the crossover of resistivity occurs at higher temperatures. For example, at , is about . However the upper boundary of Nernst signal is obscured by both the small Nernst signal and strong thermal power in very underdoped region. Therefore we don’t know whether this coincidence holds still for very underdoped samples. If taking a fixed value which is determined by the resolution of the voltmeter as a criterion for the Nernst signal, according to the recent data of the Princeton groupWangYYPRB , the Nernst upper boundary temperature will drop down in very underdoped region. Despite the uncertainty in determining the value of , in the doping region of our samples (), the data are not far from that of the Princeton group.
In the following we will try to understand the coincidence of and in the intermediate doping region based on several possible pictures. We first discuss the scenario of vortices. It is known that the in-plane resistivity normally reflects the dynamics of the nodal quasiparticles, while the Nernst signal is induced by the thermal drifting of vortices as suggested by the Princeton group, therefore it seems difficult to relate one and another. However one way to understand this point is that the nodal quasiparticles partially form Cooper pairs and induce a precursor superconducting state which has strong phase fluctuation with vortices as one of the important excitations. Therefore below this specific temperature the Nernst signal which senses the vortex motion starts to appear and the temperature dependence of resistivity changes behavior (due to probably the reduction of the effective charge carriers). As a partial support to this picture, it was shown that this strong in-plane Nernst signal may be explained by the superconducting fluctuation which has the Kosterlitz-Thouless vortex-anti-vortex pairs as the topological excitationsUssishkin . The second picture close to this vortex scenario is based on the bosonic RVBWengZY which predicts the co-existence of spinon vortices and quasiparticles below and the Nernst signal is induced by the motion of these spinon vortices. This picture naturally predicts a second energy scale ( or ) and different type of vortices below and above (still lacking of experimental evidence for the spinon vortices). However both pictures are facing a common difficulty: No any trace of vortex (or spinon vortex) flow resistivity has been reported far above . One explanation to this point would be that the resistivity induced by quasiparticle scattering is overwhelmingly larger than the flux flow resistivity. Meanwhile it remains to be understood why the temperature dependence of resistivity should be precisely quadratic. Two close relatives of the picture based on vortices are the one with a mixture of composite charge carriersKim ; Levin or the pair density wave (PDW)ZhangSCPDW (coexistence of Cooper pairs and free electrons below ). The paired electrons tend to localize and the rest free electrons contribute to the electrical conductivity. According to Ando et al.AndoT2 , the relation may not be simply due to the scattering rate of the nodal quasipartcles since the effective charge carrier density changes with temperature even below . A naive explanation for in this region would be that the nodal quasiparticle density (roughly proportional to the length of Fermi arcNorman or the electronic specific heat coefficient Loram ) drops down linearly with , but the scattering rate of nodal quasiparticles with features close to Dirac fermions is proportional to . One more possibility for the coincidence of and relies on a exotic picture that some kind of unconventional charge density wave (UCDW)Maki occurs at . Below or the quasiparticle spectrum on top of this UCDW will contribute a strong Nernst signal, while the nodal quasiparticles are responsible for the in-plane resistivity, thus both the in-plane Nernst signal and resistivity will certainly correlate each other. This picture needs both theoretical justification and experimental evidence, especially a recent calculation seems ruling out the D-density wave as one of the possible causesDDWUssishkin . Since the Nernst signal is detectable only below , it may have no direct relation with the ”flat band” near as observed by ARPES since it influences the transport properties only at high temperaturesFlatband . The coincidence of and found in our experiment strongly suggests an inherent relation between the Nernst signal and the nodal quasiparticle transport. This may also imply a second energy scale in the pseudogap region.
In conclusion, the in-plane Nernst signal and a quadratic temperature dependence of resistivity are found to occur in the same temperature region above in the intermediate underdoped regime. This suggests a close and inherent relation between Nernst signal and the nodal quasiparticle transport. Possible reasons are given to explain this coincidence. This coincidence may be obscured by other effects in other doping regimes. Our observation may imply a second energy scale or temperature within the pseudogap region.
This work is supported by the National Science Foundation of China , the Ministry of Science and Technology of China, the Chinese Academy of Sciences. We thank Dr. Yoichi Ando and his group (CRIEP, Komae, Tokyo, Japan) for providing us the sample with =0.145. We are grateful to Z. X. Zhao, Z. Y. Weng, N. Nagaosa, T. Xiang and Z. A. Xu for fruitful discussions.
Correspondence should be addressed to hhwen@aphy.iphy.ac.cn
References
- (1) P. W. Anderson et al., Phys. Rev. Lett. 58, 2790 (1987); P. W. Anderson, Science 235, 1196 (1987).
- (2) D. Pines, Physica C 235, 113 (1994); D. Scalapino, Phys. Rep. 250, 329 (1995).
- (3) V. J. Emery, S. A. Kievelson, Nature 374, 434 (1995); A. J. Millis, Nature 398, 193(1999).
- (4) V. J. Emery, S. A. Kievelson, and O. Zachar, Phys. Rev. B56, 6120 (1997).
- (5) S. Chakravarty et al., Phys. Rev. B63, 94503 (2001).
- (6) I. K. Affleck and J. B. Marston, Phys. Rev. B 37, 3774(1988).
- (7) J. Corson, et al. Nature 398, 221-223(1999).
- (8) Z. A. Xu, et al., Nature 406, 486(2000).
- (9) F. Zhou, et al., Supercond. Sci. Tech. 16, L7(2003).
- (10) Y. Ando, Y. Kurita, S. Komiya, S. Ono, K. Segawa, Phys. Rev. Lett.92, 197001(2004).
- (11) H. H. Wen, et al., Europhys. Lett.63,583(2003).
- (12) Y. Y. Wang et al., Phys. Rev. Lett. 88, 257003(2002); Y. Y. Wang et al., Phys. Rev. B 64, 224519(2001); N. P. Ong, et al., Annalen der Physik 13, 9(2004).
- (13) B. Batlogg, et al., Physica C235-240, 130(1994). A figure with sumarized data of see T. Timusk, B. Statt, Rep. Prog. Phys.62, 61(1999).
- (14) I. Ussishkin, S. L. Sondhi, D. A. Huse, Phys. Rev. Lett. 89, 287001(2002).
- (15) Z. Y. Weng and V. N. Mathakumar, Phys. Rev. B 66, 094510(2002).
- (16) Y.H. Kim et al., J. Phys.: Condens. Matter 15, 8485(2003).
- (17) S. N. Tan, K. Levin, Phys. Rev. B 69, 064510(2004).
- (18) H. D. Chen, et al., Phys. Rev. Lett. 89, 137004(2002); Phys. Rev. B 70, 024516(2004); Cond-mat/0402323.
- (19) M. R. Norman, et al., Nature 392, 157(1998). P. Coleman, Nature 392, 134(1998). A. Damascelli, Z. Hussain, Z. X. Shen, Rev. Mod. Phys. 75, 473(2003).
- (20) J. W. Loram, et al., 71, 1740(1993).
- (21) B. Dora et al., Phys. Rev. B 68, 241102(2003).
- (22) V. Oganesyan, I. Ussishkin, Phys. Rev.70, 054503(2004).
- (23) A. Ino, et al., Phys. Rev. B 65, 094504(2002); T. Yoshida, et al., Phys. Rev. Lett. 91, 027001(2003).