Presently at: ]Aerospace and Mechanical Engineering Dept, Boston University, Boston, MA 02215.
Observation of a subgap density of states in superconductor-normal metal bilayers
in the Cooper limit
Abstract
We present transport and tunneling measurements of Pb-Ag bilayers with thicknesses, and , that are much less than the superconducting coherence length. The transition temperature, , and energy gap, , in the tunneling Density of States (DOS) decrease exponentially with at fixed . Simultaneously, a DOS that increases linearly from the Fermi energy grows and fills nearly 40% of the gap for 0.1 . This behavior suggests that a growing fraction of quasiparticles decouple from the superconductor as 0. The linear dependence is consistent with the quasiparticles becoming trapped on integrable trajectories in the metal layer.
pacs:
Simple metallic phases have a finite resistance in the zero temperature limit and a nonzero Density Of electronic States (DOS) at the Fermi energy, . In two dimensions (2D), however, the scaling theory of localization asserts that simple metallic phases do not exist Abrahams et al. (1979). Ultrathin films exhibit a continuously decreasing conductance with decreasing temperature in support of this assertion Bergmann (1984). Nevertheless, there exist an increasing number of quasi-2D systems with metallic transport properties at low temperatures. These include 2D electron gases formed in semiconductor heterostructures, which appear to show an Insulator to Metal transition with electron density Kravchenko and Sarachik (2004) and ultrathin films of metals balanced on the brink of a superconducting transition by disorder Chervenak and Valles (1999) or magnetic field Goldman and Markovic (1998); Mason and Kapitulnik (1999). These metallic phases are probably not simple Fermi liquids and their existence depends on electron-electron interaction effectsKravchenko and Sarachik (2004); Phillips and Dalidovich (2003). Recently, two groups proposed that 2D arrays of superconducting islands immersed in a metal undergo a quantum superconductor to metal transition (SMT) with decreasing island concentration Feigel’man et al. (2001); Spivak et al. (2001). The resulting metallic phase has non-Fermi liquid properties including a pseudogap and anomalous magnetoresistance Spivak et al. (2001).
Furthermore, theories of mesoscopic Superconductor-Normal metal (SN) structures have revealed mechanisms by which a finite DOS can appear within the energy gap of superconducting structures. These states, which give the DOS a hybrid superconductor-metal appearance, correspond to quasi-particles that become partially trapped in the N regions Ostrovsky et al. (2002); Melsen et al. (1996); Lodder and Nazarov (1998). Mesoscopic spatial fluctuations in the local conductivity can give rise to “quasi-localized” states within the N region. These states appear within the gap, smearing the gap edge and creating a DOS down to Ostrovsky et al. (2002). Within semi-classical models Melsen et al. (1996); Lodder and Nazarov (1998); Schomerus and Beenakker (1999), the DOS depends on whether the dynamics in the N region is chaotic or integrable. Quasiparticles on ballistic, integrable trajectories can become quasi-trapped in N regions and contribute a subgap DOS that grows linearly from .
We have conducted a series of experiments on ultrathin SN bilayers in an effort to observe the proposed SMT Feigel’man et al. (2001); Spivak et al. (2001) and its associated metallic phase. These bilayers can be driven toward the metallic phase by increasing the metal layer thickness, , at fixed superconductor thickness, . Within quasiclassical proximity effect theories, the bilayers ought to have a hard, BCS gap in the DOS and make a transition to a metal phase only as . Contrary to this expectation, our previous work showed that their superconducting transition temperatures, , decrease faster with than quasi-classical predictions suggesting the approach to a SMT Kouh and Valles (2003).
Here we present electron tunneling measurements showing that the DOS of ultrathin SN bilayers develops a hybrid superconductor-metal appearance that becomes more metallic as decreases. Specifically, the superconducting gap of ultrathin Pb-Ag bilayers systematically fills with states as is decreased by increasing the metal thickness, at fixed superconductor thickness, . The subgap DOS is finite at and rises linearly with energy with a slope that increases with . Recent theories suggest that these subgap states are quasiparticles that become decoupled from the superconductor for times longer than the superconducting coherence time Ostrovsky et al. (2002); Melsen et al. (1996); Lodder and Nazarov (1998); Schomerus and Beenakker (1999). The linear dependence is consistent with semiclassical theories of quasiparticles becoming trapped on integrable trajectoriesMelsen et al. (1996); Lodder and Nazarov (1998); Schomerus and Beenakker (1999).
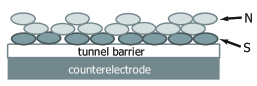
For these studies, Pb/Ag bilayers with ultraclean Pb/Ag interfaces were fabricated and measured in situ using quench condensation techniques in the UHV environment of a dilution refrigerator cryostatKouh and Valles (2003). The metals were thermally evaporated onto fire polished glass substrates held at 8 K. Au/Ge contact pads and oxidized Al counterelectrodes with a small amount of magnetic impurities to prevent them from superconducting were deposited prior to cryostat mounting. To form bilayers, a thin 6 nm, electrically discontinuous, Pb film was deposited first followed by, without breaking vacuum or warming, a series of Ag depositions (see Fig. 1). The latter drove the bilayer through an insulator to superconductor transition Hsu et al. (1994); Merchant et al. (2001). This procedure yielded a series of bilayers with a single and a range of that were probed with the same, 1.25 mm2 area, tunneling counterelectrode and barrier. The transport and tunneling measurements were performed using standard 4 terminal, low frequency AC techniques. Data acquired on a series of bilayers with 4.0 nm and 4.2 19.3 nm are presented here. This data set is the most complete and systematic. It exhibits features that are similar to those of other series with 1.5 6.0 nm.
The normalized, superconducting bilayer DOS, , is obtained from the normalized differential conductance, , of the tunnel junctionTinkham (1996):
where and are the differential conductances, , in the superconducting and normal states, respectively. is the tunnel current and is the voltage across the junction. is the Fermi function and is the energy measured from . At low temperatures, 0.1 , . In the Cooper limit Cooper (1961); De Gennes (1964); Fominov and Feigel’man (2001), is predicted to assume the BCS form, where is the energy gap.
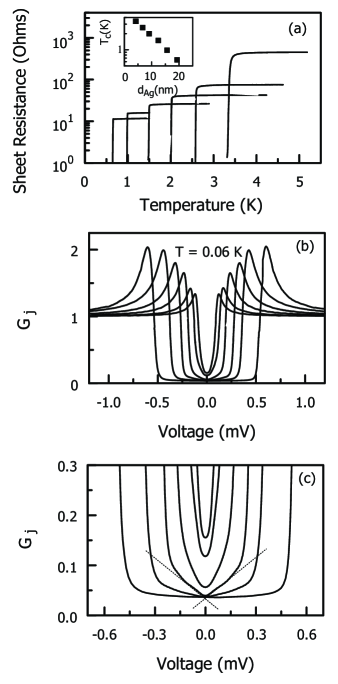
The evolution of the resistive transitions, and tunneling conductances, , of a bilayer series driven toward the metallic state is shown in Fig. 2. The transitions are sharp and , defined as the temperature at which is half its normal state value, drops exponentially with (inset). The , obtained at 60 mK , qualitatively resemble the BCS form, exhibiting an energy gap structure consisting of symmetric peaks and a depression at low voltages (Fig. 2b). Within the gap region, however, has an approximately linear voltage dependence and a finite value at zero voltage (Fig. 2c) rather than an exponentially small value. This subgap conductance grows with and fills nearly 40% of the gap for the bilayer with 0.67 K. In addition, the conductance peaks are shorter and broader than the BCS prediction.
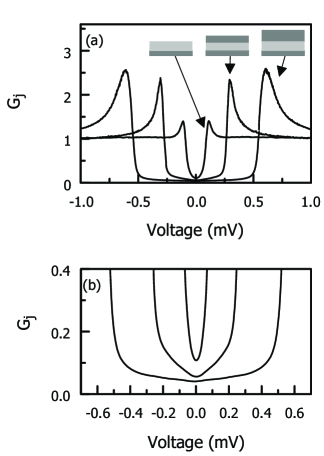
Depositing Pb atop a bilayer to create a trilayer reverses the above evolution as shown in Fig. 3 for a bilayer with 1.4 nm and 7.1 nm. It’s resembled that of the lower bilayers in Fig. 2. Adding an upper Pb layer sharpened the peaks, increased the energy gap and reduced the slope and zero voltage bias value of . A second Pb evaporation continued these trends. We hasten to note that the reduction in the subgap conductance induced by the upper Pb layer is a sign that the subgap conductance reflects an intrinsic feature of the DOS. A subgap conductance stemming from leakage would be unaffected by an upper Pb layer.
Except for the subgap conductance and the broadened conductance peaks, the data in Fig. 2 follow quasiclassical models of the proximity effect in the Cooper limit Cooper (1961); De Gennes (1964); Fominov and Feigel’man (2001); Bourgeois et al. (2003). In this limit, which applies to bilayers with , the superconducting coherence length, electrons near pass back and forth between the S and N regions rapidly compared to . The effective superconducting coupling constant, , is the volume average of the coupling constants in the N and S regions and thus, depends linearly on in agreement with the inset of Fig. 2a Cooper (1961). The rapid motion renders the pairing amplitude uniform across the bilayer and thus, leads to a BCS form for the tunneling DOS De Gennes (1964) that roughly agrees with the data.
The extra breadth in the peaks can be attributed to the existence of a distribution of energy gaps in the bilayers. A distribution can naturally arise due to spatial variations in the film thickness ratio since depends exponentially on . Presuming , a (random) normal distribution of yields a log-normal distribution for and a broadened form of :
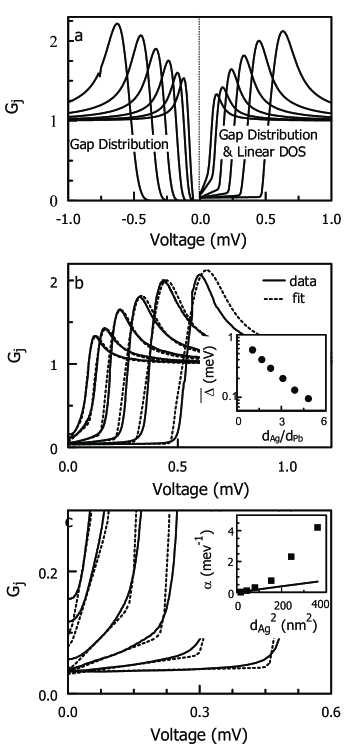
where is the most probable energy gap and is the width of the distribution. The parameters 0.88 meV and 0.46 were obtained by estimating for each bilayer as the voltage at which 1 and fitting to the exponential form. Calculated (see Fig. 4a) with broadened peaks that resemble the data require 25% of .
The states that systematically fill the superconducting gap, however, do not readily conform to a gap distribution model. The log-normal gap distribution drops too rapidly below to reproduce the linear DOS and finite zero bias conductance(see Fig. 4a). Creating the observed DOS at would require that assume values at least 10 times larger than the values used to fit the peaks. Thus, we are led to the conclusion that the subgap DOS corresponds to quasiparticles that fall outside the Cooper limit picture and thus must relate to a new physical mechanism. A similar problem was encountered by Gupta and coworkersGupta et al. (2004) who were unable to fit subgap structure in their STM data on Au/Nb films.
According to semi-classical theories, subgap states correspond to quasiparticles that propagate in an N region over distances more than between successive Andreev scattering events with an NS interfaceUsadel (1970); Belzig et al. (1996); Melsen et al. (1996); Lodder and Nazarov (1998). This situation normally occurs in SN structures with N region dimensions exceeding , Belzig et al. (1996); Moussy et al. (2001); Gueron et al. (1996); Truscott et al. (1999); Tessmer et al. (1996) or structures with integrable dynamics Melsen et al. (1996); Lodder and Nazarov (1998), in which quasiparticles can execute nearly closed trajectories. Interestingly, the predicted DOS grows approximately linearly with energy for a variety of structuresBelzig et al. (1996); Melsen et al. (1996); Lodder and Nazarov (1998); Schomerus and Beenakker (1999). In particular, Melsen and coworkers Melsen et al. (1996) proposed that for a rectangular integrable N billiard attached to a bulk S region, the distribution of path lengths, , between successive Andreev scattering events follows as . The normalized slope of the resulting linear DOS is Melsen et al. (1996), where is the Thouless energy. Furthermore, the more general case of a mixed phase space that consists of both regular (integrable) and chaotic regions also yields a linear DOS and, in addition, a constant background DOS arising from phase space regions that are completely disconnected from the superconductor Schomerus and Beenakker (1999).
Guided by the above considerations and low temperature STM measurements showing that the bilayers consist of crystalline Pb and Ag grainsEkinci and Valles (1999); Long and Valles (in preparation), we now assume that the bilayers present a mixed phase space of regular and chaotic regions111The quasiparticle propagation in these granular bilayers is neither strictly ballistic nor strictly diffusive. It is generally believed that intragrain propagation is ballistic while the intergrain propagation is diffusive.. Quasiparticles with chaotic trajectories contribute a BCS like portion, , to the DOS while those with regular trajectories contribute a linear subgap DOS. Thus, we parameterize :
where and are the slope and the intercept of the linear dependence, respectively, and is the energy at which the two DOS intersect. Fig. 4a(right) shows calculated from this DOS 222To ensure conservation of states for this form, we reduced by the fraction of subgap states. This reduction made the peak heights on the left and right hand sides of Fig. 4a differ.. Fits to the data optimized to capture the subgap slopes and the peak heights are shown in Fig. 4b and Fig. 4c. decreases exponentially with (inset Fig. 4b) consistent with expectations for the Cooper limit. Since is the slope of the DOS averaged over the regular phase space regions, is proportional to the average . For these bilayers, we expect , where is the intergrain diffusivity and thus . Fig. 4c compares the experimental values with those estimated by , using as obtained from transport measurements. The two roughly agree at small and deviate at higher where the experimental values grow more rapidly than expected. The deviation suggests that also depends on . This case has not been considered by the current theories Melsen et al. (1996); Schomerus and Beenakker (1999). The trilayer data support this conjecture, exhibiting a reduction in when is increased at fixed . Regardless, this deviation implies that the regular phase space regions occupy an increasing fraction of the total phase space volume as increases. The concomitant increase of implies a growing fraction of disconnected regions, as well. Consequently, as decreases, a growing fraction of quasiparticles decouple from the S layer for times much greater than the superconducting coherence time.
Qualitatively, the growth in the subgap DOS gives the DOS a hybrid-metal-superconductor appearance that may be a sign of an approaching SMT. Ultrathin films near the disorder tuned superconductor-insulator transition exhibit a similar filling of the gap Valles et al. (1992); Hsu et al. (1995) and low energy states have been invoked as a source of dissipation that drives the Quantum SMT observed in nanowires Bezryadin et al. (2000); Sachdev et al. (2004); Tewari (2004). Perhaps these states arise due to similar quasiparticle trapping effects.
Tunneling experiments on ultrathin Pb-Ag bilayers at low reduced temperatures ( 0.1) have revealed an unexpected linear DOS within their superconducting energy gap. The fraction of the gap filled with states grows with increasing . We have identified the subgap states as quasiparticles that are weakly coupled to the superconductor layer. Within a semiclassical picture, these quasiparticles become trapped in regular regions of phase space.
Acknowledgements.
The work was supported by NSF-DMR0203608. We acknowledge helpful conversations with Dmitri Feldman.References
- Abrahams et al. (1979) E. Abrahams et al., Phys. Rev. Lett. 42, 673 (1979).
- Bergmann (1984) G. Bergmann, Phys. Rep. 107, 1 (1984).
- Kravchenko and Sarachik (2004) S. V. Kravchenko and M. P. Sarachik, Rep. Prog. Phys. 67, 1 (2004).
- Chervenak and Valles (1999) J. A. Chervenak and J. M. Valles, Phys. Rev. B 59, 11209 (1999).
- Goldman and Markovic (1998) A. M. Goldman and N. Markovic, Physics Today 51, 39 (1998).
- Mason and Kapitulnik (1999) N. Mason and A. Kapitulnik, Phys. Rev. Lett. 82, 5341 (1999).
- Phillips and Dalidovich (2003) P. Phillips and D. Dalidovich, Science 302, 243 (2003).
- Feigel’man et al. (2001) M. V. Feigel’man, A. I. Larkin, and M. A. Skvortsov, Phys. Rev. Lett. 86, 1869 (2001).
- Spivak et al. (2001) B. Spivak, A. Zyuzin, and M. Hruska, Phys. Rev. B 64, 132502 (2001).
- Ostrovsky et al. (2002) P. M. Ostrovsky, M. A. Skvortsov, and M. V. Feigel’man, JETP Lett. 75, 336 (2002).
- Melsen et al. (1996) J. A. Melsen et al., Europhys. Lett. 35, 7 (1996).
- Lodder and Nazarov (1998) A. Lodder and Y. V. Nazarov, Phys. Rev. B 58, 5783 (1998).
- Schomerus and Beenakker (1999) H. Schomerus and C. W. J. Beenakker, Phys. Rev. Lett. 82, 2951 (1999).
- Kouh and Valles (2003) T. Kouh and J. M. Valles, Phys. Rev. B 67, 140506 (2003).
- Hsu et al. (1994) S. Y. Hsu et al., Physica B 194, 2337 (1994).
- Merchant et al. (2001) L. Merchant et al., Phys. Rev. B 6313, 134508 (2001).
- Tinkham (1996) M. Tinkham, Introduction to superconductivity (The McGraw-Hill Companies, Inc., 1996).
- Cooper (1961) L. N. Cooper, Phys. Rev. Lett. 6, 689 (1961).
- De Gennes (1964) P. G. De Gennes, Rev. Mod. Phys. 36, 225 (1964).
- Fominov and Feigel’man (2001) Y. V. Fominov and M. V. Feigel’man, Phys. Rev. B 6309, 094518 (2001).
- Bourgeois et al. (2003) O. Bourgeois, A. Frydman, and R. C. Dynes, Phys. Rev. B 68, 092509 (2003).
- Gupta et al. (2004) A. K. Gupta et al., Phys. Rev. B 69, 104514 (2004).
- Usadel (1970) K. D. Usadel, Phys. Rev. Lett. 25, 507 (1970).
- Belzig et al. (1996) W. Belzig, C. Bruder, and G. Schon, Phys. Rev. B 54, 9443 (1996).
- Moussy et al. (2001) N. Moussy, H. Courtois, and B. Pannetier, Europhys. Lett. 55, 861 (2001).
- Gueron et al. (1996) S. Gueron et al., Phys. Rev. Lett. 77, 3025 (1996).
- Truscott et al. (1999) A. D. Truscott, R. C. Dynes, and L. F. Schneemeyer, Phys. Rev. Lett. 83, 1014 (1999).
- Tessmer et al. (1996) S. H. Tessmer et al., Phys. Rev. Lett. 77, 924 (1996).
- Ekinci and Valles (1999) K. L. Ekinci and J. M. Valles, Phys. Rev. Lett. 82, 1518 (1999).
- Long and Valles (in preparation) Z. Long and J. M. Valles (in preparation).
- Valles et al. (1992) J. M. Valles, R. C. Dynes, and J. P. Garno, Phys. Rev. Lett. 69, 3567 (1992).
- Hsu et al. (1995) S. Y. Hsu, J. A. Chervenak, and J. M. Valles, Phys. Rev. Lett. 75, 132 (1995).
- Bezryadin et al. (2000) A. Bezryadin, C. N. Lau, and M. Tinkham, Nature 404, 971 (2000).
- Sachdev et al. (2004) S. Sachdev, P. Werner, and M. Troyer, Phys. Rev. Lett. 92, 237003 (2004).
- Tewari (2004) S. Tewari, Phys. Rev. B 69, 014512 (2004).