Dynamical Mean-Field Theory and Its Applications to Real Materials
Abstract
Dynamical mean-field theory (DMFT) is a non-perturbative technique for the investigation of correlated electron systems. Its combination with the local density approximation (LDA) has recently led to a material-specific computational scheme for the ab initio investigation of correlated electron materials. The set-up of this approach and its application to materials such as (Sr,Ca)VO3, V2O3, and Cerium is discussed. The calculated spectra are compared with the spectroscopically measured electronic excitation spectra. The surprising similarity between the spectra of the single-impurity Anderson model and of correlated bulk materials is also addressed.
1 Introduction
In many materials with partially filled and electron shells, such as the transition metals Ti, V, Fe and their oxides or rare–earth metals such as Ce, electrons occupy narrow orbitals. This spatial confinement enhances the effect of the Coulomb interaction between the electrons, making them “strongly correlated”.[1] The interplay between the spin, charge and orbital degrees of freedom of the correlated and electrons and the lattice degrees of freedom leads to a multitude of unusual ordering phenomena at low temperatures. Consequently, strongly correlated electron systems are often exceedingly sensitive to small changes in the temperature, pressure, magnetic field, doping, and other control parameters. This results, for example, in large changes of the resistivity across metal-insulator transitions, of the volume across phase transitions, and of the effective electronic masses. Electronic correlations are also essential for an understanding of high temperature superconductivity. These properties cannot be explained within conventional mean-field, e.g., Hartree-Fock theory, since these theories describe the interaction only in an average way and in terms of a static mean field.
2 Dynamical Mean-Field Theory (DMFT)
During the last few years, our understanding of electronic correlation effects has considerably improved due to the development of dynamical mean-field theory (DMFT) [2, 3, 4, 5, 6, 7, 8, 9, 10]; for an introduction into DMFT and its applications see Ref.[11]. Within DMFT the electronic lattice problem is mapped onto a single-impurity Anderson model with a self-consistency condition. [10] This mapping becomes exact in the limit of large coordination number of the lattice [2] and allows one to investigate the dynamics of correlated lattice electrons non-perturbatively at all interaction strengths.
The single-impurity Anderson model [12] itself defines one of the fundamental many-body problems whose investigation during the last 40 years has led to enormous physical insights and important progress in the development of theoretical investigation techniques[13]. In particular, a new many-body energy scale (the Kondo[14] temperature) is known to arise in this problem, which is exponentially small in the limit of vanishing hybridization. Below this temperature the system can always be understood as a “local Fermi liquid” with strongly renormalized quasiparticles.[15] In particular, the single-particle spectrum, i.e., the local density of states (DOS), exhibits a generic three peak structure consisting of two broad maxima originating from the atomic levels, and a sharp “Kondo” or “Abrikosov-Suhl” resonance at the Fermi level, of width .
We now know that this characteristic three-peak spectrum of the single-impurity model is also found in correlated bulk systems, i.e., lattice models and real materials, where the notion of a “single impurity” is not applicable. This surprising fact is explained by DMFT. Indeed, DMFT is presently the only theoretical approach which can derive the electronic excitation spectrum at all energy scales, hence reproducing the incoherent features at high energies (Hubbard bands), [16] and the coherent quasiparticle behavior at low energies within the same formalism. [17, 18]
3 Single-Particle Spectrum of Correlated Electrons: One-Band Hubbard Model
Apparently there is a close relation between quantum impurity physics, with the Kondo problem as its paradigm, and the physics of correlated electrons on a lattice as exemplified by the Hubbard model. The connection on the technical side is through the mapping of a lattice model onto an effective impurity model, as done in DMFT. As a consequence, well-known features of the impurity model such as the Kondo resonance reappear in the solution of lattice models. In particular, the pinning of the density of states (DOS) at the Fermi level obtained within DMFT[4] directly corresponds to the Friedel sum-rule for the single-impurity Anderson model. This is clearly seen in Fig. 1 where we show the evolution of the local spectral function of the DMFT solution for the one-band Hubbard model
| (1) |
at zero temperature and half filling as a function of local Coulomb repulsion in units of the bandwidth of non-interacting electrons. Here denotes the lattice site, is the amplitude for nearest-neighbor hopping on the lattice, and is the local Hubbard repulsion. Magnetic order is assumed to be suppressed (“frustrated”).

While at small the system can be described by quasi-particles whose DOS still resembles that of the free electrons, in the Mott insulator state the spectrum consists of two separate “Hubbard bands” whose centers are separated approximately by the energy . The latter originate from “atomic” excitations at the energies broadened by hopping of electrons away from the atom. At intermediate values of the spectrum then has a characteristic three-peak structure as in the single-impurity Anderson model, which includes both the atomic features (i.e., Hubbard bands) and the narrow quasi-particle peak at low excitation energies, near . [10] This corresponds to a strongly correlated metal. The structure of the spectrum (lower Hubbard band, quasiparticle peak, upper Hubbard band) is quite insensitive to the specific form of the DOS of the non-interacting electrons.
It is important to note that the three-peak spectrum in Fig. 1 originates from a lattice model with one type of electrons only. This is in contrast to the single–impurity Anderson model whose spectrum shows very similar features, but is due to two types of electrons, namely the localized orbital at the impurity site and the free conduction band. Therefore the screening of the magnetic moment which gives rise to the Kondo effect in impurity systems has a different origin in lattice systems. Namely, as explained by DMFT, the same sort of electrons provide both the local moments and the electrons which screen these moments. DMFT also allows one to investigate the periodic Anderson model in which a lattice of localized electrons hybridizes with an uncorrelated conduction band (see, for example, Refs. [19]). The resulting DOS of the localized electrons again shows the typical three-peak structure. There are, however, important differences to both the Hubbard model and the single-impurity Anderson model, such as the appearance of a hybridization gap at or close to the Fermi level.
The vanishing of the quasiparticle peak in the Hubbard model signals a “Mott-Hubbard metal-insulator transition”. This transition between a paramagnetic metal and a paramagnetic insulator induced by the Coulomb interaction between the electrons is one of the most famous examples of a cooperative phenomenon involving electronic correlations. The question concerning the microscopic origin and nature of this transition poses one of the fundamental theoretical problems in condensed matter physics.[20, 21] Correlation induced metal-insulator transitions (MIT) are found, for example, in transition metal oxides with partially filled bands near the Fermi level such as VO3 doped with Cr[22, 23] (see section 5.2). For these systems band theory typically predicts metallic behavior.
¿From a theoretical point of view the Mott transition is a paradigmatic correlation problem since it focusses on the competition between kinetic energy and correlation energy of correlated electrons in the solid. Here DMFT has led to significant new insights.[11, 10, 25, 26, 24, 27] In particular, the Mott-transition is found to be of first order at finite temperatures, being associated with a hysteresis region in the interaction range where and are the values at which the insulating and metallic solution, respectively, vanishes. The hysteresis region terminates at a critical point . For temperatures above the transition changes into a smooth crossover from a bad metal to a bad insulator.
The evolution of the spectral function of the half-filled frustrated Hubbard model at finite temperatures, , is shown in Fig. 2. This temperature is above the temperature of the critical point so that there is no real transition but a crossover from a metallic-like to an insulating-like solution. The height of the quasiparticle peak at the Fermi energy is no longer fixed at its zero temperature value. This is due to a finite value of the imaginary part of the self–energy. The spectral weight of the quasiparticle peak is seen to be gradually redistributed and shifted to the upper (lower) edge of the lower (upper) Hubbard band. The inset of Fig. 2 shows the -dependence of the value of the spectral function at zero frequency . For higher values of the spectral density at the Fermi level is still finite and vanishes only in the limit (or for , provided that ).
For the insulating phase DMFT predicts the filling of the Mott-Hubbard gap with increasing temperature. This is due to the fact that the insulator and the metal are not distinct phases in the crossover regime, implying that the insulator has a finite spectral weight at the Fermi level. This behavior has recently been detected experimentally by photoemission experiments.[28]

4 LDA+DMFT
Although the Hubbard model is able to explain certain basic features of the Mott-Hubbard MIT and of the phase diagram of correlated electrons it cannot explain the physics of real materials in any detail. Clearly, realistic theories must take into account the explicit electronic structure of the systems.
Recently, the LDA+DMFT method, a new computational scheme that merges electronic band structure calculations and the dynamical mean-field theory, was developed [29, 32, 33, 30, 31, 11]. Starting from conventional band structure calculations in the local density approximation (LDA) the correlations are taken into account by the Hubbard interaction and a Hund’s rule coupling term. The resulting DMFT equations are solved numerically with a quantum Monte-Carlo (QMC) algorithm. By construction, LDA+DMFT includes the correct quasiparticle physics and the corresponding energetics and reproduces the LDA results in the limit of weak Coulomb interaction . More importantly, however, LDA+DMFT correctly describes the correlation induced dynamics near a Mott-Hubbard MIT and beyond. Thus, LDA+DMFT is able to account for the correct physics for all Coulomb interactions and doping levels.
In the LDA+DMFT approach [29, 30, 31] the LDA band structure is expressed by a one-particle Hamiltonian , and is then supplemented by the local Coulomb repulsion and Hund’s rule exchange . This leads to a material specific generalization of the one-band model Hamiltonian (1):
| (2) |
| (3) |
Here and enumerate the three interacting orbitals of the transition metal ion or the orbitals in the case of rare earth elements. The interaction parameters are related by which holds exactly for degenerate orbitals and is a good approximation for the . The actual values for and can be obtained from an averaged Coulomb parameter and Hund’s exchange , which can be calculated by constrained LDA. The energy term containing is a shift of the one-particle potential of the interacting orbitals. It cancels the Coulomb contribution to the LDA results, and can be calculated by constrained LDA.[30]
Within the LDA+DMFT scheme the self-consistency condition connecting the self-energy and the Green function at frequency reads:
| (4) |
Here, is the unit matrix, the chemical potential, is the orbital matrix of the LDA Hamiltonian derived, for example, in a linearized muffin-tin orbital (LMTO) basis, denotes the self-energy matrix which is nonzero only between the interacting orbitals, and implies the inversion of the matrix with elements (=), (=), where and are the indices of the atom in the primitive cell and of the orbital, respectively. The integration extends over the Brillouin zone with volume (note that may include additional non-interacting orbitals).
For cubic transition metal oxides Eq. (4) can be simplified to
| (5) |
if the degenerate orbitals crossing the Fermi level are well separated from the other orbitals. [30] For non-cubic V2O3 the degeneracy is lifted. In this case we employ Eq. (5) as an approximation, using different , and for the three non-degenerate orbitals.
The Hamiltonian (2) is solved within the DMFT using standard quantum Monte-Carlo (QMC) techniques to solve the self-consistency equations [34]. From the imaginary time QMC Green function we calculate the physical (real frequency) spectral function with the maximum entropy method, [35] using the program by Sandvik.
5 Single-Particle Spectrum of Correlated Electrons: Real Materials
Transition metal oxides are an ideal laboratory for the study of electronic correlations in solids. Among these materials, cubic perovskites have the simplest crystal structure and thus may be viewed as a starting point for understanding the electronic properties of more complex systems. Typically, the states in those materials form comparatively narrow bands with width eV, which leads to strong Coulomb correlations between the electrons. Particularly simple are transition metal oxides with a 3 configuration since, among others, they do not show a complicated multiplet structure.
Photoemission spectra provide a direct experimental tool to study the electronic structure and spectral properties of electronically correlated materials. Intensive experimental investigations of spectral and transport properties of strongly correlated 3 transition metal oxides started with investigations by Fujimori et al. [36]. These authors observed a pronounced lower Hubbard band in the photoemission spectra (PES) which cannot be explained by conventional band structure theory.
In the following we will employ LDA+DMFT to compute the -integrated electronic spectra of two correlated materials, the 3 system (Sr,Ca)VO3 and the more complicated 3 system V2O3, using the Hilbert transform of the LDA DOS (see eq. (5)).
5.1 SrxCa1-xVO3
SrVO3 and CaVO3 are simple transition metal compounds with a 3 configuration. The main effect of the substitution of Sr ions by the isovalent, but smaller, Ca ions is to decrease the V-O-V angle from in SrVO3 to in the orthorhombically distorted structure of CaVO3. However, this rather strong bond bending results only in a 4% decrease of the one-particle bandwidth and thus in a correspondingly small increase of the ratio as one moves from SrVO3 to CaVO3.[37]
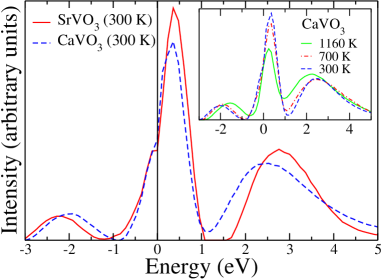
LDA+DMFT(QMC) spectra of SrVO3 and CaVO3 were calculated by Sekiyama et al.[37] by starting from the respective LDA DOS of the two materials, and are shown in Fig. 3. These spectra show genuine correlation effects, i.e., the formation of lower Hubbard bands at about 1.5 eV and upper Hubbard bands at about 2.5 eV, with well pronounced quasiparticle peaks at the Fermi energy. Therefore both SrVO3 and CaVO3 are strongly correlated metals. The DOS of the two systems shown in Fig. 3 are quite similar. In fact, SrVO3 is slightly less correlated than CaVO3, in accord with their different LDA bandwidths. The inset of Fig. 3 shows that the effect of temperature on the spectrum is small for K. Spectra of SrVO3 and CaVO3 were also calculated independently by Pavarini et al.[38]. The enhancement of electronic correlations at the surface of SrVO3 as compared to the bulk was studied by Liebsch[39].
Since the three orbitals of this simple 3 material are (almost) degenerate the spectral function has the same three–peak structure as that of the one-band Hubbard model shown in Fig. 2. The temperature induced decrease of the quasiparticle peak height is also clearly seen. As noted in Sect. 3 the actual form of the spectrum no longer resembles the input (LDA) DOS, i.e., it essentially depends only on the first three energy moments of the LDA DOS (electron density, average energy, band width).
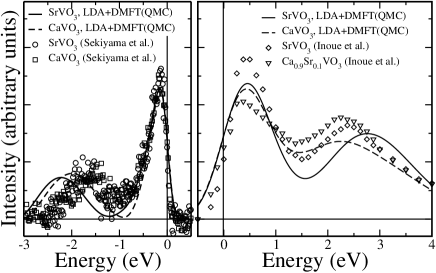
In the left panel of Fig. 4 we compare the LDA+DMFT(QMC) spectra at 300K to experimental high-resolution bulk PES. For this purpose we multiplied the theoretical spectra with the Fermi function at the experimental temperature (20 K) and Gauss broadened with the experimental resolution of eV. [37] The quasiparticle peaks in theory and experiment are seen to be in very good agreement. In particular, their height and width are almost identical for both SrVO3 and CaVO3. The difference in the positions of the lower Hubbard bands may be partly due to (i) the subtraction of the (estimated) oxygen contribution which might also remove some spectral weight below eV, and (ii) uncertainties in the ab-initio calculation of . In the right panel of Fig. 4 we compare with XAS data of Inoue et al. [41, 42]. We consider core-hole life time effects by Lorentz broadening the spectrum with 0.2 eV [43], multiplying with the inverse Fermi function (80K), and then Gauss broadening with the experimental resolution of eV [44]. Again, the overall agreement of the weights and positions of the quasiparticle and upper Hubbard band is good, including the tendencies when going from SrVO3 to CaVO3 (Ca0.9Sr0.1VO3 in the experiment). For CaVO3 the weight of the quasiparticle peak is somewhat lower than in the experiment. In contrast to one-band Hubbard model calculations, our material specific results reproduce the strong asymmetry around the Fermi energy w.r.t. weights and bandwidths. Our results also give a different interpretation of the XAS than in Ref.[41] where the maximum at about eV was attributed to an band and not to the upper Hubbard band. The slight differences in the quasiparticle peaks (see Fig. 3) lead to different effective masses, namely for SrVO3 and for CaVO3. These theoretical values agree with for SrVO3 and CaVO3 as obtained from de Haas-van Alphen experiments and thermodynamics [45, 46].
5.2 VO3
The physical properties of , and the metal-insulator transition in its paramagnetic phase, have been subject of experimental and theoretical studies for more than 30 years. Recent advances in experimental PES and the microscopic modeling of correlated electron systems by the LDA+DMFT approach have led to essential new insights into this correlation-induced phenomenon[47, 48, 40].
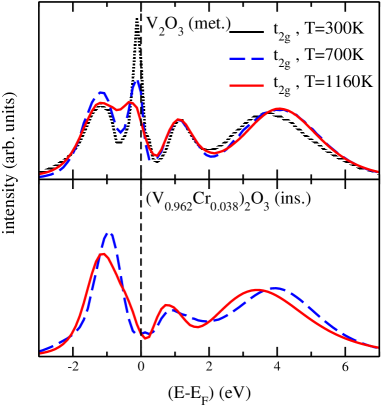
Using the crystal structure of paramagnetic metallic (PM) and paramagnetic insulating (PI) , respectively, as input we performed LDA+DMFT(QMC) calculations with one and two degenerate bands. To study the metal-insulator transition at experimentally relevant temperatures we calculated at K and K. Since the computational effort is proportional to the low temperature calculations were computationally very expensive. Fig. 5 shows the results of our calculations at K, K, and K for metallic , and at K and K for insulating . In the metallic phase, the incoherent features are hardly affected by a change in temperature, whereas the quasiparticle peak becomes sharper and thus more pronounced at lower temperatures. This behavior also occurs in the Anderson impurity model [13] and has its origin in the smoothing of the Kondo-Abrikosov-Suhl resonance at temperatures larger than the Kondo temperature. However, in contrast to the Anderson impurity model this smoothing occurs here at considerably lower temperatures which is apparently an effect of the DMFT self-consistency cycle.
Before focusing on the comparison with experiment, let us briefly discuss a peculiarity of the Mott-Hubbard transition which is due to the orbital degrees of freedom. [40] In the one-band Hubbard model the Mott-Hubbard transition is characterized by the disappearance of the quasiparticle weight . However, for inequivalent and orbitals as is the case considered here only the quasiparticle weight of the orbitals diverges, while that of the orbital stays finite. Instead, the effective chemical potential at low energies, i.e., in Eq. (5), moves outside the non-interacting LDA DOS. As a consequence not the width but the height of the quasiparticle resonance goes to zero at the Mott-Hubbard transition (albeit with a very much reduced width). For the orbitals the transition is characterized by a combined shrinking of width and height. In this context we note that the pinning of the height of the spectrum at the Fermi energy – valid in DMFT for a single orbital[4] (or degenerate orbitals) – does not hold in the case of inequivalent orbitals. In our case, the volume enclosed by the orbital shrinks at the expense of the orbitals. Only the total volume remains constant in accord with Luttinger’s theorem. [49]
To be able to compare with experimental photoemission spectra, the LDA+DMFT results [47] were multiplied with the Fermi function at the experimental temperature ( K) and broadened with a eV Gaussian to account for the experimental resolution. [48] The same procedure was used for the comparison with x-ray spectroscopy data (with an inverse Fermi function at K and a broadening of eV taken from experiment). On the experimental side, the PES of Refs. [50, 48] were corrected for the inelastic Shirley-type background which also removes the O- contribution. All experimental and theoretical curves were normalized to yield the same area (which is a measure of the occupation of the vanadium bands).
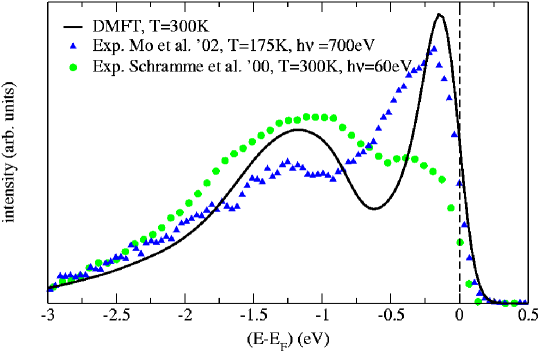
In Fig. 6, the LDA+DMFT results at K are compared with early photoemission spectra by Schramme [50] and recent high-resolution bulk-sensitive photoemission spectra by Mo et al. [48] The strong difference between the experimental results is now known to be due to the distinct surface sensitivity of the earlier data. In fact, the photoemission data by Mo et al. [48] obtained at eV and K exhibit, for the first time, a pronounced quasiparticle peak. This is in good qualitative agreement with our low temperature calculations. However, the experimental quasiparticle peak has more spectral weight. The origin for this discrepancy, for a system as close to a Mott transition as V2O3, is presently not clear.
While the comparison with PES data provides important insight into the physics of V2O3, more than half of the theoretical spectrum lies above . For this region we compare our results at K, K, and K with O 1 X-ray absorption spectra (XAS)[42] for V2O3 at K by Müller et al. [51] (see Fig. 7).
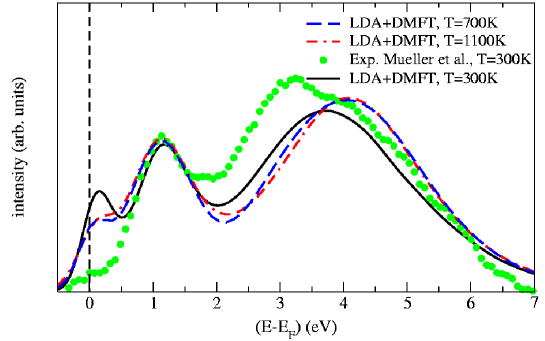
The theoretical spectra above are found to be almost independent of temperature. Namely, there is a shoulder at higher temperatures developing into a small peak at low temperatures ( K)) which is the residue of the quasiparticle peak. Furthermore, at eV there is a rather narrow peak, and at about eV a broad peak. These two peaks are parts of the upper Hubbard band, and are due to the presence of more than one type of correlated electron in the problem (, ) with Hund’s rule coupling . The latter leads to a splitting of the upper Hubbard band. Hence, the relative position of those two peaks depends sensitively on the value of . In particular, a slightly smaller value of will make the agreement with experiment even better.
6 Volume collapse in Cerium
Cerium (Ce) exhibits a transition from the - to the -phase with increasing pressure or decreasing temperature. This transition is accompanied by an unusually large volume change of 15% [52], much larger than the 1-2% volume change in . The -phase may also be prepared in metastable form at room temperature in which case the - transition occurs under pressure at this temperature[53]. Similar volume collapse transitions are observed under pressure in Pr and Gd (for a recent review, see McMahan et al. [54]). It is generally believed that these transitions arise from changes in the degree of electron correlations, as is reflected in both the Mott transition[55] and the Kondo volume collapse (KVC)[56, 57] models.
The Mott transition model envisions a change from itinerant, bonding character of the -electrons in the -phase to non-bonding, localized character in the -phase, driven by changes in the - inter-site hybridization. Thus, as the ratio of the Coulomb interaction to the -bandwidth increases, a Mott transition occurs to the -phase, similar to the Mott-Hubbard transition of the 3-electrons in .
The Kondo volume collapse[56] scenario ascribes the collapse to a strong change in the energy scale associated with the screening of the local -moment by conduction electrons (Kondo screening), which is accompanied by the appearance of an Kondo-Abrikosov-Suhl-like quasiparticle peak at the Fermi level. Indeed, the --transition can be described using a single-impurity model where the model parameters are determined from DFT/LDA and spectroscopy.[57]
In the KVC model the change of the Ce--electron spectrum across the transition is, in principle, very similar to that in the Mott scenario, i.e., there will be a strong reduction of the spectral weight at the Fermi when going from the - to the -phase. The subtle difference comes about by the -phase having metallic -spectra with a strongly enhanced effective mass as in a heavy fermion system, in contrast to the -spectra characteristic of an insulator in the case of the Mott scenario. The -spectra in the Kondo picture also exhibit Hubbard side-bands not only in the -phase, but in the -phase as well, at least close to the transition. While local-density and static mean-field theories used in the Mott transition model up to now[55] correctly yield the Fermi-level peaks in the -spectra for the -phase, they cannot reproduce the Hubbard side-bands since these treatments neglect genuine correlation effects. By contrast, DMFT solutions of both Hubbard and periodic Anderson models do exhibit the Hubbard side-bands in the -like regimes.[62]
Typically, the Hubbard model and the periodic Anderson model are considered paradigms for the Mott and KVC model, respectively. Although both models describe quite different physical situations it was recently shown that they lead to a surprisingly similar behavior at finite temperatures. Namely, for increasing Coulomb interaction the spectrum and local magnetic moment show very similar features. This is also the case for the phase diagram and the charge compressibility of the periodic Anderson model with nearest neighbor hybridization.[62, 63] From this point of view the two scenarios are no longer really distinct, at least at temperatures relevant for the description of the - transition.
For a realistic calculation of the Ce - transition, we employ the full Hamiltonian calculation described in Sect. 4 where the parameters entering the one-particle Hamiltonian were calculated by LDA and the Coulomb interaction along with the associated site energy shift by constrained LDA (for details of the two calculations presented here see Refs. [54, 60, 61] and Ref. [59]).
The LDA+DMFT(QMC) spectral evolution of the Ce -electrons is presented in the left panel of Fig. 8. At a volume per atom Å3, this figure shows that almost the entire spectral weight lies in a large quasiparticle peak with a center of gravity slightly above the chemical potential. This is similar to the LDA solution; however, a weak upper Hubbard band is also present even at this small volume. At the volumes Å3 and Å3 which approximately bracket the - transition, the spectrum has a three peak structure. Finally, at Å3 the central peak has disappeared, leaving only the lower and upper Hubbard bands. An important difference to is the metallic feature of the -spectrum. Thus Ce remains a metal across the transition which is monitored by a vanishing quasiparticle resonance.


To study the energetic changes associated with the rapid change of the quasiparticle weight at the Fermi energy, we calculate the DMFT energy per site for the model Hamiltonian (3)
| (6) |
Here, Tr denotes the trace over the matrices, the temperature, the number of points, the Green function matrix w.r.t. the orbital indices, the LDA one-particle matrix , and
| (7) |
is a generalization of the one-band double occupation for multi-band models. The prime on the sum indicates that at least two of the indices of an operator have to be different.
Fig. 9a shows our calculated DMFT(QMC) energies as a function of atomic volume at three temperatures relative to the paramagnetic Hartree-Fock (HF) energies of the Hamiltonian (3), i.e., the energy contribution due to electronic correlations. We also present the HF energies of a polarized solution which basically represent a non-self-consistent LDA+U calculation and reproduce at large volumes and low temperatures. With decreasing volume the DMFT energies bend away from the polarized HF solutions. Thus, at eVK a region of negative curvature in is evident within the observed two phase region (arrows).
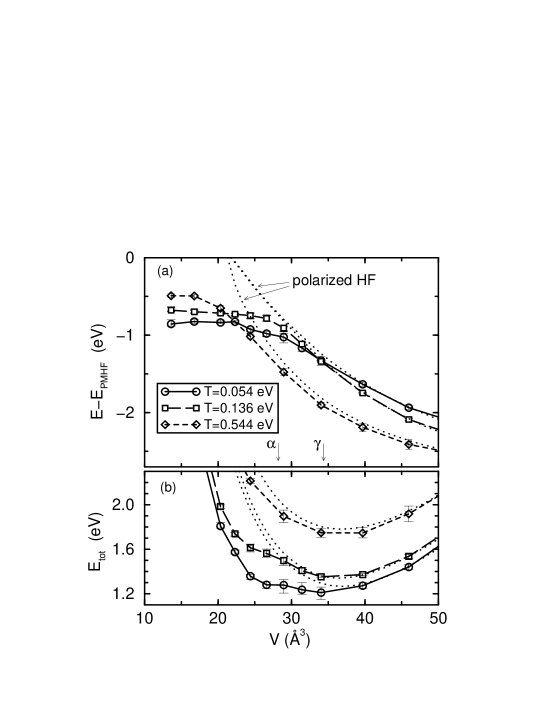
Fig. 9b presents the calculated LDA+DMFT total energy where is the energy of an LDA-like solution of the Hamiltonian (3) [64]. Since both and have positive curvature throughout the volume range considered, it is the negative curvature of the correlation energy in Fig. 9a which leads to the dramatic depression of the LDA+DMFT total energies in the range 26-28 Å3 for decreasing temperature, in contrast to the smaller changes near Å3 in Fig. 9b. This trend is consistent with a double-well structure emerging at still lower temperatures (which is prohibitively expensive for QMC simulations), and with it a first-order volume collapse. This is in reasonable agreement with the experimentally found volume collapse. Other physical quantities like the free energy and the specific heat are discussed in Ref. [61]. We note that a similar scenario has recently been proposed by Savrasov et al. [58] for the - transition in Pu on the basis of LDA+DMFT calculations. These authors solve the DMFT equations by an ansatz inspired by iterated perturbation theory[10] and include a modification of the DFT/LDA step to account for the density changes introduced by the DMFT.
The comparison of various static physical quantities of Ce calculated by LDA+DMFT(QMC) and LDA+DMFT(NCA)[59] with experiment shows fair to good agreement in the overall behavior and, except for the susceptibility, even in absolute values.
Finally, in the right panel of Fig. 8 we compare the spectral functions calculated by LDA+DMFT(QMC) (see left panel of Fig. 8) with experiment[65]. The main contribution to the PES of -Ce (right panel of Fig. 8) is seen to come from the energy range between eV and eV, which is attributed to final state multiplets. In the calculated spectrum all excitations to states are described by the featureless upper Hubbard band. As a consequence of the simplified interaction model all doubly occupied states are degenerate. This shortcoming in our calculation is responsible for the sharply peaked main structure. The neglected exchange interaction would produce a multiplet structure closer to experiment. The calculated -spectrum shows a sharp quasiparticle resonance slightly above the Fermi energy, which is the result of the formation of a singlet state between - and conduction states. We thus suggest that the spectral weight seen in the experiment is a result of this quasiparticle resonance. In the lower part of the right panel of Fig. 8, a comparison between experiment and our calculation for -Ce is shown. The most striking difference to the result for -Ce (upper part of the right panel of Fig. 8) is the absence of the quasiparticle resonance in the -phase which is in agreement with our calculations. Nonetheless -Ce remains metallic with spectral weight arising from the -electrons at the Fermi energy. Altogether, one can say that the agreement with the experimental spectrum is very good — comparable to the accuracy of LDA for much simpler systems.
7 Conclusion
In this paper we discussed the set-up and several applications of the computational scheme LDA+DMFT which merges two non-perturbative, complementary techniques for the theoretical investigation of many-body systems in solid state physics. Using the band structure calculated within local density approximation (LDA) as input, the missing electronic correlations are introduced by dynamical mean-field theory (DMFT). Thereby LDA+DMFT allows one to perform ab initio calculations of real materials with strongly correlated electrons, i.e., electronic systems close to a Mott-Hubbard metal-insulator transition, heavy fermions, and -electron materials. The physical properties of such systems are characterized by the correlation-induced generation of small, Kondo-like energy scales which are missing in the LDA and which make the application of genuine many-body techniques necessary.
On a technical level LDA+DMFT requires the solution of an effective self-consistent, multi-band Anderson impurity problem by numerical methods, e.g., QMC. The investigation of quantum impurity problems in the last 40 years, in particular the development of theoretical and numerical methods to solve the Kondo problem, is therefore a prerequisite for a successful treatment of lattice problems within DMFT.
The application of LDA+DMFT to the transition metal oxides SrxCa1-xVO3, V2O3 as well as elemental Cerium discussed in this paper yield, for example, spectral functions which can be compared with spectroscopic measurements. Remarkably good agreement was found with photoemission and x-ray absorption data of bulk-sensitive experiments. The spectral function of correlated metals are quite generally characterized by a lower Hubbard band, a quasiparticle peak near the Fermi energy, and an upper Hubbard band; the latter is split by Hund’s rule coupling in the case of more than one type of orbital. In the upper Hubbard band the orbital structure of a correlated material is therefore particulary clearly displayed. This spectrum is similar to that of a localized orbital at the impurity site hybridizing with free conduction electrons (“Kondo problem”) although its physical origin is quite different. Namely, in correlated bulk materials the same sort of electrons can provide both the local moments and their screening. DMFT is able to give a consistent explanation of this surprising feature.
In spite of the remarkable successes of the LDA+DMFT approach for the investigation of correlation effects in real materials the method still needs to be improved. Namely, at present the LDA band structure serves only as input information for the DMFT, but there is no feedback from DMFT to LDA. Since correlation effects can, in principle, change the charge distribution on which the LDA band structure depends one needs to feed the changes computed by DMFT back into LDA, and repeat the calculation until convergence is reached in both parts; for a first implementation see Ref.[58].
Realistic calculations should not only include the orbitals of the correlated electrons, but all orbitals. While this is already the case in the Cerium calculations presented here, it is difficult to do in the case of transition metal oxides. To overcome these difficulties, an extended computational scheme has recently been developed in Wannier basis.[67] It will be applied in our future investigations to perform full orbital calculations for correlated materials.
Besides improving the self-consistency of the LDA+DMFT method, there are also attempts to improve on the LDA and the DMFT part. For example, instead of LDA the so-called GW approximation can be employed. The main advantage is that GW is a purely diagrammatic approach. Combined with DMFT, GW+DMFT includes the full contribution of the Hartree diagram, the Fock diagram, and the bubble diagrams for the screening of the Coulomb interaction as well as the (DMFT) local contribution of all Feynman diagrams. A first simplified implementation was reported by Biermann et al.[68].
8 Acknowledgments
We thank J. W. Allen, S. Horn, and S. Suga for valuable discussions. This work was supported by the Deutsche Forschungsgemeinschaft through Sonderforschungsbereich 484 and the Emmy Noether program, by the Russian Basic Research Foundation through grants RFFI-GFEN-03-02-39024_a and RFFI-04-02-16096, by the joint UrO-SO project N22, Grant of President of Russian Federation for young scientists MK-95.2003.02, by the Dynasty Foundation and International Center for Fundamental Physics in Moscow program for young scientists 2004, and by the Russian Science Support Foundation program for young PhD of Russian Academy of Science 2004. We thank A. Sandvik for making his maximum entropy code available to us. Computations were performed at the John von Neumann Institut for Computing, Jülich, and the Leibniz-Rechenzentrum, München.
References
- [1] For a recent review of the electronic correlation problem, see M. Imada, A. Fujimori, and Y. Tokura, Rev. Mod. Phys. 70, 1039 (1998).
- [2] W. Metzner and D. Vollhardt, Phys. Rev. Lett. 62, 324 (1989).
- [3] U. Brandt and C. Mielsch, Z. Phys. B 75, 365 (1989).
- [4] E. Müller-Hartmann, Z. Phys. B 76, 211 (1989).
- [5] V. Janiš, Z. Phys. B 83, 227 (1991); V. Janiš and D. Vollhardt, Int. J. Mod. Phys. 6, 731 (1992).
- [6] A. Georges and G. Kotliar, Phys. Rev. B 45, 6479 (1992).
- [7] M. Jarrell, Phys. Rev. Lett. 69, 168 (1992).
- [8] D. Vollhardt, in Correlated Electron Systems, edited by V. J. Emery, World Scientific, Singapore, 1993, p. 57.
- [9] Th. Pruschke, M. Jarrell, and J. K. Freericks, Adv. in Phys. 44, 187 (1995).
- [10] For a comprehensive review see A. Georges, G. Kotliar, W. Krauth, and M. J. Rozenberg, Rev. Mod. Phys. 68, 13 (1996).
- [11] G. Kotliar and D. Vollhardt, Physics Today 57, No. 3 (March), 53 (2004).
- [12] P.W. Anderson, Phys. Rev. B 124, 41 (1961).
- [13] A.C. Hewson, The Kondo Problem to Heavy Fermions, Cambridge Studies in Magnetism Vol. 2 (Cambridge University Press, Cambridge 1993).
- [14] J. Kondo, Prog. Theor. Phys. 32, 37 (1964).
- [15] P. Nozières, J. Low Temp. Phys. 17, 31 (1974).
- [16] J. Hubbard, Proc. Roy. Soc. London A281, 401 (1964).
- [17] M. C. Gutzwiller, Phys. Rev. Lett. 10, 59 (1963).
- [18] W. F. Brinkman and T. M. Rice, Phys. Rev. B 2, 4302 (1970).
- [19] Th. Pruschke, R. Bulla, and M. Jarrell, Phys. Rev. B 61, 12799 (2000); N. S.Vidhyadhiraja, D. E.Logan, cond-mat/0406009.
- [20] N. F. Mott, Rev. Mod. Phys. 40, 677 (1968); Metal-Insulator Transitions (Taylor & Francis, London, 1990).
- [21] F. Gebhard, The Mott Metal-Insulator Transition (Springer, Berlin, 1997).
- [22] D. B. McWhan and J. P. Remeika, Phys. Rev. B 2, 3734 (1970).
- [23] D. B. McWhan et al., Phys. Rev. B 7, 1920 (1973).
- [24] R. Bulla, Phys. Rev. Lett. 83, 136 (1999).
- [25] M. J. Rozenberg, R. Chitra, and G. Kotliar, Phys. Rev. Lett. 83, 3498 (1999).
- [26] J. Joo, and V. Oudovenko, Phys. Rev. B 64, 193102 (2001).
- [27] R. Bulla, T. A. Costi, and D. Vollhardt, Phys. Rev. B 64, 045103 (2001).
- [28] S. -K. Mo, H. -D. Kim, J. W. Allen, G. -H. Gweon, J. D. Denlinger, J. -H. Park, A. Sekiyama, A. Yamasaki, S. Suga, P. Metcalf, and K. Held, preprint cond-mat/0403094 [Phys. Rev. Lett., in press].
- [29] V. I. Anisimov, A. I. Poteryaev, M. A. Korotin, A. O. Anokhin, and G. Kotliar, J. Phys.: Cond. Matt. 9, 7359 (1997); A. I. Lichtenstein and M. I. Katsnelson, Phys. Rev. B 57, 6884 (1998).
- [30] K. Held, I. A. Nekrasov, N. Blümer, V. I. Anisimov, and D. Vollhardt, Int. J. Mod. Phys. B 15, 2611 (2001); K. Held, I. A. Nekrasov, G. Keller, V. Eyert, N. Blümer, A. K. McMahan, R. T. Scalettar, Th. Pruschke, V. I. Anisimov, and D. Vollhardt, Psi-k Newsletter 56, 65 (2003) [http://psi-k.dl.ac.uk/newsletters/News_56/Highlight_56.pdf].
- [31] A. I. Lichtenstein, M. I. Katsnelson, G. Kotliar, in Electron Correlations and Materials Properties, eds. A. Gonis, N. Kioussis, and M. Ciftan, Kluwer Academic/Plenum, p. 428, New York (2002) [available as cond-mat/0112079].
- [32] M. B. Zölfl, Th. Pruschke, J. Keller, A. I. Poteryaev, I. A. Nekrasov, and V. I. Anisimov, Phys. Rev. B 61, 12810 (2000).
- [33] I. A. Nekrasov, K. Held, N. Blümer, A. I. Poteryaev, V. I. Anisimov, and D. Vollhardt, Euro Phys. J. B 18, 55 (2000).
- [34] J. E. Hirsch and R. M. Fye, Phys. Rev. Lett. 56, 2521 (1986); for multi-band QMC within DMFT see Ref. [30].
- [35] For a review see M. Jarrell and J. E. Gubernatis, Physics Reports 269, 133 (1996).
- [36] A. Fujimori et al., Phys. Rev. Lett. 69, 1796 (1992); A. Fujimori et al., Phys. Rev. B 46, 9841 (1992).
- [37] A. Sekiyama, H. Fujiwara, S. Imada, S. Suga, H. Eisaki, S. I. Uchida, K. Takegahara, H. Harima, Y. Saitoh, I. A. Nekrasov, G. Keller, D. E. Kondakov, A. V. Kozhevnikov, Th. Pruschke, K. Held, D. Vollhardt, and V. I. Anisimov, preprint cond-mat/0312429 [Phys. Rev. Lett., in press]. This joint experimental and theoretical paper supercedes the preprints cond-mat/0206471 and cond-mat/0211508 of the two groups of authors.
- [38] E. Pavarini, S. Biermann, A. Poteryaev, A. I. Lichtenstein, A. Georges, and O.K. Andersen, Phys. Rev. Lett. 92, 176403 (2004).
- [39] A. Liebsch, Phys. Rev. Lett. 90, 096401 (2003); Eur. Phys. J 32, 477 (2003).
- [40] G. Keller, K. Held, V. Eyert, V. I. Anisimov, and D. Vollhardt, cond-mat/0402133 [Phys. Rev. B, in press].
- [41] I. H. Inoue, I. Hase, Y. Aiura, A. Fujimori, K. Morikawa, T. Mizokawa, Y. Haruyama, T. Maruyama and Y. Nishihara, Physica C 235-240, 1007 (1994).
- [42] We note that the absorption measurements were taken at the O K-edge. Therefore the spherical symmetry of the V-2p shell in the final state remains intact. Consequently, the XAS data can be expected to be quite similar to (still unavailable) inverse PES data.
- [43] M. O. Krause and J. H. Oliver, J. Phys. Chem Ref. Data 8, 329 (1979).
- [44] I. H. Inoue, private communication.
- [45] Y. Aiura, F. Iga, Y. Nishihara, H. Ohnuki, H. Kato, Phys. Rev. B 47, 6732 (1993); I.H. Inoue, I. Hase, Y. Aiura, A. Fujimori, Y. Haruyama, T. Maruyama, T. Nishihara, Phys. Rev. Lett. 74, 2539 (1995); I.H. Inoue, O. Goto, H. Makino, N.E. Hussey, M. Ishikawa, Phys. Rev. B 58, 4372 (1998).
- [46] I. H. Inoue, C. Bergemann, I. Hase, and S. R. Julian, Phys. Rev. Lett. 88, 236403 (2002).
- [47] K. Held, G. Keller, V. Eyert, V. I. Anisimov, and D. Vollhardt, Phys. Rev. Lett. 86, 5345 (2001).
- [48] S.-K. Mo, J. D. Denlinger, H.-D. Kim, J.-H. Park, J. W. Allen, A. Sekiyama, A. Yamasaki, K. Kadono, S. Suga, Y. Saitoh, T. Muro, P. Metcalf, G. Keller, K. Held, V. Eyert, V. I. Anisimov, D. Vollhardt, Phys. Rev. Lett. 90, 186403 (2003).
- [49] J. M. Luttinger and J. C. Ward, Phys. Rev. 118, 1417 (1960).
- [50] M. Schramme, Ph.D. thesis, Universität Augsburg, 2000; M. Schramme et al. (unpublished).
- [51] O. Müller, J.-P. Urbach, E. Goering, T. Weber, R. Barth, H. Schuler, M. Klemm, S. Horn, and M. L. denBoer Phys. Rev. B 56, 15056 (1997).
- [52] Handbook on the Physics and Chemistry of Rare Earths, eds. K. A. Gschneider Jr. and L. R. Eyring (North-Holland, Amsterdam, 1978).
- [53] J. S. Olsen, L. Gerward, U. Benedict, and J.-P. Itié, Physica 133B, 129 (1985).
- [54] A. K. McMahan, C. Huscroft, R. T. Scalettar, and E. L. Pollock, J. Comput.-Aided Mater. Design 5, 131 (1998).
- [55] B. Johansson, Philos. Mag. 30, 469 (1974); B. Johansson, I.A. Abrikosov, M. Aldén, A. V. Ruban, and H.L. Skriver Phys. Rev. Lett. 74, 2335 (1995).
- [56] J. W. Allen and R. M. Martin, Phys. Rev. Lett. 49, 1106, (1982).
- [57] L.Z. Liu, J.W. Allen, O. Gunnarson, and O.K. Andersen, Phys. Rev. B 45, 8934 (1992); J.W. Allen, and L.Z. Liu, Phys. Rev. B 46, 5047, (1992); M. Lavagna, C. Lacroix, and M. Cyrot, Phys. Lett. A90, 210 (1982).
- [58] S. Y. Savrasov, G. Kotliar, and E. Abrahams, Nature 410, 793 (2001); S. Y. Savrasov and G. Kotliar, Phys. Rev. B 69, 245101 (2004).
- [59] M. B. Zölfl, I. A. Nekrasov, Th. Pruschke, V. I. Anisimov, and J. Keller, Phys. Rev. Lett. 87, 276403 (2001).
- [60] K. Held, A. K. McMahan, and R. T. Scalettar, Phys. Rev. Lett. 87, 276404 (2001).
- [61] A. K. McMahan, K. Held, and R. T. Scalettar, Phys. Rev. B 67, 75108 (2003).
- [62] K. Held, C. Huscroft, R.T. Scalettar, and A.K. McMahan, Phys. Rev. Lett. 85, 373 (2000); see also C. Huscroft, A. K. McMahan, and R. T. Scalettar, Phys. Rev. Lett. 82, 2342 (1999).
- [63] K. Held and R. Bulla, Eur. Phys. J. B 17, 7 (2000).
- [64] We solve self-consistently for using a self-energy , and then remove this contribution from the eigenvalue sum to get the kinetic energy. The potential energy is taken to be .
- [65] D. M. Wieliczka, C. G. Olson, and D. W. Lynch, Phys. Rev. B 29, 3028 (1984).
- [66] E. Wuilloud, H. R. Moser, W. D. Schneider, and Y. Baer, Phys. Rev. B 28, 7354 (1983).
- [67] V. I. Anisimov, D. E. Kondakov, A. V. Kozhevnikov, I. A. Nekrasov, Z. V. Pchelkina, G. Keller, I. Leonov, X. Ren, D. Vollhardt, J. W. Allen, S.-K. Mo, H.-D. Kim, S. Suga, and A. Sekiyama, cond-mat/0407359.
- [68] S. Biermann, F. Aryasetiawan, and A. Georges, Phys. Rev. Lett. 90, 086402 (2003).
- [69] M. H. Hettler, A. N. Tahvildar-Zadeh, M. Jarrell, T. Pruschke, and H. R. Krishnamurthy, Phys. Rev. B 58, R7475 (1998); M. H. Hettler, M. Mukherjee, M. Jarrell, and H. R. Krishnamurthy, Phys. Rev. B 61, 12739 (2000).
- [70] G. Kotliar, S. Savrasov, G. Pallson, and G. Biroli, Phys. Rev. Lett. 87, 186401 (2001); A. I. Poteryaev, A. I. Lichtenstein, and G. Kotliar, cond-mat/0311319.
- [71] T. Maier, M. Jarrell, T. Pruschke, and M. H. Hettler, cond-mat/0404055.